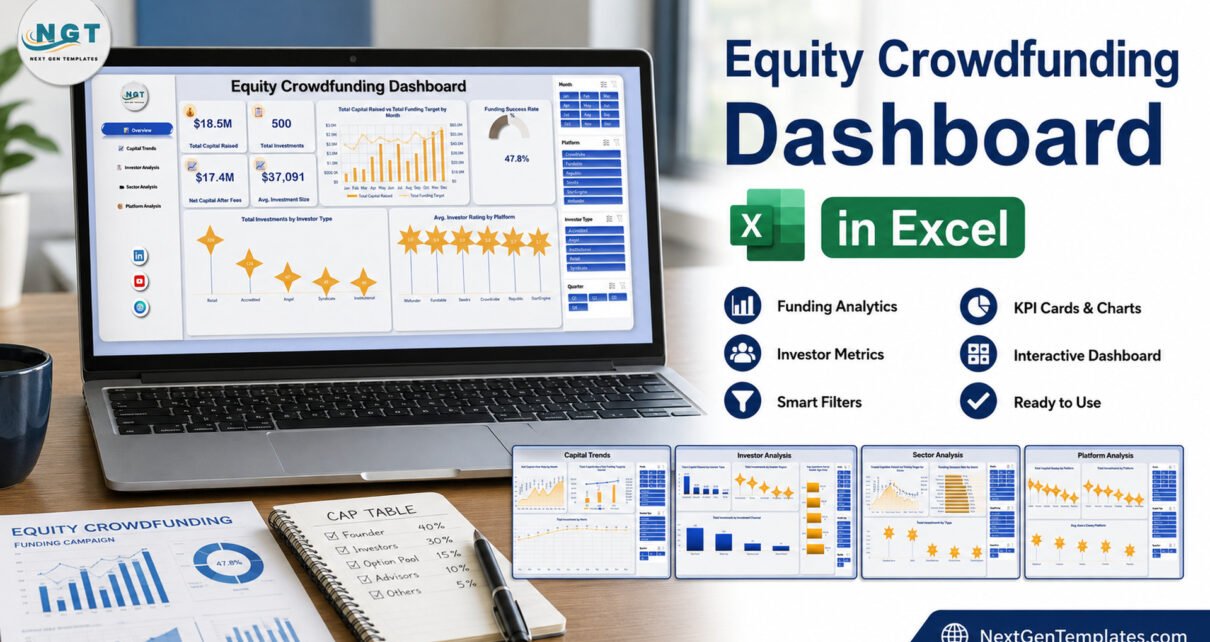
Equity Crowdfunding Dashboard in Excel is a five-page analytical workbook for exploring capital, investment, investor, sector, campaign, and platform data. The sample overview demonstrates $18.5M total capital raised, 500 investments, $17.4M net capital after fees, a $37,091 average investment size, and a 47.8% funding success rate. These figures are sample values rather than claims about current market performance. Replace them with validated records, reconcile the totals, and use the slicers to investigate historical patterns.

Key Features of Equity Crowdfunding Dashboard in Excel
The workbook separates analysis into Overview, Capital Trends, Investor Analysis, Sector Analysis, and Platform Analysis. Four slicer groups – Month, Platform, Investor Type, and Quarter – appear at the right of each page. This creates a consistent path for moving from a broad funding summary to more specific comparisons.
- Four headline KPI cards and one funding success gauge
- Monthly and quarterly capital-versus-target analysis
- Funding-stage and campaign-status comparisons
- Investor type, region, channel, and age-group views
- Sector success rates and top startup comparisons
- Platform capital, investment count, and days-to-close analysis
- Excel slicers for interactive filtering
Dashboard Pages Explained
Overview
The overview answers the first set of descriptive questions: how much capital is represented, how many investments are recorded, how much remains after fees, what the average investment size is, and how raised capital compares with target. Additional visuals break investment counts down by investor type and compare average investor ratings across platforms.
Capital Trends
Capital Trends shows net capital after fees by month, capital raised against target by quarter, investment count by month, and capital raised by funding stage. Users can check whether historical activity concentrates in particular months or stages without treating the pattern as a forecast.

Investor Analysis
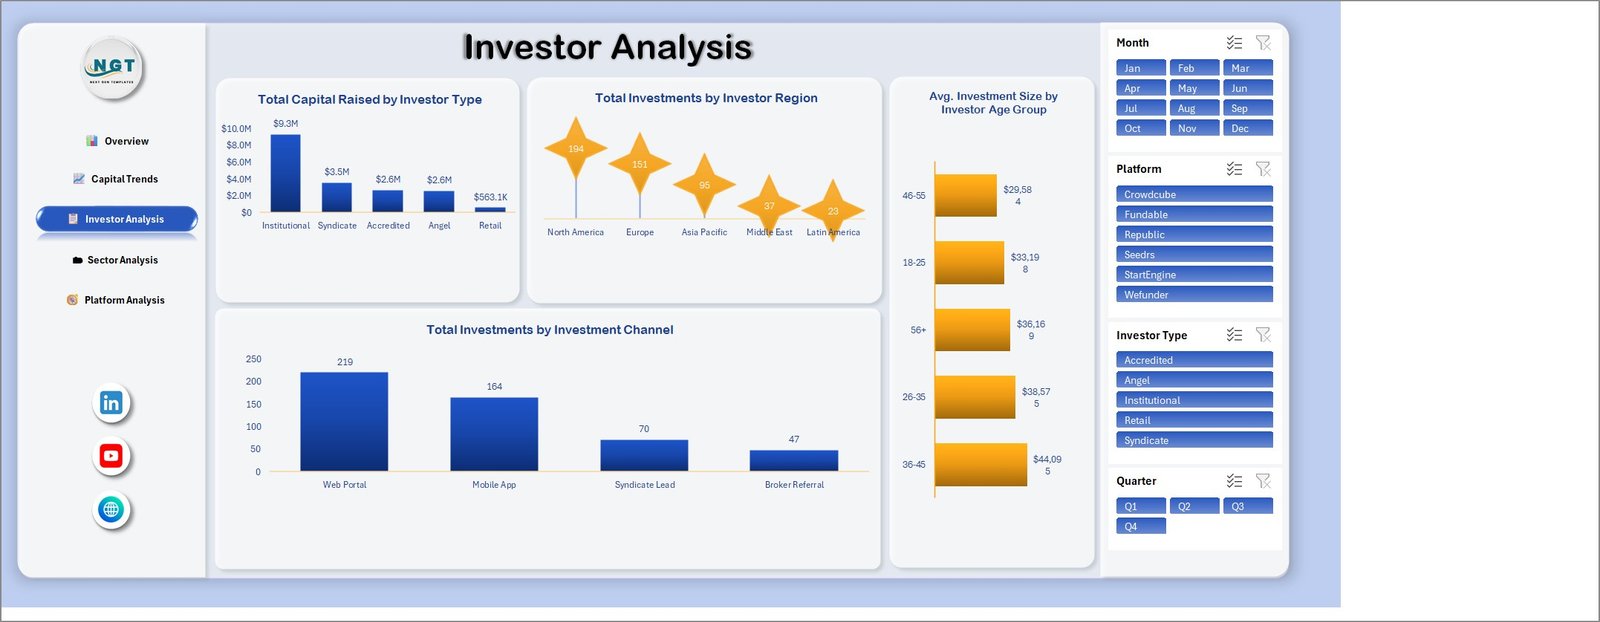
This page compares capital by investor type, investment counts by region and channel, and average investment size by age group. Demographic categories require careful interpretation: descriptive differences do not establish suitability, preference, causation, or expected future behavior.
Sector Analysis
Sector Analysis compares capital with targets, success rates, the top ten startup names by capital raised, and investment count by security type. It supports portfolio and market-description work after the source records have been checked.

Platform Analysis
The final page reviews capital, investment count, average days to close, and campaign status by platform. Names in the sample data illustrate categories and do not constitute platform endorsements or verified current statistics.

Excel Dashboard vs. Power BI vs. Paid Investment Software – Feature Comparison
| Feature | Excel template | Power BI alternative | Paid investment software |
|---|---|---|---|
| Pricing model | One-time download | Desktop plus applicable licensing | Recurring subscription |
| Primary purpose | Historical descriptive analysis | Connected analytical reporting | Operational workflow |
| Offline use | Yes | Desktop | Varies |
| Interactive filtering | Excel slicers | Report slicers | Vendor-dependent |
| Cap-table management | Not included | Not included | May be available |
| Regulatory filing | Not included | Not included | Vendor-dependent |
The Excel template fits analysts who have structured data and want a familiar, editable workbook. Power BI is better when the model must connect to larger sources or support governed refreshes. Specialist software is appropriate when a business needs investor onboarding, permissions, transaction processing, cap-table controls, filings, or audit workflows.
Who Should Use This Template
Crowdfunding platform analysts can review campaigns and platform activity. Finance teams can examine raised capital, targets, and fees. Accelerators and incubators can explore represented sectors and stages. Consultants and researchers can use the pages to communicate descriptive findings from verified records.
The dashboard is not intended for retail investors seeking recommendations, issuers preparing legal disclosures, or firms needing live transaction, cap-table, suitability, KYC, AML, or regulatory filing systems.
Real-World Use Cases
Monthly funding review
A finance analyst filters a month and platform, confirms source totals, and summarizes capital raised against target for an internal meeting.
Investor mix analysis
A research team compares investor types, regions, and channels to describe the composition of a historical dataset.
Sector and stage review
An accelerator compares sectors and funding stages represented in its records, then investigates the underlying campaigns before drawing conclusions.
Advantages of This Excel Dashboard
The workbook keeps five related perspectives in one file and uses familiar Excel controls. Consistent slicers reduce navigation friction, while visible KPI cards create an accessible starting point. The page structure allows a reviewer to move from headline totals to timing, investor, sector, and platform questions without rebuilding charts.
That structure also supports repeatable reporting. A reviewer can begin with the same headline measures each month, document the chosen filters, and follow a consistent sequence when investigating changes. Because each page focuses on a defined analytical angle, stakeholders can discuss capital trends separately from investor composition or platform performance.
Opportunities for Improvement
No automated connector, real-time market feed, cap-table model, valuation engine, forecast, scenario simulation, investor portal, or regulatory workflow is included. Users can customize the source and visuals, but any extension used for financial decisions or external reporting should be tested and independently reviewed.
Organizations with recurring source feeds may want a governed import process, documented refresh checks, and data-quality exceptions. Teams handling confidential investor information may also require access controls, encryption, retention rules, and approved storage beyond what a standalone workbook supplies.
Best Practices
- Keep an untouched copy of the download.
- Document the source, reporting period, currency, and definitions.
- Validate capital, target, fee, and investment totals before refresh.
- Use consistent platform, sector, stage, and investor labels.
- Investigate source rows behind outliers.
- Do not interpret correlation as causation or historical patterns as forecasts.
- Have qualified finance, legal, and compliance personnel review external outputs.
When working with the interactive controls, see Microsoft’s guide to using slicers to filter data. Slicer selections change the visible subset; they do not change or validate the underlying records.
Document metric definitions
Terms such as capital raised, funding target, net capital after fees, investment count, success rate, and days to close must have stable definitions. Decide how cancelled campaigns, refunds, follow-on investments, currency conversions, partial closes, and missing dates are handled before loading the data. Keep those rules in a data dictionary so another reviewer can reproduce the results.
Validate filters and totals
Test the dashboard with one platform, one quarter, and one investor type at a time. Confirm that the filtered KPI cards and chart totals agree with the underlying source rows. Clear all slicers before saving the master distribution copy unless the chosen filter state is intentional and clearly disclosed.
Handle demographic analysis cautiously
The Investor Analysis page includes an age-group view in the sample structure. Use only lawfully collected, appropriate data, and avoid inferring suitability or expected behavior from demographic categories. Aggregate or remove fields when they are unnecessary for the analytical purpose, and involve privacy or compliance owners when required.
Explore Relevant Templates
See the related Crowdfunding Platforms Dashboard in Excel, Power BI edition, VC Portfolio Dashboard in Excel, and Crowdfunding Platforms KPI Dashboard.
Frequently Asked Questions
Is this dashboard investment advice?
No. It summarizes entered data and does not recommend an investment, security, issuer, platform, or strategy.
Does it forecast campaign outcomes?
No. Historical charts and sample success rates are descriptive, not predictive.
Can I use my own dataset?
Yes. Map complete records to the existing structure and validate every total after refresh.
What pages are included?
Overview, Capital Trends, Investor Analysis, Sector Analysis, and Platform Analysis.
What slicers are available?
Month, Platform, Investor Type, and Quarter.
Does it manage investors or cap tables?
No. Use approved specialist systems for onboarding, transactions, ownership, compliance, and filings.
Where can I get the workbook?
Review the Excel dashboard product page on NextGenTemplates.
About the Author
Built by PK – Microsoft Certified Professional with 15+ years of Excel, Google Sheets, and Power BI experience. Founder of NextGenTemplates, reaching 300K+ subscribers across YouTube channels. Every template is hand-built and tested before release.
Conclusion
This five-page workbook provides a structured way to explore historical equity crowdfunding data across capital, investors, sectors, stages, campaigns, and platforms. Treat every sample value as illustrative, reconcile your own records, and keep regulated decisions in qualified hands. See the screenshots and download details on NextGenTemplates. For more Excel guidance, follow PK: An Excel Expert on YouTube.