In today’s fast-paced and competitive fitness industry, it’s crucial for studio managers and owners to have a clear understanding of their business performance. The Fitness Studio KPI Dashboard in Power BI provides an effective way to track and measure key performance indicators (KPIs) that reflect how well a studio is performing. This ready-to-use dashboard is built to track various metrics such as membership, class attendance, revenue generation, and customer satisfaction, among others.
In this article, we will explore the Fitness Studio KPI Dashboard in Power BI, its key features, the advantages of using it, and best practices for maximizing its potential.
Click to Purchases Fitness Studio KPI Dashboard in Power BI
What is a Fitness Studio KPI Dashboard in Power BI?
A Fitness Studio KPI Dashboard in Power BI is a tool designed to monitor and analyze key performance indicators that are critical to the success of a fitness studio. This dashboard pulls data from Excel and presents it in a visual format using Power BI, making it easier to track, compare, and evaluate performance.
The dashboard provides insights into various aspects of fitness studio operations, such as membership engagement, financial health, and operational efficiency. By integrating Power BI’s powerful visualization tools, studio owners can quickly access real-time data to make informed decisions.
Key Features of the Fitness Studio KPI Dashboard in Power BI
The Fitness Studio KPI Dashboard consists of three primary pages within the Power BI application:
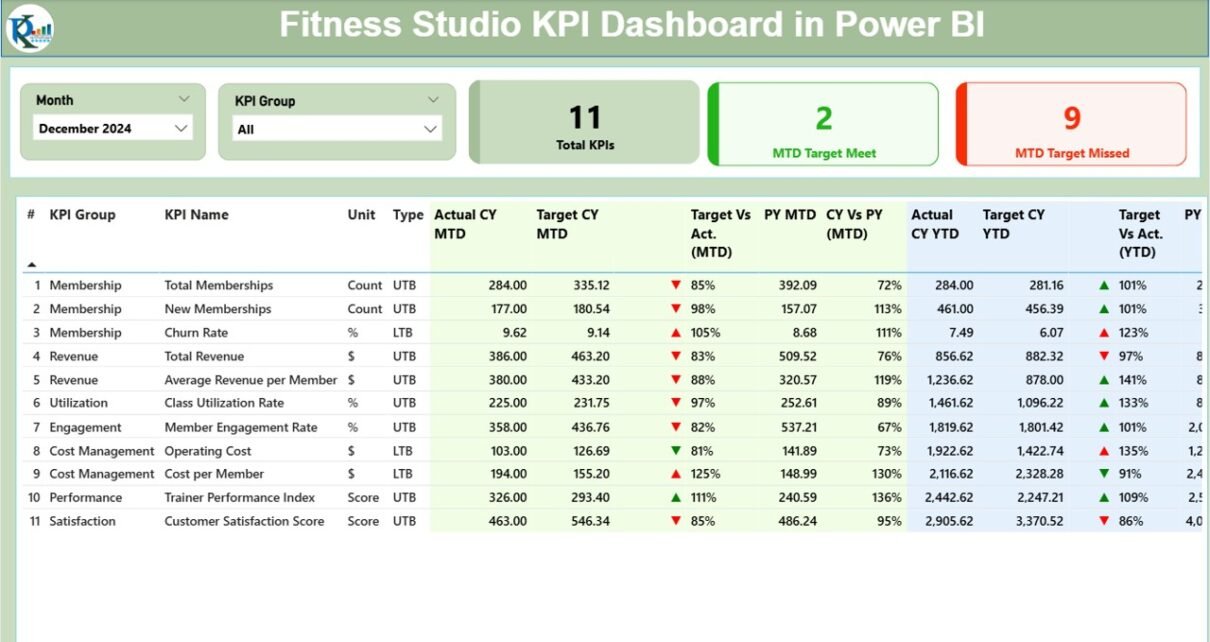
Summary Page
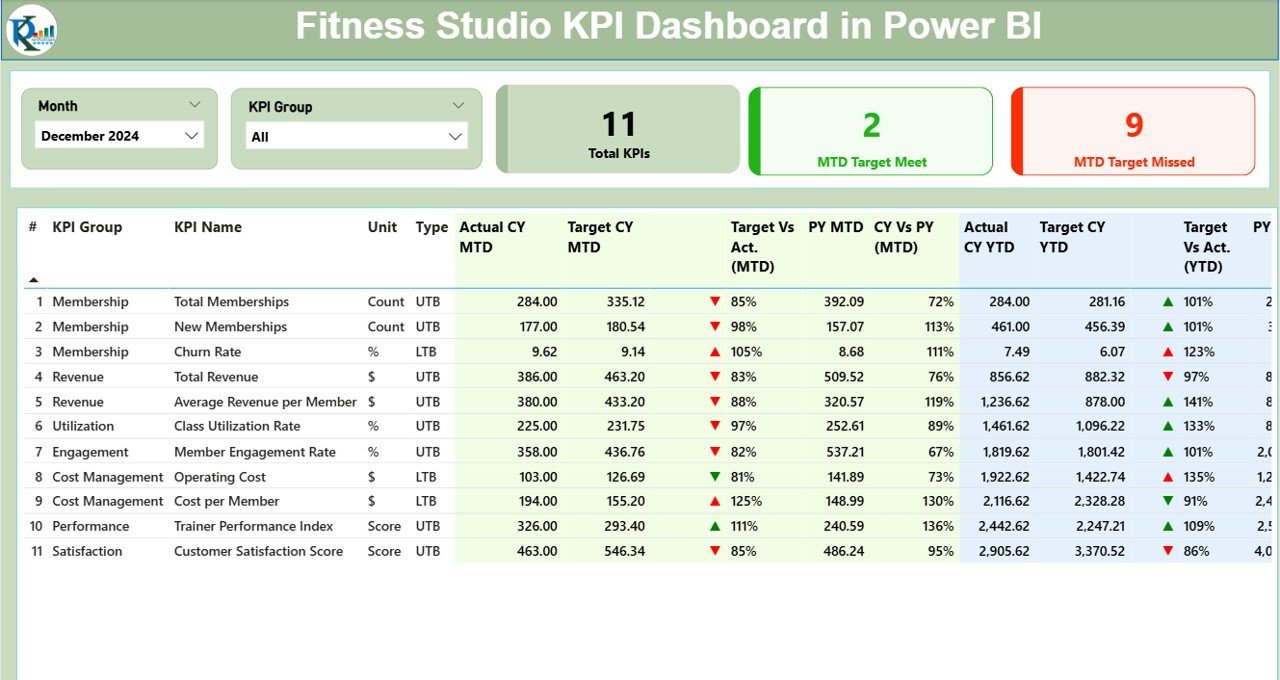
- Main Overview: This page offers a high-level summary of all KPIs. It includes slicers for selecting specific months and KPI groups.
- KPIs Count: Displays the total number of KPIs, as well as how many targets have been met or missed.
- Detailed Table: This table includes the following metrics:
-
-
-
KPI Number: A unique sequence number for each KPI.
-
KPI Group: Categorizes the KPI.
-
KPI Name: The specific KPI being tracked.
-
Unit: The unit of measurement for each KPI.
-
Type: Indicates whether the KPI is Lower the Better (LTB) or Upper the Better (UTB).
-
Actual CY MTD: Current Year – Month-to-Date figures.
-
Target CY MTD: Target figures for Current Year MTD.
-
MTD Icon: Red or green icons indicating whether the KPI is above or below target.
-
Target vs Actual (MTD): Percentage comparison of Target vs Actual.
-
CY Vs PY (MTD): Comparison of Current Year vs Previous Year for MTD numbers.
-
Actual CY YTD: Current Year – Year-to-Date figures.
-
Target CY YTD: Current Year Target YTD numbers.
-
YTD Icon: Indicates whether the YTD numbers meet the target.
-
-
KPI Trend Page
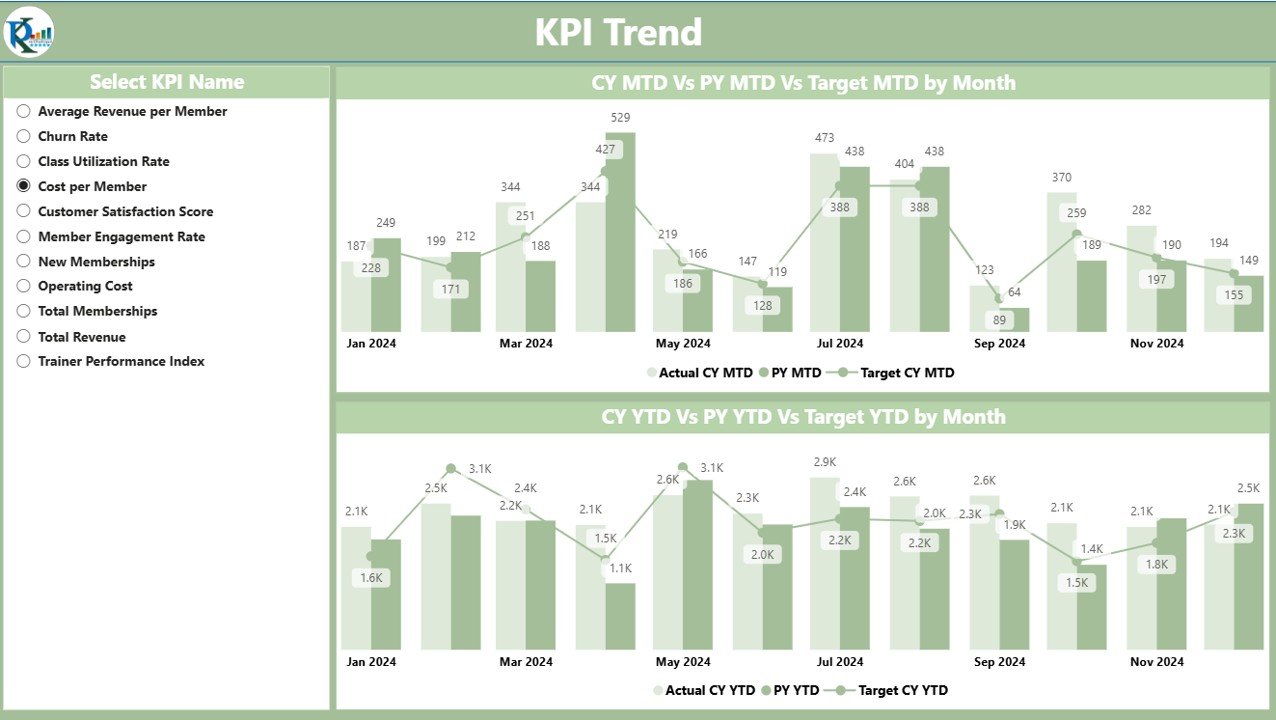
- Combo Charts: Two combo charts display actual numbers for both Current Year (CY) and Previous Year (PY) for both MTD and YTD.
- KPI Slicer: Allows selection of specific KPIs for a more detailed trend analysis.
KPI Definition Page
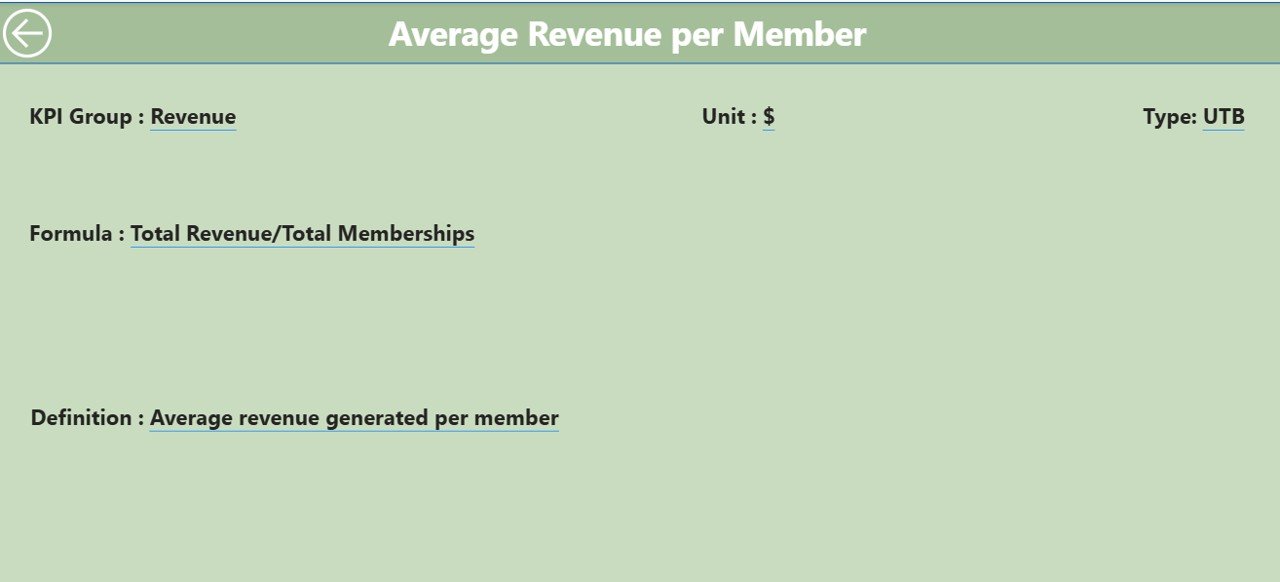
- Drill-through Feature: This hidden page provides the detailed definition and formula for each KPI. Users can drill through from the Summary Page for further insights.
Advantages of Using the Fitness Studio KPI Dashboard in Power BI
-
Centralized Performance Tracking
The Fitness Studio KPI Dashboard consolidates all essential metrics in one place. Studio owners no longer have to rely on multiple reports or fragmented systems. This centralized dashboard ensures that all data is accessible in one view, saving time and effort. -
Real-Time Data Insights
The integration with Power BI means that the dashboard automatically updates when new data is entered into the source Excel file. This allows studio owners and managers to track performance in real-time and make timely adjustments when needed. -
Data-Driven Decision Making
By using clear, visual representations of data, the dashboard makes it easy to identify trends, areas of improvement, and opportunities. With KPI trends displayed in combo charts, users can quickly compare year-to-date and month-to-date performance. -
Increased Operational Efficiency
The dashboard’s easy-to-read format helps managers spot inefficiencies, such as underperforming classes, low membership retention rates, or areas where financial targets aren’t being met. This enables managers to act swiftly and optimize operations for better results. -
Enhanced Member Satisfaction
By tracking key metrics like member engagement and class attendance, studio owners can quickly identify what’s working and what needs improvement. This leads to better customer satisfaction and retention. -
Scalability and Flexibility
The Fitness Studio KPI Dashboard in Power BI is flexible and can be easily scaled to meet the needs of small studios or large fitness chains. As the studio grows, new KPIs can be added, and the dashboard can accommodate increased data without a hitch.
Best Practices for Using the Fitness Studio KPI Dashboard in Power BI
Click to Purchases Fitness Studio KPI Dashboard in Power BI
To make the most out of the Fitness Studio KPI Dashboard in Power BI, it’s important to follow certain best practices:
-
Regular Data Updates
Ensure that the data in the Excel sheets (Input_Actual, Input_Target, and KPI_Definition) is regularly updated. Frequent updates allow the dashboard to reflect the latest information and ensure that decisions are based on accurate data. -
Customize the KPIs
While the dashboard comes with pre-configured KPIs, it is essential to customize them based on your studio’s goals and objectives. For instance, if you’re focusing on revenue generation or class attendance, you can add or modify KPIs to reflect these metrics. -
Use the Drill-Through Feature
Take advantage of the drill-through feature on the KPI Definition page. This helps you to better understand the formula behind each KPI and provides detailed definitions for effective analysis. -
Analyze Trends
The KPI Trend page helps visualize the historical performance of the KPIs. Regularly analyze trends to understand patterns, detect problems early, and take corrective actions. -
Use Slicers for Detailed Insights
Slicers are a powerful feature that allows you to filter the data by month, KPI group, or other parameters. Use slicers to break down the data for deeper analysis and tailored insights. -
Leverage Power BI’s Visualizations
Power BI offers a variety of visualization options, such as combo charts, bar charts, and pie charts. Use these visual tools to present data in a clear and engaging way for your stakeholders.
Conclusion
The Fitness Studio KPI Dashboard in Power BI is an essential tool for any fitness studio looking to streamline its operations and improve performance. By providing real-time data, visual trends, and detailed KPI analysis, this dashboard empowers managers to make data-driven decisions. With customizable features and easy integration with Excel, it helps track a wide range of metrics that impact both business performance and member satisfaction.
By using this dashboard, fitness studio owners and managers can unlock deeper insights into their business performance, optimize their operations, and enhance member experiences—all while driving revenue growth.
Frequently Asked Questions (FAQs)
1. What is a Fitness Studio KPI Dashboard in Power BI?
A Fitness Studio KPI Dashboard in Power BI is a tool used to track and visualize key performance indicators (KPIs) related to the operations of a fitness studio. It helps studio managers monitor performance metrics such as revenue, membership growth, and class attendance.
2. How does the Fitness Studio KPI Dashboard work?
The dashboard pulls data from an Excel file, displaying it in Power BI. Users can see key performance metrics for both the current and previous year, compare actual vs target numbers, and track trends over time.
3. Can I customize the KPIs in the Fitness Studio KPI Dashboard?
Yes, the dashboard is customizable. You can modify existing KPIs or add new ones based on your studio’s specific needs.
4. How do I update the data in the Fitness Studio KPI Dashboard?
To update the data, simply enter the new numbers in the three Excel sheets: Input_Actual, Input_Target, and KPI_Definition. The dashboard will automatically refresh when the data is updated.
5. What are the main benefits of using a KPI dashboard for my fitness studio?
The main benefits include centralized performance tracking, real-time insights, data-driven decision making, improved operational efficiency, and enhanced member satisfaction.
Visit our YouTube channel to learn step-by-step video tutorials