The fitness and wellness industry is growing at a rapid pace, and businesses in this space—from gyms and yoga studios to wellness centers and corporate wellness programs—are increasingly looking for ways to measure and improve their performance. Data-driven decision-making has become a must, and this is where a Fitness & Wellness KPI Dashboard in Excel plays a powerful role.
In this article, we will explore everything about this dashboard: its structure, features, benefits, best practices, opportunities for improvement, and how organizations can use it to achieve their goals.
What Is a Fitness & Wellness KPI Dashboard in Excel?
A Fitness & Wellness KPI Dashboard is a centralized reporting tool designed in Microsoft Excel to track and analyze key performance indicators (KPIs) in the health and wellness sector.
Instead of juggling multiple spreadsheets or manual reports, this dashboard consolidates data into an interactive, user-friendly system. With dropdowns, charts, and conditional formatting, it becomes easy to track monthly and yearly progress against targets.
Whether you are a fitness trainer managing personal clients, a wellness program manager at a corporate level, or a gym owner monitoring operational success, this dashboard provides clarity on performance, efficiency, and growth.
Click to Purchase Fitness & Wellness KPI Dashboard in Excel
Structure of the Fitness & Wellness KPI Dashboard
This ready-to-use Excel dashboard is organized into seven worksheet tabs, each serving a unique purpose:
1. Home Sheet

-
Functions as the index page with six buttons for quick navigation.
-
Users can jump directly to the desired sheet, saving time and effort.
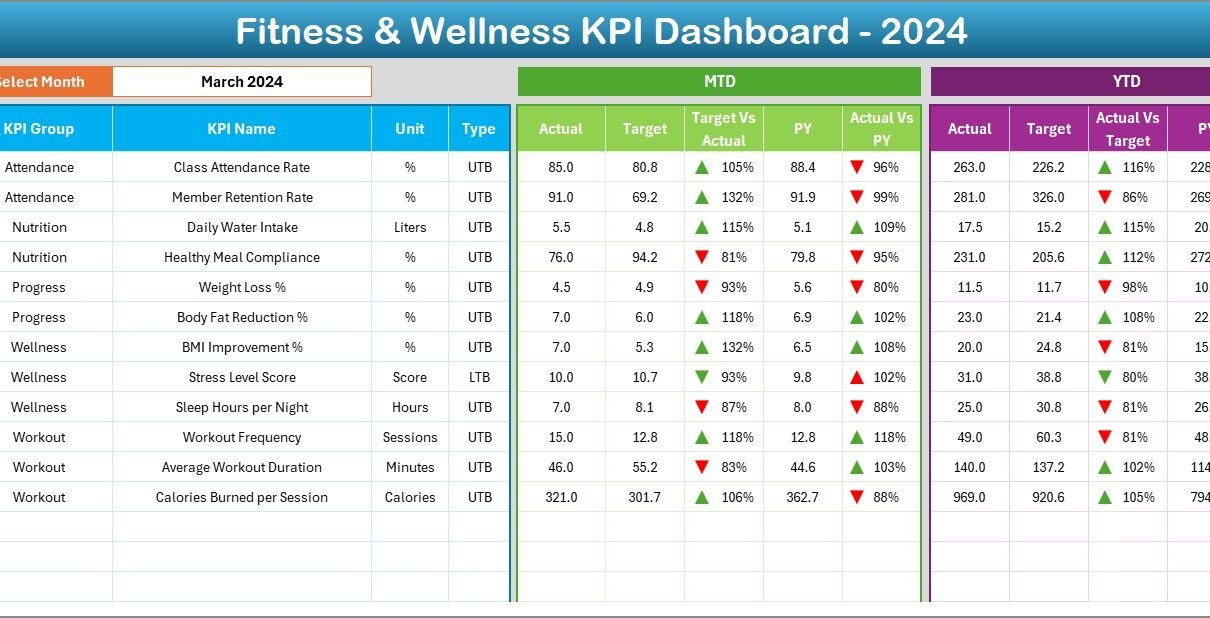
2. Dashboard Sheet Tab

-
The main visualization page displaying all KPIs.
-
Dropdown in cell D3 lets you select the month, updating the entire dashboard instantly.
-
Includes:
-
MTD (Month-to-Date) Actual vs Target vs Previous Year
-
YTD (Year-to-Date) Actual vs Target vs Previous Year
-
Conditional formatting with up/down arrows for quick insights.
-
3. KPI Trend Sheet Tab

-
Dropdown in C3 allows you to pick a KPI and analyze trends.
-
Displays:
-
KPI Group, Unit, Type (UTB or LTB), Formula, and Definition.
-
MTD and YTD trend charts comparing Actual, Target, and Previous Year data.
-
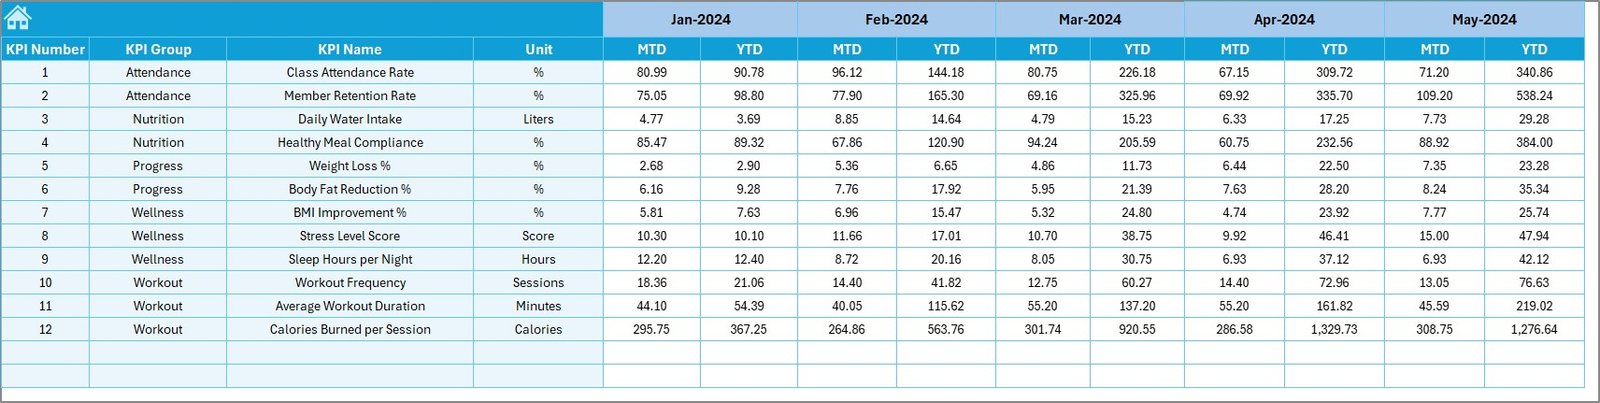
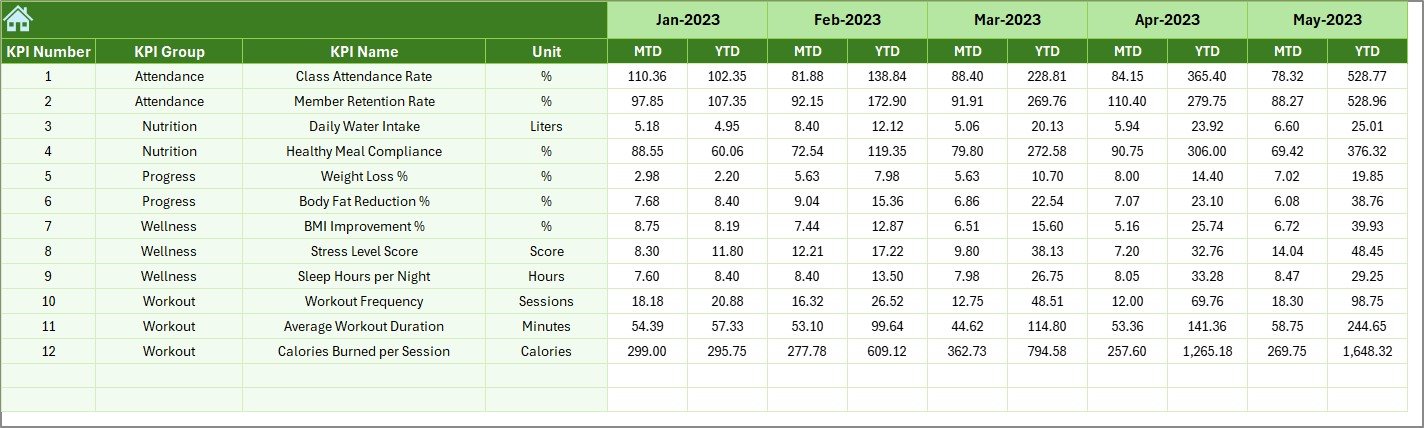
4. Actual Numbers Input Sheet

-
Input section for monthly actual data.
-
Dynamic month setup (range E1) ensures flexibility at the start of every year.
5. Target Sheet Tab
-
Stores monthly target values for each KPI.
-
Tracks both MTD and YTD figures.
6. Previous Year Numbers Sheet Tab
-
A reference sheet to input last year’s data.
-
Enables meaningful comparisons and performance benchmarking.
7. KPI Definition Sheet Tab
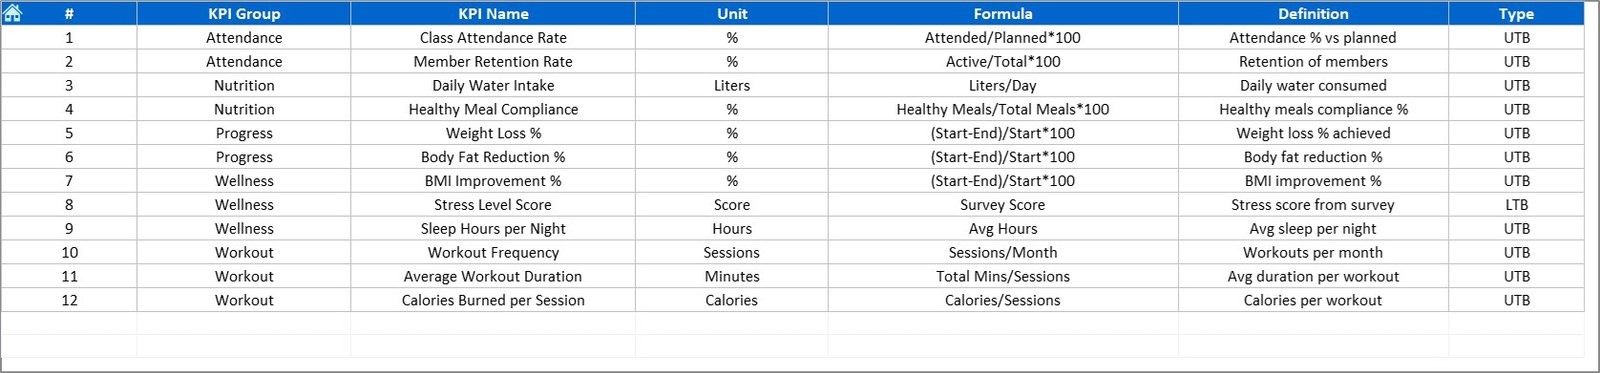
-
Contains essential metadata: KPI name, group, unit, formula, and definition.
-
Ensures transparency and consistency across the dashboard.
Why Do You Need a Fitness & Wellness KPI Dashboard?
Many fitness and wellness organizations rely on manual reporting. This often leads to:
-
Delayed insights
-
Errors in calculations
-
Lack of clear performance tracking
With a dashboard:
-
Managers can see progress in real-time.
-
Comparisons with targets and previous years become effortless.
-
Performance gaps are highlighted visually.
-
Stakeholders can make data-driven decisions faster.
Key KPIs to Track in Fitness & Wellness
A well-structured dashboard focuses on KPIs that directly affect performance and customer satisfaction. Examples include:
-
Membership Growth Rate – Monitors how many new members join monthly.
-
Member Retention Rate – Tracks how many members renew or stay active.
-
Average Class Attendance – Shows engagement levels in group sessions.
-
Revenue per Member – Highlights financial efficiency.
-
Customer Satisfaction Score (CSAT) – Measures client happiness with services.
-
Personal Training Sessions per Month – Tracks coaching activity.
-
Employee Wellness Participation Rate – For corporate wellness programs.
Advantages of the Fitness & Wellness KPI Dashboard
Implementing this dashboard provides several benefits:
-
Centralized Reporting – All data in one place.
-
Real-Time Insights – Immediate updates with dropdown selections.
-
Improved Accuracy – Reduced human errors in calculations.
-
Customizable Structure – Adaptable to different organizations.
-
Comparative Analysis – Evaluate actual vs target vs previous year easily.
-
Visual Representation – Charts, arrows, and color coding simplify interpretation.
-
Time-Saving – Automates monthly and yearly reporting.
Opportunities for Improvement in the Dashboard
Even though this dashboard is powerful, organizations can enhance it further by:
-
Integrating Automation – Use Power Query or VBA for automatic data updates.
-
Expanding KPI Categories – Add wellness-specific metrics like stress reduction rates or BMI improvements.
-
Linking External Data Sources – Connect with fitness apps or CRM tools.
-
Enhancing Visual Design – Incorporate slicers, progress bars, and heat maps.
-
Cloud Collaboration – Shift the file to OneDrive or Google Sheets for team usage.
Best Practices for the Fitness & Wellness KPI Dashboard
- To maximize effectiveness:
✅ Define KPIs Clearly – Ensure every metric has a formula and definition in the KPI Definition sheet.
✅ Update Data Regularly – Keep Actual, Target, and Previous Year sheets up to date.
✅ Use Simple Visuals – Avoid clutter; focus on meaningful charts.
✅ Compare Periods Consistently – Always evaluate MTD and YTD figures.
✅ Protect Input Sheets – Lock formulas and allow entry only in designated cells.
✅ Review Trends Monthly – Use KPI Trend charts to identify patterns early.
✅ Train Users – Ensure staff understand how to use dropdowns and interpret visuals.
- How Organizations Can Use the Dashboard
- Different stakeholders can use this tool in unique ways:
-
Fitness Center Owners – Track membership growth, revenue, and utilization rates.
-
Corporate Wellness Managers – Evaluate employee engagement in wellness programs.
-
Personal Trainers – Measure training session numbers, client progress, and satisfaction.
-
Healthcare Providers – Monitor patient participation in fitness initiatives.
-
Executives & Investors – Assess overall ROI and business sustainability.
Conclusion
- The Fitness & Wellness KPI Dashboard in Excel transforms raw data into actionable insights. With its structured seven-sheet design, interactive charts, and comparative analytics, it becomes a valuable asset for fitness professionals, wellness managers, and decision-makers.
- By adopting this dashboard, organizations can move from guesswork to evidence-based strategies, boosting both performance and customer satisfaction.
Frequently Asked Questions (FAQs)
1. What is the purpose of a Fitness & Wellness KPI Dashboard?
It helps organizations monitor, analyze, and improve performance across fitness and wellness programs by tracking key metrics in a structured manner.
2. Can this dashboard be customized?
Yes, you can easily add or remove KPIs, modify formulas, and adjust visuals to fit your specific needs.
3. Do I need advanced Excel skills to use it?
No. Basic Excel knowledge is enough, as dropdowns and pre-built charts make it user-friendly.
4. How often should I update the data?
You should update the Actual Numbers sheet monthly to keep MTD and YTD performance accurate.
5. Can it be used for corporate wellness programs?
Absolutely. Companies can track employee participation, satisfaction, and wellness outcomes using this dashboard.
6. How is this different from using fitness apps?
Fitness apps usually track individual data, while this dashboard provides organizational-level analysis across KPIs.
7. Can this dashboard track financial performance?
Yes, metrics like revenue per member, cost efficiency, and profit margins can be added and analyzed.
8. What makes Excel a good platform for this dashboard?
Excel is flexible, widely accessible, and does not require specialized software, making it ideal for building cost-effective dashboards.
Visit our YouTube channel to learn step-by-step video tutorials
Click to Purchase Fitness & Wellness KPI Dashboard in Excel