Managing a remote team requires proper planning and organization. One of the biggest challenges remote workers and managers face is
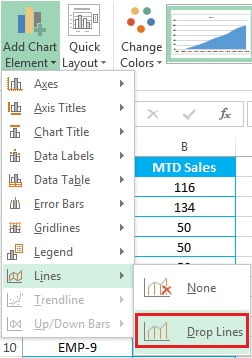
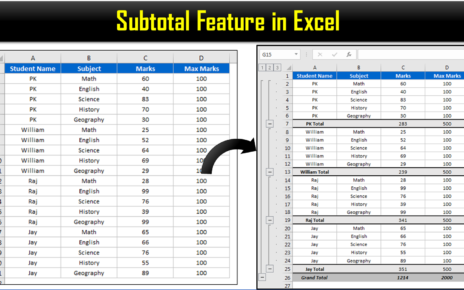
In this article, you will learn about the Subtotal feature of Microsoft Excel. Excel can organize data in groups, allowing
Managing inventory effectively is critical for the success of any business. Conducting regular inventory audits ensures accuracy, reduces losses, and