Heritage tourism plays a vital role in preserving culture and boosting local economies. Historical monuments attract visitors daily. Cultural festivals increase footfall seasonally. Government policies influence funding and restoration activities. Therefore, tourism authorities and heritage site managers must track performance carefully.
However, many organizations still rely on scattered spreadsheets. As a result, they miss trends. They overlook revenue fluctuations. They fail to measure visitor engagement properly.
So, how can you monitor visitor numbers, ticket revenue, restoration costs, event participation, and overall tourism growth in one structured system?
The answer is simple.
You need a Heritage Tourism KPI Dashboard in Excel.
In this comprehensive guide, you will learn:
-
What a Heritage Tourism KPI Dashboard in Excel is
-
Why heritage tourism organizations need it
-
Detailed explanation of all 7 worksheets
-
Key KPIs to include
-
Advantages of Heritage Tourism KPI Dashboard in Excel
-
Best Practices for the Heritage Tourism KPI Dashboard
-
Frequently Asked Questions with Answers
Let’s explore everything step by step.
Click to Purchases Heritage Tourism KPI Dashboard in Excel
What Is a Heritage Tourism KPI Dashboard in Excel?
A Heritage Tourism KPI Dashboard in Excel is a ready-to-use performance tracking template designed specifically for heritage tourism management.
It helps you:
-
Track visitor growth
-
Monitor ticket revenue
-
Compare MTD and YTD performance
-
Analyze target vs actual results
-
Measure year-over-year improvement
-
Evaluate operational efficiency
Instead of reviewing tourism data randomly, you follow a structured KPI framework. Therefore, you gain clarity. Moreover, you improve planning decisions.
Why Do Heritage Tourism Organizations Need a KPI Dashboard?
Heritage tourism involves many moving factors. Visitor inflow changes monthly. Festival seasons increase demand. Maintenance costs fluctuate. Therefore, consistent monitoring becomes essential.
Without KPI tracking:
-
Revenue trends remain unclear
-
Marketing campaigns lack measurable results
-
Budget allocation becomes inaccurate
-
Visitor satisfaction drops
However, when you implement a Heritage Tourism KPI Dashboard in Excel:
-
You monitor performance monthly
-
You compare actual vs target instantly
-
You detect performance gaps early
-
You improve resource planning
As a result, you enhance both preservation and profitability.
Click to Purchases Heritage Tourism KPI Dashboard in Excel
What Are the Key Features of Heritage Tourism KPI Dashboard in Excel?
This ready-to-use dashboard contains 7 structured worksheets, each designed to manage a specific function.
Let’s understand them in detail.
1️⃣ Home Sheet – Easy Navigation Center

The Home Sheet works as an index page.
Here, you get 6 navigation buttons that help you jump to different sheets instantly.
Instead of scrolling through multiple tabs, you click once and access the required section. Therefore, navigation becomes smooth and efficient.
Click to Purchases Heritage Tourism KPI Dashboard in Excel
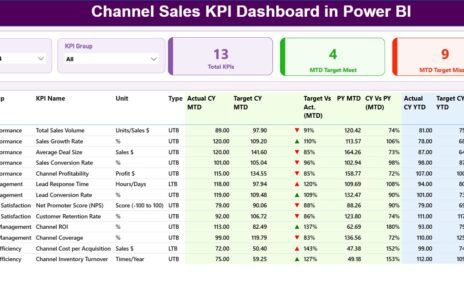
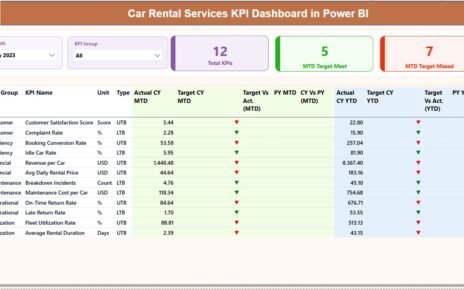
2️⃣ Dashboard Sheet – Main Performance Overview

The Dashboard Sheet is the heart of this template.
At cell D3, you can select the Month from a dropdown list. As soon as you change the month, the entire dashboard updates automatically.
What Does the Dashboard Display?
For every KPI, it shows:
✔ MTD (Month-to-Date) Data
-
Actual
-
Target
-
Previous Year
-
Target vs Actual difference
-
Previous Year vs Actual difference
✔ YTD (Year-to-Date) Data
-
Actual
-
Target
-
Previous Year
-
Target vs Actual difference
-
Previous Year vs Actual difference
The dashboard uses conditional formatting with up and down arrows. Therefore, you instantly identify performance improvement or decline.
Because of visual clarity, managers make faster decisions.
Click to Purchases Heritage Tourism KPI Dashboard in Excel
3️⃣ KPI Trend Sheet – Analyze Performance Over Time

The KPI Trend Sheet helps you analyze trends deeply.
At cell C3, you can select any KPI from the dropdown.
Once selected, the sheet displays:
-
KPI Group
-
Unit of KPI
-
Type of KPI (Lower the Better or Upper the Better)
-
KPI Formula
-
KPI Definition
Therefore, you understand the metric clearly before analyzing it.
What Charts Are Available?
The sheet displays:
-
MTD Trend Chart (Actual vs Target vs Previous Year)
-
YTD Trend Chart (Actual vs Target vs Previous Year)
Because of trend visualization, you identify seasonal growth, festival spikes, and off-season declines easily.
Click to Purchases Heritage Tourism KPI Dashboard in Excel
4️⃣ Actual Numbers Input Sheet – Enter Monthly Performance Data

The Actual Numbers Input Sheet is where you enter real data.
At cell E1, you input the first month of the year. Then, you enter:
-
Monthly MTD values
-
Monthly YTD values
Since Excel connects this sheet to the dashboard automatically, updated data reflects instantly.
Therefore, the dashboard always stays current.
5️⃣ Target Sheet – Define Performance Goals

In the Target Sheet, you enter target values for each KPI.
You define:
-
Monthly MTD targets
-
Monthly YTD targets
Because targets guide performance, this sheet becomes crucial.
Without clear targets, performance measurement loses meaning.
Click to Purchases Heritage Tourism KPI Dashboard in Excel
6️⃣ Previous Year Number Sheet – Year-on-Year Comparison

In this sheet, you enter data from the previous year.
You input:
-
MTD numbers
-
YTD numbers
This comparison helps you measure growth accurately.
For example:
-
Visitor growth rate
-
Revenue improvement percentage
-
Cost reduction trend
Therefore, you gain valuable insights into long-term performance.
Click to Purchases Heritage Tourism KPI Dashboard in Excel
7️⃣ KPI Definition Sheet – KPI Documentation Hub

The KPI Definition Sheet ensures clarity.
Here, you enter:
-
KPI Name
-
KPI Group
-
Unit
-
Formula
-
Definition
For example:
-
Visitor Growth Rate = (Current Visitors – Previous Visitors) ÷ Previous Visitors × 100
-
Revenue per Visitor = Total Revenue ÷ Total Visitors
Because definitions remain clear, data interpretation becomes accurate.
Which KPIs Should You Track in Heritage Tourism?
You should include both operational and financial KPIs.
🎟 Visitor KPIs
-
Total Visitors
-
Domestic Visitors
-
International Visitors
-
Repeat Visitor Rate
-
Event Participation Rate
💰 Financial KPIs
-
Ticket Revenue
-
Average Revenue per Visitor
-
Merchandise Sales
-
Donation Revenue
-
Restoration Budget Utilization
🏛 Operational KPIs
-
Site Maintenance Cost
-
Staff Efficiency
-
Event Success Rate
-
Customer Satisfaction Score
When you track these KPIs consistently, you strengthen both tourism growth and heritage preservation.
Click to Purchases Heritage Tourism KPI Dashboard in Excel
How Does the Dashboard Improve Decision-Making?
Let’s understand this clearly.
First, It Improves Visibility
All KPIs appear on one dashboard. Therefore, leadership gains full control.
Second, It Identifies Performance Gaps
Conditional formatting highlights weak areas. Thus, managers act quickly.
Third, It Enables Strategic Planning
Trend charts reveal seasonal patterns. Consequently, you plan marketing campaigns effectively.
Fourth, It Supports Budget Allocation
Accurate data supports smarter budget decisions.
Advantages of Heritage Tourism KPI Dashboard in Excel
Using this Excel dashboard offers many advantages.
1️⃣ Easy to Use
You do not require advanced technical skills.
2️⃣ Cost-Effective
You avoid expensive tourism analytics software.
3️⃣ Real-Time Data Updates
Once you update data, the dashboard reflects changes instantly.
4️⃣ Structured KPI Tracking
All KPIs follow a standardized format.
5️⃣ Clear Visual Indicators
Up and down arrows simplify performance understanding.
6️⃣ Customizable
You can add or modify KPIs anytime.
7️⃣ Improved Accountability
Clear targets increase team responsibility.
Click to Purchases Heritage Tourism KPI Dashboard in Excel
Best Practices for the Heritage Tourism KPI Dashboard
To maximize benefits, follow these best practices.
✔ Update Data Monthly
Regular updates maintain dashboard accuracy.
✔ Set Realistic Targets
Define achievable goals based on historical data.
✔ Review Trends Quarterly
Analyze quarterly performance to adjust strategies.
✔ Focus on Core KPIs
Avoid overcrowding the dashboard.
✔ Train Staff on KPI Definitions
Ensure everyone understands formulas and metrics.
✔ Use Data for Strategic Planning
Apply insights to improve visitor experience.
Who Can Use This Dashboard?
This dashboard suits:
-
Heritage site managers
-
Tourism boards
-
Cultural event organizers
-
Government tourism departments
-
Museum administrators
Therefore, any organization managing heritage tourism can use it effectively.
Click to Purchases Heritage Tourism KPI Dashboard in Excel
How Does It Support Sustainable Tourism Growth?
A structured KPI dashboard:
-
Improves financial transparency
-
Enhances visitor management
-
Supports restoration planning
-
Strengthens marketing strategies
-
Increases revenue sustainability
Consequently, heritage preservation and tourism growth move forward together.
Conclusion
Heritage tourism demands careful planning and performance monitoring. Visitor patterns shift. Revenue changes. Operational costs fluctuate. Therefore, structured tracking becomes essential.
The Heritage Tourism KPI Dashboard in Excel offers a powerful yet simple solution.
It provides monthly and yearly comparisons. It highlights performance trends. It supports strategic decisions.
Moreover, it ensures transparency and accountability.
If you want to manage heritage tourism performance effectively without complex systems, this Excel dashboard provides everything you need.
Because when you measure tourism performance clearly, you preserve heritage successfully.
Click to Purchases Heritage Tourism KPI Dashboard in Excel
Frequently Asked Questions with Answers
1️⃣ What is a Heritage Tourism KPI Dashboard in Excel?
It is a ready-to-use Excel template designed to track and analyze heritage tourism performance metrics.
2️⃣ Can I customize the KPIs?
Yes. You can add, modify, or remove KPIs based on your organization’s needs.
3️⃣ What does MTD and YTD mean?
-
MTD stands for Month-to-Date performance.
-
YTD stands for Year-to-Date performance.
4️⃣ Do I need advanced Excel skills?
No. Basic Excel knowledge is sufficient.
5️⃣ How often should I update the dashboard?
You should update it monthly for accurate analysis.
6️⃣ Can government tourism departments use this dashboard?
Yes. It suits both public and private tourism organizations.
7️⃣ Why is year-on-year comparison important?
Because it helps measure long-term growth and improvement.
Click to Purchases Heritage Tourism KPI Dashboard in Excel
Visit our YouTube channel to learn step-by-step video tutorials