Home décor retail is a highly competitive and trend-driven industry. Store owners, managers, and decision-makers constantly track sales performance, customer satisfaction, operating costs, and promotional effectiveness. However, when teams manage this data across multiple spreadsheets, reports quickly become confusing and time-consuming.
That is exactly why a Home Décor Stores Dashboard in Excel becomes an essential business intelligence tool.
In this detailed guide, you will learn what a Home Décor Stores Dashboard in Excel is, why décor retailers need it, how it works, its page-wise structure, key metrics, advantages, best practices, and frequently asked questions. Moreover, this article uses simple language, smooth transitions, and practical explanations to ensure strong SEO performance and easy understanding.
Click to Purchases Home Décor Stores Dashboard in Excel
What Is a Home Décor Stores Dashboard in Excel?
A Home Décor Stores Dashboard in Excel is a ready-to-use, interactive reporting template designed to analyze and visualize key retail performance metrics in one place.
Instead of tracking sales, profit, marketing cost, and customer ratings across multiple files, this dashboard consolidates everything into a single Excel workbook. As a result, store managers gain instant insights into business performance.
Moreover, because Excel remains familiar and widely used, teams can adopt this dashboard quickly without learning complex BI tools.
Why Do Home Décor Stores Need a Dashboard in Excel?
Home décor businesses deal with multiple product categories, regions, promotions, and seasonal demand. Therefore, manual reporting slows down decision-making.
A Home Décor Stores Dashboard in Excel helps because it:
-
Brings all key metrics into one view
-
Highlights profit and cost trends instantly
-
Improves visibility across regions and product categories
-
Supports faster and data-driven decisions
As a result, retailers can respond quickly to changing customer preferences and market conditions.
How Does a Home Décor Stores Dashboard in Excel Work?
The dashboard works by connecting structured data from a Data Sheet to pre-built pivot tables, charts, and KPI visuals.
First, users enter or paste transactional data such as sales, costs, regions, promotions, and customer ratings.
Next, Excel processes this data automatically using formulas and pivot logic.
Finally, slicers allow users to filter insights dynamically across different pages.
Because of this structure, users can analyze performance without writing complex formulas.
Key Features of Home Décor Stores Dashboard in Excel
Before diving into each page, let us understand the core features that make this dashboard powerful.
Page Navigator for Easy Navigation
The dashboard includes a Page Navigator located on the left side. This navigator allows users to switch between analytical pages with a single click.
As a result, users do not waste time scrolling through sheets.
Right-Side Slicers for Interactive Analysis
Each analytical page includes right-side slicers. These slicers allow filtering data by dimensions such as region, category, promotion type, or month.
Therefore, users gain dynamic insights instantly.
Page-Wise Structure of Home Décor Stores Dashboard in Excel
This dashboard consists of five structured analytical pages, each serving a specific business purpose.
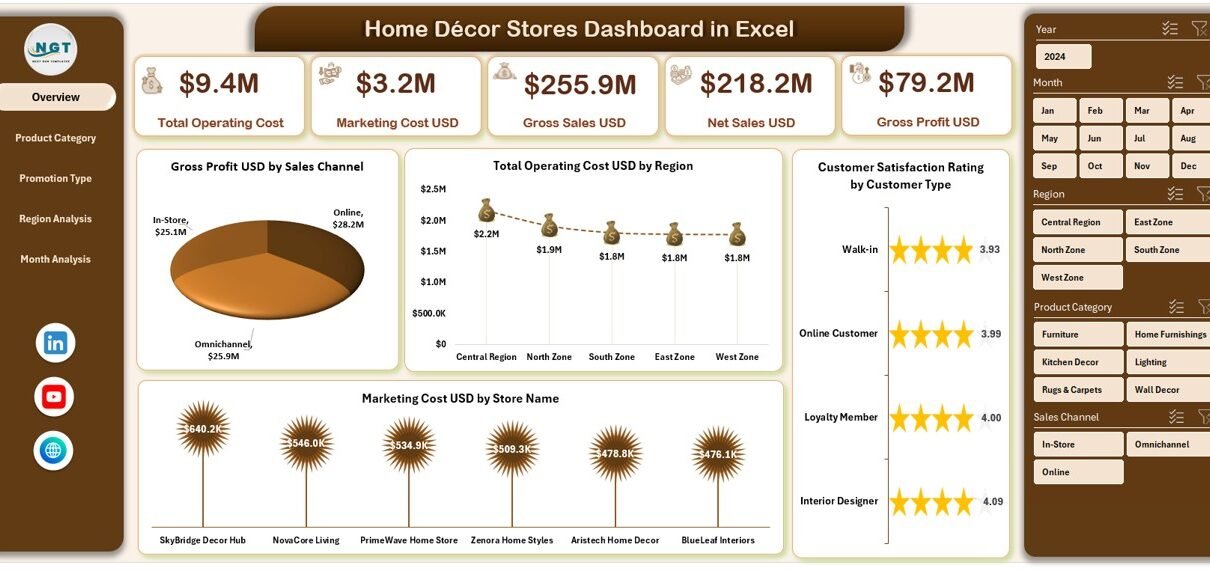
1. Overview Page – How Is Overall Store Performance Measured?
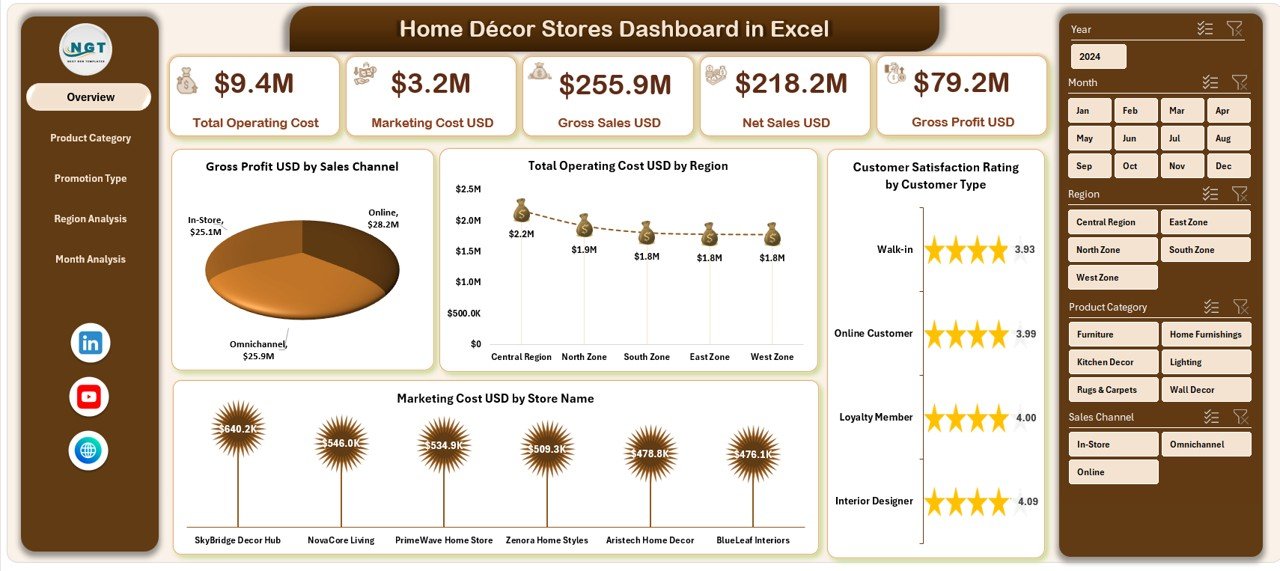
The Overview Page acts as the control center of the dashboard.
What Does the Overview Page Show?
This page includes four KPI cards and four analytical charts, offering a snapshot of overall business health.
KPI Cards on the Overview Page
Although the cards summarize high-level metrics, they quickly highlight business performance at a glance.
Charts on the Overview Page
The Overview Page includes the following charts:
-
Gross Profit USD by Sales Channel
This chart shows which sales channels contribute the most profit. -
Total Operating Cost USD by Region
This visualization helps identify high-cost regions. -
Customer Satisfaction Rating by Customer Type
This chart reveals how different customer segments perceive your brand. -
Marketing Cost USD by Store Name
This insight helps track store-wise marketing spending.
Because of these visuals, managers can immediately spot strengths and weaknesses.
2. Product Category Analysis – Which Products Drive Profitability?
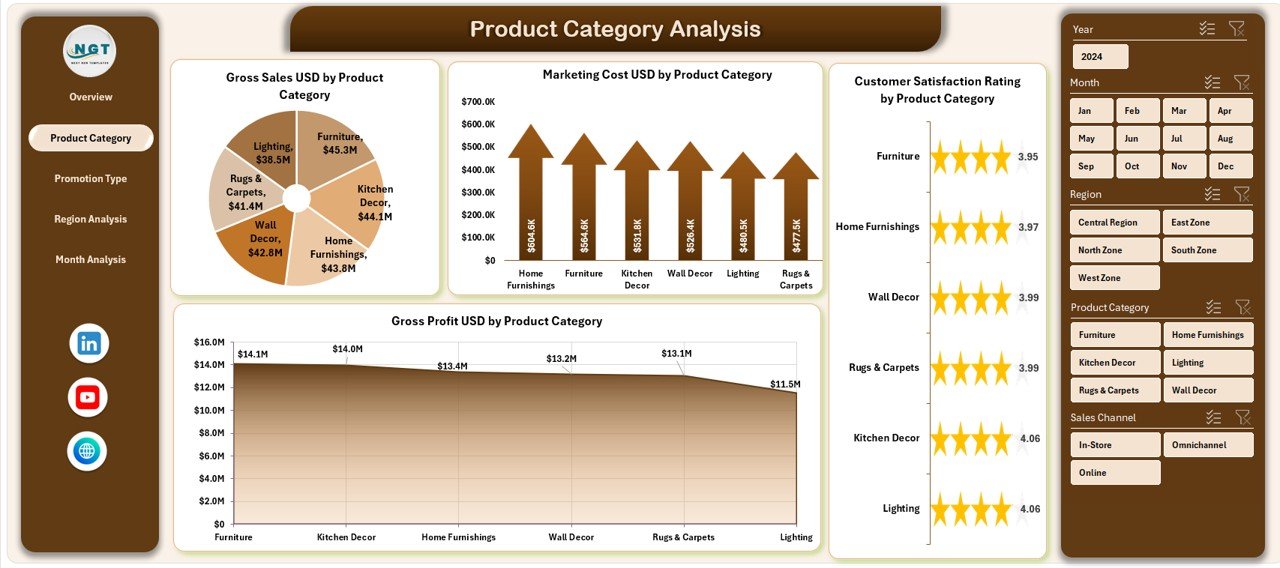
Product mix plays a crucial role in home décor retail. Therefore, the Product Category Analysis Page focuses entirely on category-level insights.
What Is the Purpose of Product Category Analysis?
This page helps retailers understand which décor categories perform best in terms of profit, cost, and customer satisfaction.
Charts on Product Category Analysis Page
The page includes four charts:
-
Gross Profit USD by Product Category
This chart identifies high-margin categories. -
Customer Satisfaction Rating by Product Category
This insight highlights customer preferences. -
Marketing Cost USD by Product Category
This chart tracks marketing spend allocation. -
Gross Profit USD by Product Category (Trend View)
This visualization helps compare profitability across categories. -
Click to Purchases Home Décor Stores Dashboard in Excel
As a result, store managers can refine inventory and pricing strategies.
3. Promotion Type Analysis – Are Promotions Driving Sales Effectively?
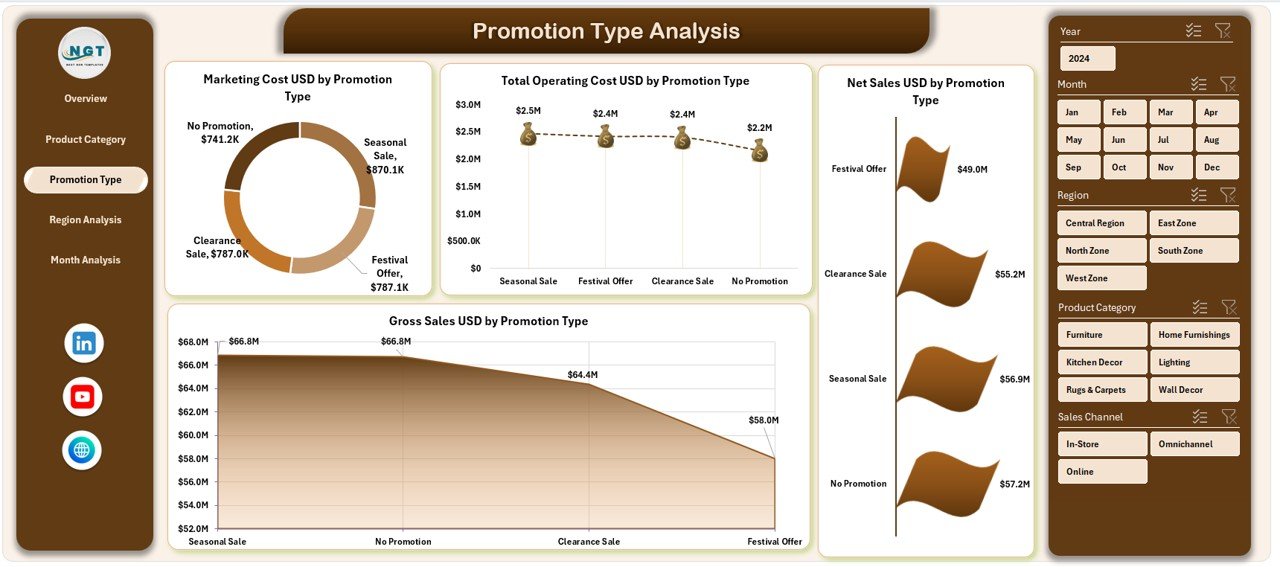
Promotions attract customers, but they also increase costs. Therefore, understanding promotion performance becomes essential.
Why Is Promotion Type Analysis Important?
This page evaluates whether promotions actually improve sales and profit or simply increase expenses.
Charts on Promotion Type Analysis Page
The dashboard includes:
-
Marketing Cost USD by Promotion Type
This chart highlights spending by promotion strategy. -
Total Operating Cost USD by Promotion Type
This view reveals cost-heavy promotions. -
Net Sales USD by Promotion Type
This insight shows revenue impact. -
Gross Profit USD by Promotion Type
This chart evaluates profitability after costs.
As a result, retailers can optimize promotional campaigns effectively.
4. Region Analysis – Which Regions Perform Best?
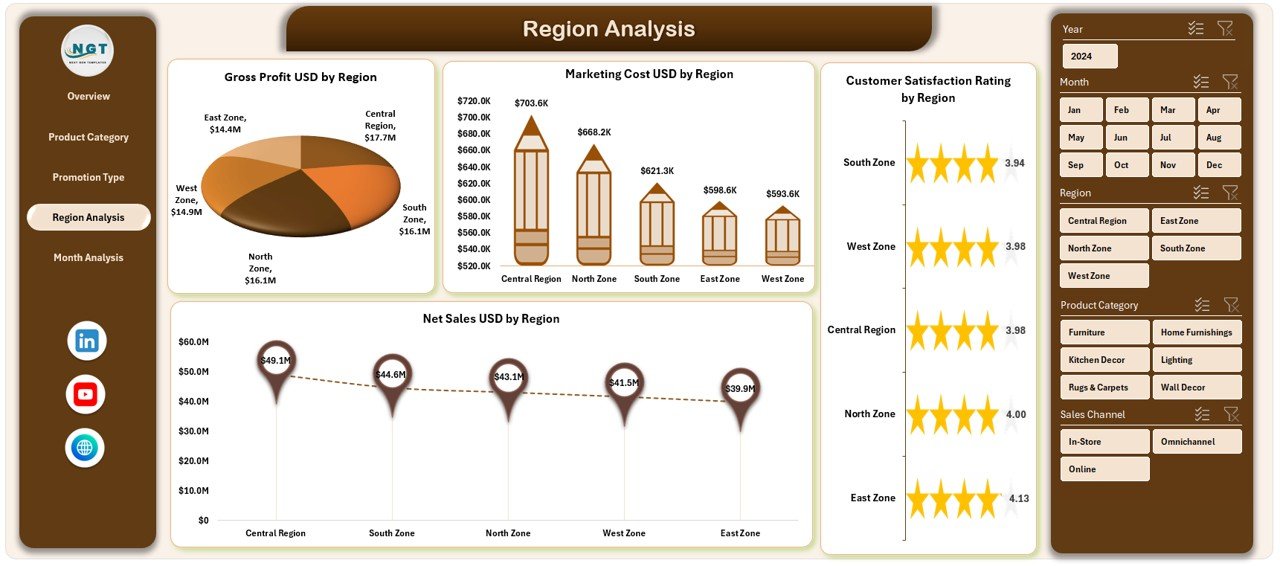
Home décor sales often vary significantly by region. Therefore, regional analysis becomes essential.
Purpose of Region Analysis Page
This page helps management compare performance across geographic regions.
Charts on Region Analysis Page
The page includes four charts:
-
Gross Profit USD by Region
This chart identifies high-performing regions. -
Marketing Cost USD by Region
This visualization highlights marketing spend distribution. -
Customer Satisfaction Rating by Region
This insight helps understand regional customer experience. -
Net Sales USD by Region
This chart shows revenue contribution by region.
Because of this analysis, businesses can allocate resources more strategically.
Click to Purchases Home Décor Stores Dashboard in Excel
5. Month Analysis – How Does Performance Change Over Time?
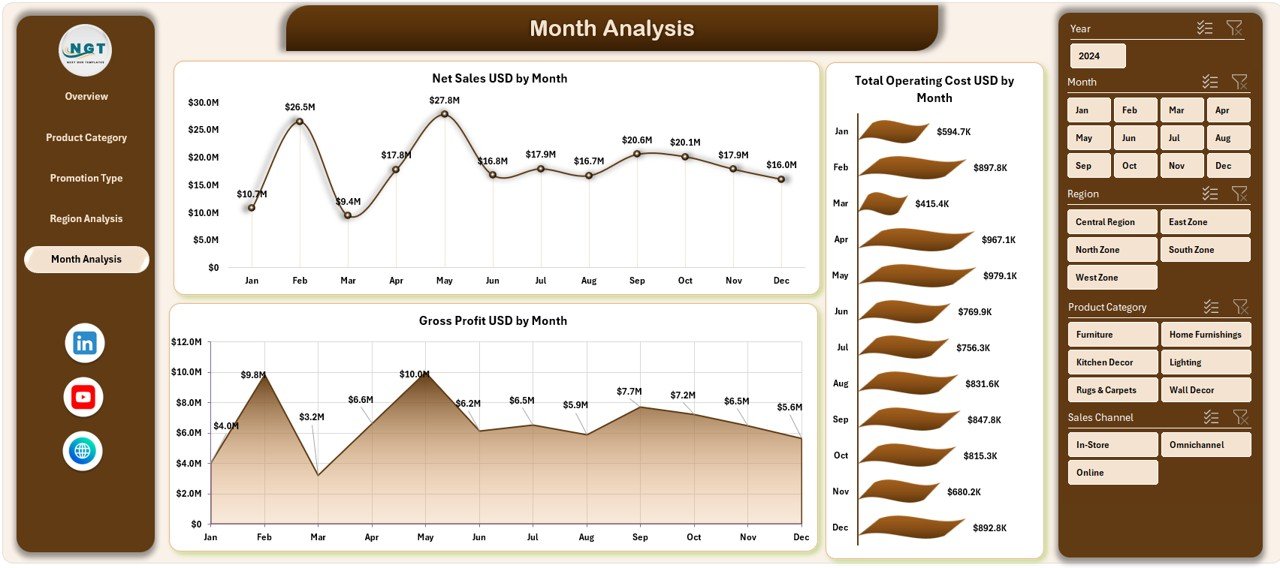
Seasonality strongly affects home décor sales. Therefore, the Month Analysis Page tracks performance trends over time.
Why Is Month Analysis Critical?
This page helps identify seasonal demand patterns, cost spikes, and profit trends.
Charts on Month Analysis Page
The page includes three charts:
-
Net Sales USD by Month
This chart reveals sales seasonality. -
Total Operating Cost USD by Month
This view tracks cost fluctuations. -
Gross Profit USD by Month
This insight highlights monthly profitability trends.
As a result, managers can plan inventory and promotions more accurately.
Support Sheet and Data Sheet – How Does the Backend Work?
Data Sheet
The Data Sheet stores raw transactional data such as:
-
Sales amounts
-
Costs
-
Regions
-
Product categories
-
Promotion types
-
Customer ratings
-
Months
Because the data remains structured, Excel can generate reliable insights.
Support Sheet
The Support Sheet contains helper tables, calculations, and lookup logic that power slicers and charts.
As a result, users experience smooth and accurate reporting.
Advantages of Home Décor Stores Dashboard in Excel
Using this dashboard delivers several business advantages.
1. Centralized Reporting
The dashboard consolidates all critical metrics into one Excel file.
2. Faster Decision-Making
Because insights appear instantly, managers can act quickly.
3. Improved Cost Control
The dashboard highlights cost-heavy regions, promotions, and categories.
4. Better Product Strategy
Category-level insights help optimize inventory and pricing.
5. Enhanced Customer Experience
Customer satisfaction analysis supports service improvements.
Who Can Use a Home Décor Stores Dashboard in Excel?
This dashboard suits a wide range of users:
-
Home décor store owners
-
Retail managers
-
Sales and marketing teams
-
Regional managers
-
Finance and operations teams
Because Excel remains accessible, teams of all skill levels can use it.
Best Practices for the Home Décor Stores Dashboard in Excel
To maximize value, follow these best practices.
1. Keep Data Clean and Updated
Always update the Data Sheet regularly. Clean data ensures accurate insights.
2. Use Slicers Strategically
Apply slicers to focus on specific regions, categories, or months.
3. Review Trends, Not Just Numbers
Analyze month-over-month trends rather than single values.
4. Align KPIs with Business Goals
Ensure metrics align with sales, profitability, and customer satisfaction goals.
5. Train Teams on Interpretation
Teach users how to read charts and KPIs effectively.
Click to Purchases Home Décor Stores Dashboard in Excel
How Does This Dashboard Improve Business Performance?
The dashboard improves performance by:
-
Reducing reporting time
-
Increasing data visibility
-
Supporting proactive decision-making
-
Improving profitability and customer satisfaction
As a result, businesses gain a competitive edge.
Is Excel Still Relevant for Retail Dashboards?
Yes, Excel remains highly relevant because:
-
It offers flexibility and customization
-
It requires no additional software cost
-
It integrates easily with existing data sources
Therefore, Excel dashboards remain a practical choice for many retailers.
Conclusion
The Home Décor Stores Dashboard in Excel transforms raw retail data into meaningful, actionable insights. By combining sales, cost, customer satisfaction, and regional analysis into a single file, this dashboard eliminates reporting chaos and improves decision-making.
Moreover, its structured pages, interactive slicers, and clear visuals help home décor retailers track performance efficiently. When used correctly, this dashboard supports better planning, improved profitability, and enhanced customer experiences.
In a fast-moving retail environment, having clear insights makes all the difference—and this dashboard delivers exactly that.
Frequently Asked Questions (FAQs)
1. What is a Home Décor Stores Dashboard in Excel?
It is an interactive Excel-based reporting tool that analyzes sales, costs, profit, promotions, regions, and customer satisfaction for home décor stores.
2. Do I need advanced Excel skills to use this dashboard?
No. Basic Excel knowledge is enough to use filters, slicers, and charts.
3. Can I customize the dashboard?
Yes. You can add KPIs, charts, or pages based on business needs.
4. How often should I update the data?
You should update the data monthly or weekly for accurate insights.
5. Can this dashboard handle multiple stores?
Yes. You can include multiple store names in the Data Sheet and analyze them using slicers.
6. Is this dashboard suitable for small home décor businesses?
Absolutely. Small and mid-sized businesses benefit greatly from centralized reporting.
7. Does this dashboard support seasonal analysis?
Yes. The Month Analysis Page helps identify seasonal trends clearly.
Visit our YouTube channel to learn step-by-step video tutorials