In today’s rapidly evolving tech landscape, IT compliance is not just a box-ticking exercise—it’s a strategic necessity. Whether you’re overseeing cybersecurity, infrastructure, data protection, or support operations, having a solid understanding of your performance metrics is critical. That’s where an IT and Tech Compliance KPI Dashboard in Excel becomes your best friend.
This article walks you through everything you need to know about setting up, using, and optimizing this powerful Excel-based dashboard. With real-time visuals, automated data input, and easy navigation, this tool simplifies complex compliance tracking—without needing expensive software!
Click to Purchases IT and Tech Compliance KPI Dashboard in Excel
What is an IT and Tech Compliance KPI Dashboard?
An IT and Tech Compliance KPI Dashboard in Excel is a ready-to-use template designed to track, monitor, and visualize key compliance metrics in IT and technology services. It combines performance indicators such as data breach incidents, patch management rates, and incident response times—all in one interactive, user-friendly Excel file.
Rather than juggling between different systems, this dashboard centralizes your reporting and helps you ensure regulatory compliance, system reliability, and IT governance.
What’s Inside the Dashboard Template?
The Excel dashboard comes with 7 structured worksheets, each crafted for a specific function. Here’s what you get:
Home Sheet (Navigation Hub)
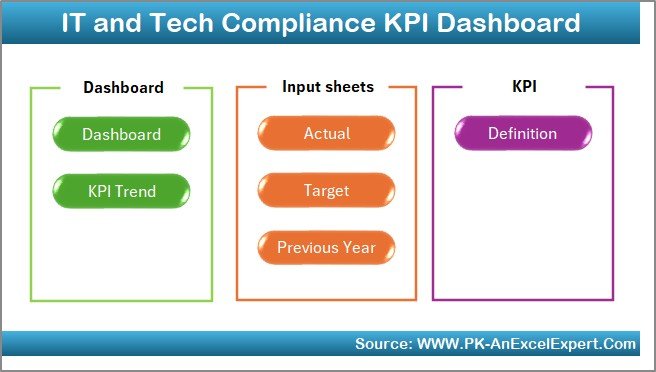
Think of this as the control room. The Home sheet acts as an index page where users can easily jump to the right section using buttons. This setup saves time and improves usability—especially for non-tech users.
Dashboard Sheet (The Main Visual Dashboard)
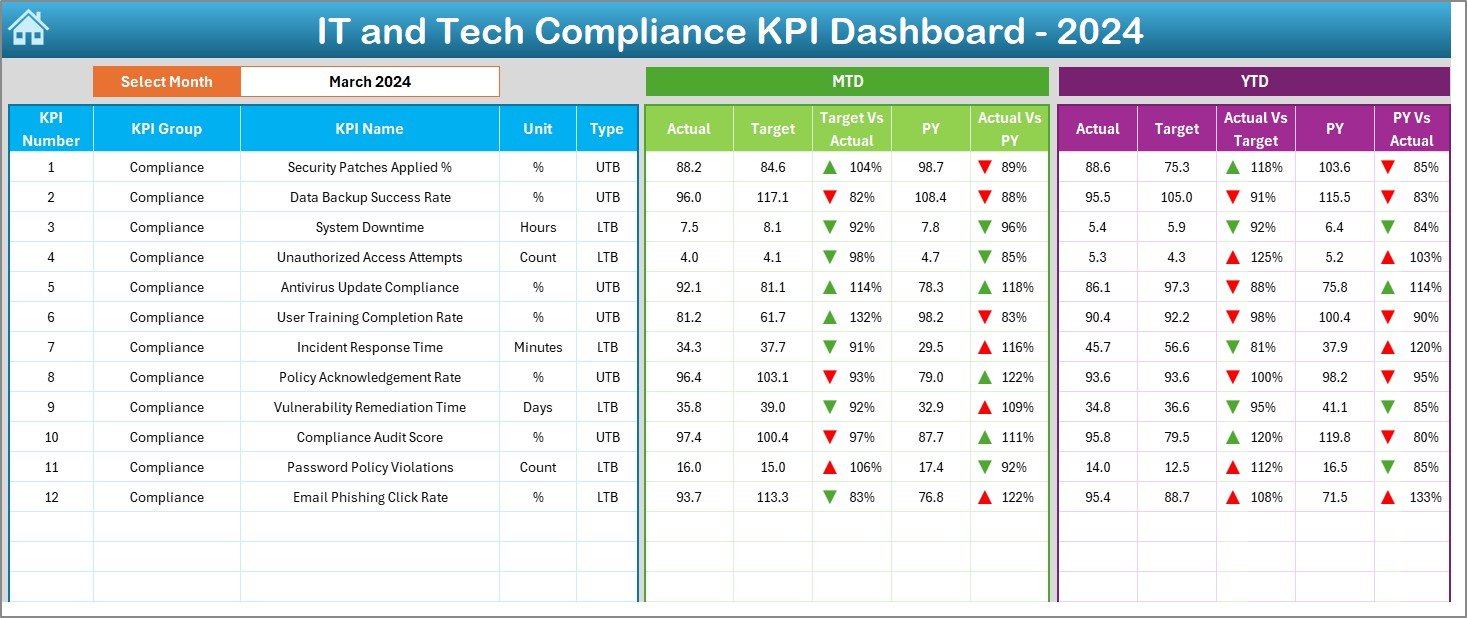
This is the heart of the dashboard.
-
Select a Month from the drop-down in cell D3.
-
Instantly view MTD (Month-to-Date) and YTD (Year-to-Date) data.
Each KPI displays:
- Actual vs Target
- Actual vs Previous Year
- Conditional formatting arrows to visualize growth or decline.
You no longer need to manually compare metrics—Excel handles the heavy lifting for you!
Click to Purchases IT and Tech Compliance KPI Dashboard in Excel
KPI Trend Sheet
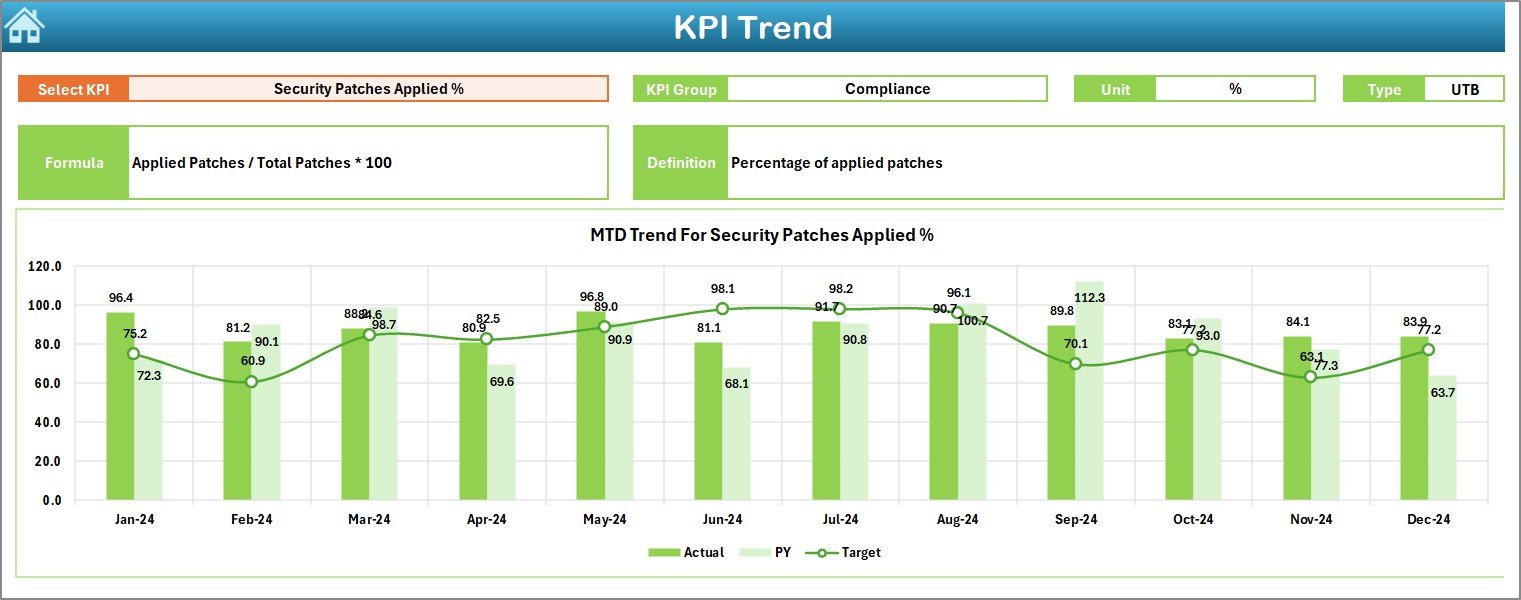
Need historical trends? This sheet is your go-to.
-
Choose a KPI from the dropdown in C3.
View line charts for:
- Actual
- Target
- Previous Year
See KPI details like:
- Unit
- Formula
- Type (LTB – Lower the Better, or UTB – Upper the Better)
It helps IT managers easily identify areas that need improvement and monitor performance patterns.
Actual Numbers Input Sheet
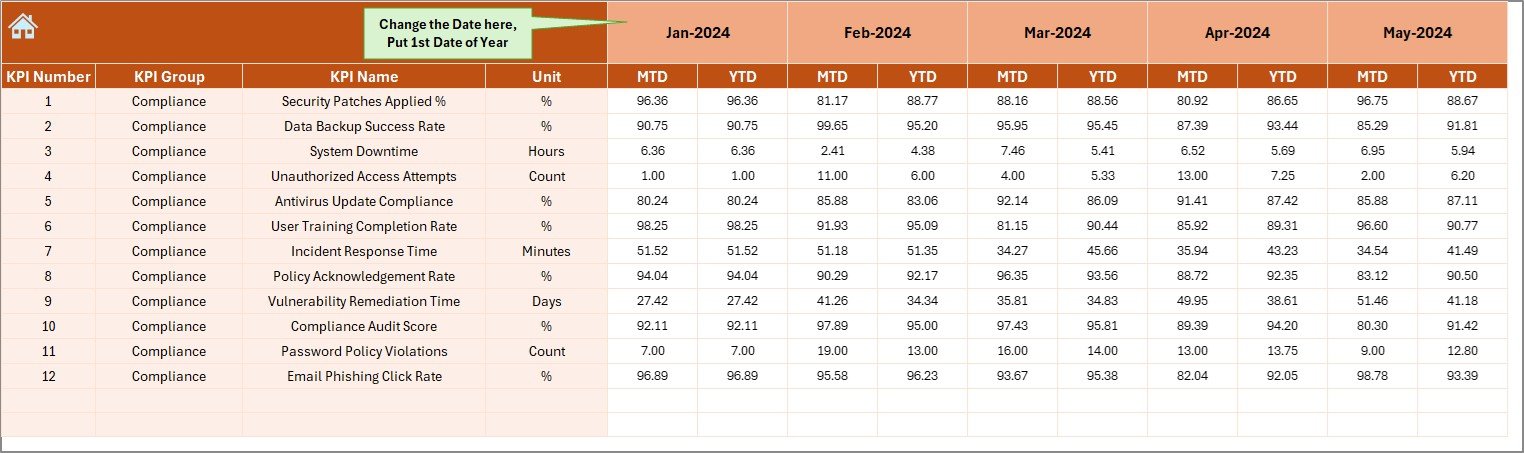
Enter MTD and YTD actual values here.
-
Just update the first month in E1, and the rest will auto-adjust.
-
This reduces human error and streamlines monthly reporting.
Target Sheet
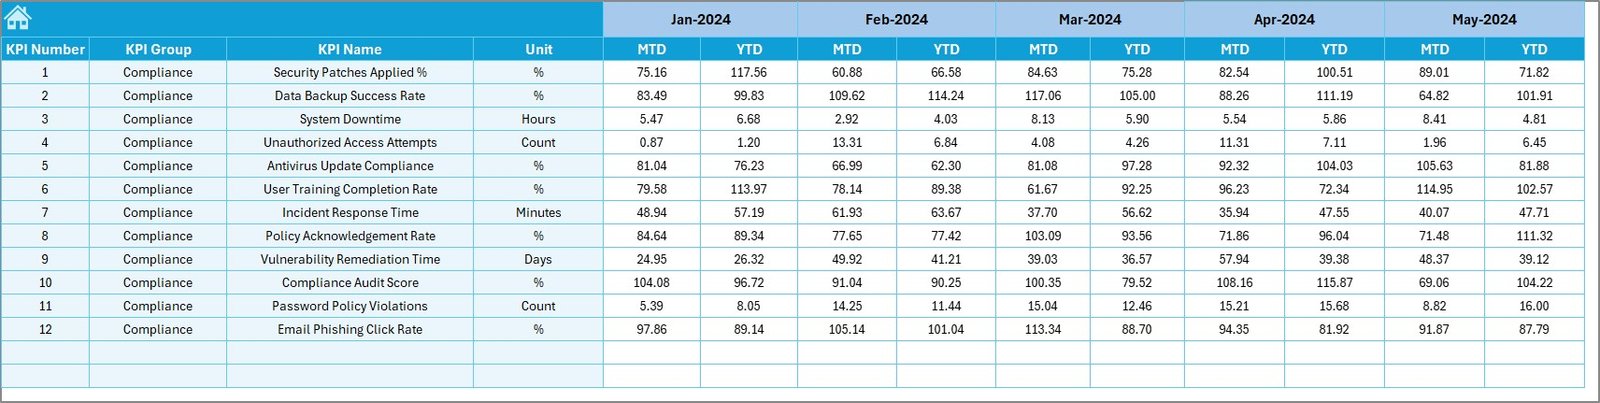
This sheet allows you to input monthly and yearly targets for each KPI.
-
Ensures every metric is benchmarked against a goal.
-
Keeps your team aligned with compliance objectives.
Previous Year Number Sheet
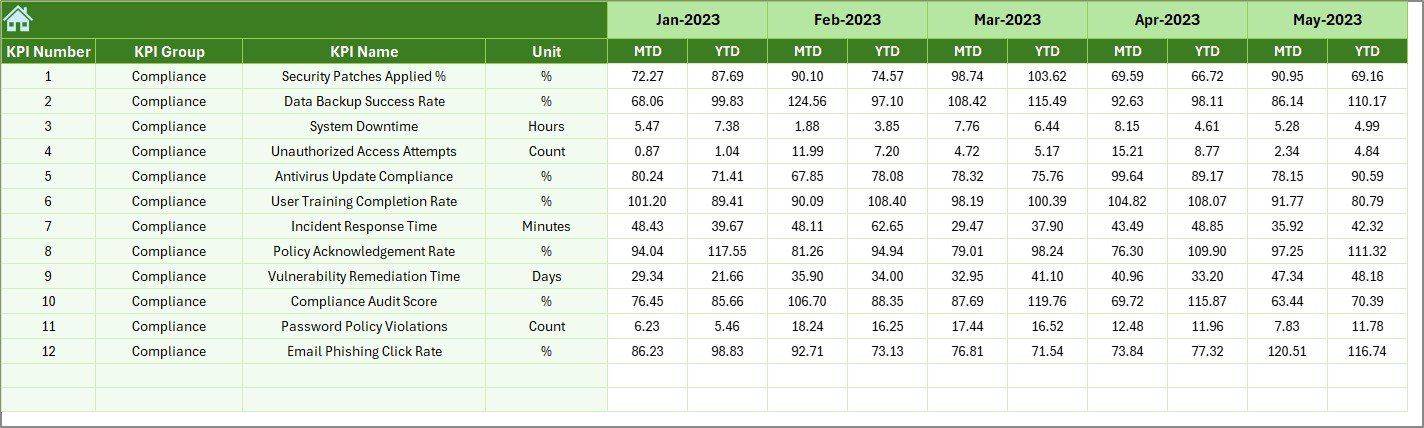
Want to compare last year’s numbers? Enter them here.
-
Historical comparison becomes a breeze.
-
Useful for audits, quarterly reviews, and board meetings.
KPI Definition Sheet
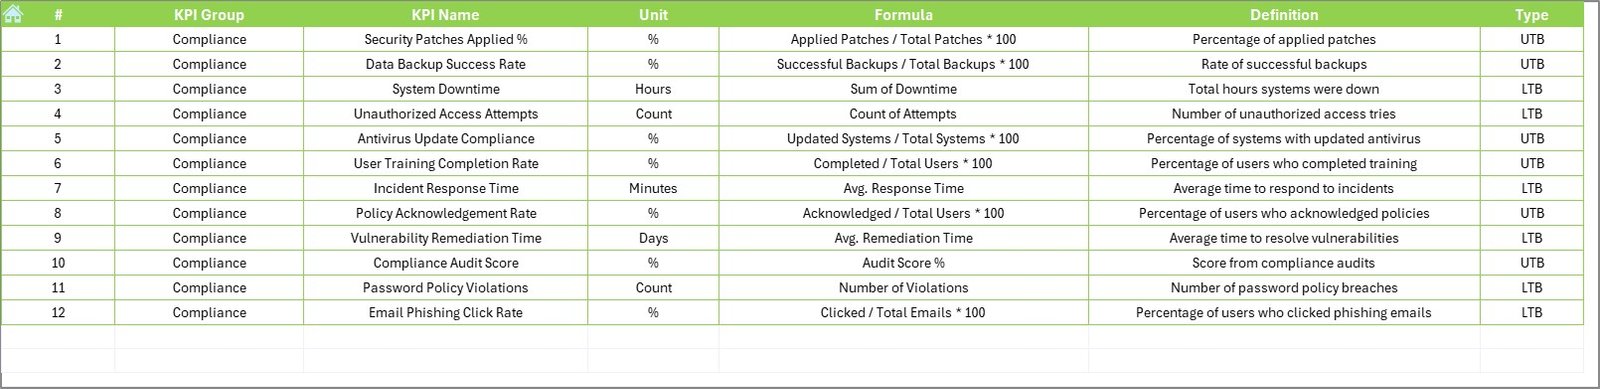
Every KPI needs context. This sheet documents:
-
KPI Group
-
KPI Name
-
Unit
-
Formula
-
Definition
It brings clarity to users and stakeholders alike.
Advantages of Using the IT and Tech Compliance KPI Dashboard
Click to Purchases IT and Tech Compliance KPI Dashboard in Excel
Let’s explore the many benefits of this tool:
✅ Centralized Reporting
View all your compliance KPIs in one place without switching tools.
✅ Easy to Customize
Add or remove KPIs, update formulas, or modify visuals to suit your organization’s goals.
✅ Time-Saving Automation
Drop-downs, conditional formatting, and formula-driven calculations make reporting fast and efficient.
✅ Visual Insights
Charts and arrows offer quick visual cues, helping stakeholders grasp performance at a glance.
✅ Cost-Effective
Why pay for expensive software when Excel does it all? No subscriptions, just powerful reporting.
Best Practices for the IT and Tech Compliance KPI Dashboard
Want to make the most out of your dashboard? Follow these expert-recommended tips:
1. Keep It Updated
Enter MTD, YTD, and target values each month without fail to maintain data accuracy.
2. Limit Manual Edits
Use data validation lists and formulas to prevent incorrect data entries.
3. Train Stakeholders
Walk your IT and compliance teams through the dashboard. A 10-minute training can save hours of confusion later.
4. Backup Your Data
Always maintain backup copies before making significant changes—especially when editing formulas or macros.
5. Review KPI Relevance Quarterly
Business needs evolve. Ensure your KPIs reflect current goals and compliance mandates.
Why Excel for IT KPI Tracking?
You might be wondering—why not use a dashboard software like Power BI or Tableau?
While those tools are powerful, Excel offers a few unique advantages:
-
No Learning Curve: Most employees already know Excel.
-
Portability: Easily share the file via email or cloud storage.
-
Offline Use: No internet? No problem. Excel works anywhere.
-
Customization: Every formula, chart, and layout can be personalized.
How to Interpret the Dashboard Insights?
Let’s break down a few real-world interpretations:
📉 If MTD for “System Downtime Events” spikes: This suggests an infrastructure issue or cyberattack. Investigate root causes immediately.
📈 If “Patch Compliance Rate” consistently exceeds targets: Your IT operations are proactive and effective.
⚠️ If “Recurring Incidents” remain unchanged: Your root cause analysis might be failing. Time to act!
Tips to Enhance Dashboard Usability
Even a great dashboard can fail if it’s hard to use. Here’s how you can make yours better:
-
Add color legends for UTB and LTB indicators.
-
Freeze top rows to keep column headings visible during scrolling.
-
Use slicers or drop-downs for filters.
-
Protect formula cells to avoid accidental changes.
Use Cases Across Departments
This dashboard is not limited to IT teams alone. It’s helpful for:
-
Compliance Officers: To monitor policy review and audit readiness.
-
IT Managers: To track infrastructure KPIs like downtime and uptime.
-
Support Teams: To measure first-response times and resolution rates.
-
Executives: For performance reports, investment planning, and governance reviews.
Customize the Dashboard to Your Needs
You can add more KPI categories such as:
-
Data Privacy Metrics
-
Vendor Risk Metrics
-
IT Budget Utilization
-
SLA Breach %
You can also create new charts in the KPI Trend tab for deep dives, or use pivot tables to slice data from different angles.
Conclusion
The IT and Tech Compliance KPI Dashboard in Excel is a game-changing solution for organizations aiming to streamline compliance, improve IT operations, and meet strategic goals. It’s simple, powerful, and entirely Excel-based—meaning you can get started right away without costly tools or lengthy onboarding.
Whether you’re in charge of security, support, or regulatory reporting, this dashboard empowers your decision-making with real-time data insights. With smart features like trend tracking, conditional formatting, and customizable KPIs, you’re always a step ahead in tech governance.
Frequently Asked Questions (FAQs)
Q1. How many KPIs can I track in this dashboard?
You can track as many as you want, but we recommend starting with 12 to keep it clean and manageable.
Q2. Can I add more KPI Groups or rename existing ones?
Absolutely. The dashboard is fully editable. You can rename KPI Groups, add new metrics, and even insert additional sheets if needed.
Q3. Is this dashboard password protected?
No. However, you can apply Excel’s protection features to lock formulas or restrict sheet editing as needed.
Q4. How do I update monthly data?
Go to the Actual Numbers Input Sheet, change the month in cell E1, and enter new MTD/YTD values.
Q5. Is this compatible with Excel Online?
Yes, but for full functionality like drop-downs and conditional formatting, desktop Excel is recommended.
Visit our YouTube channel to learn step-by-step video tutorials
Click to Purchases IT and Tech Compliance KPI Dashboard in Excel