Managing a shopping mall involves many moving parts. Mall managers must track revenue, operating costs, lease occupancy, events, maintenance, and customer satisfaction at the same time. However, when data stays scattered across multiple sheets or systems, decision-making becomes slow and unclear. That is exactly why a Mall Management Dashboard in Excel plays a critical role in modern mall operations.
In this detailed and SEO-friendly article, you will learn what a Mall Management Dashboard in Excel is, why it matters, how it works, its page-wise structure, key features, advantages, best practices, and common questions. Moreover, this article uses simple language, active voice, strong transitions, and practical explanations to ensure clarity and usability.
Click to Purchases Mall Management Dashboard in Excel
What Is a Mall Management Dashboard in Excel?
A Mall Management Dashboard in Excel is a ready-to-use and interactive Excel-based reporting tool designed to track, analyze, and visualize mall performance metrics in one place.
Instead of reviewing multiple spreadsheets for revenue, costs, leases, events, and satisfaction scores, this dashboard consolidates all key metrics into a single visual interface. As a result, mall managers can monitor performance quickly and take informed actions with confidence.
Moreover, because the dashboard works in Microsoft Excel, users do not need any advanced software or technical background. They can simply update data and view insights instantly.
Why Do Mall Managers Need a Dashboard in Excel?
Mall operations generate large volumes of data every day. For example, managers track store occupancy, operating expenses, event income, parking revenue, and customer feedback. However, without a structured system, this data remains underused.
A Mall Management Dashboard in Excel solves this problem effectively.
Key Reasons to Use a Mall Management Dashboard
-
It provides a single source of truth for mall performance.
-
It improves visibility across revenue, cost, and satisfaction metrics.
-
It supports faster and data-driven decisions.
-
It reduces manual reporting time and errors.
-
It helps managers identify trends, risks, and opportunities early.
Because of these reasons, many mall operators now rely on Excel dashboards for daily, monthly, and strategic reviews.
How Does a Mall Management Dashboard in Excel Work?
The working logic of a Mall Management Dashboard in Excel remains simple and user-friendly.
First, users enter or import data into a structured Data Sheet. Then, Excel formulas, pivot tables, and charts process this data. Finally, the dashboard displays results visually through cards, charts, and slicers.
Core Components of the Dashboard
-
Data Sheet: Stores raw data such as revenue, costs, footfall, and satisfaction ratings.
-
Support Sheet: Contains helper tables, mappings, and calculations.
-
Dashboard Pages: Display insights through visuals and KPI cards.
-
Slicers: Allow users to filter data by region, mall name, category, event type, or month.
Because Excel updates visuals automatically, users always see the latest insights after data refresh.
What Are the Key Features of the Mall Management Dashboard in Excel?
The Mall Management Dashboard in Excel includes several powerful features that improve usability and analysis.
Page Navigator for Easy Navigation
The dashboard includes a Page Navigator located on the left side. This feature allows users to move smoothly between different analytical pages without scrolling or confusion. As a result, navigation becomes quick and intuitive.
Interactive Slicers for Dynamic Analysis
Each dashboard page includes right-side slicers. These slicers allow users to filter data instantly by relevant dimensions such as region, store category, mall name, event type, and month. Therefore, users can drill down into specific insights easily.
Visual KPI Cards and Charts
The dashboard uses clear KPI cards and charts to highlight key performance indicators. Consequently, managers can understand complex data at a glance.
What Pages Are Included in the Mall Management Dashboard in Excel?
The dashboard contains five structured pages, each designed for a specific type of analysis.
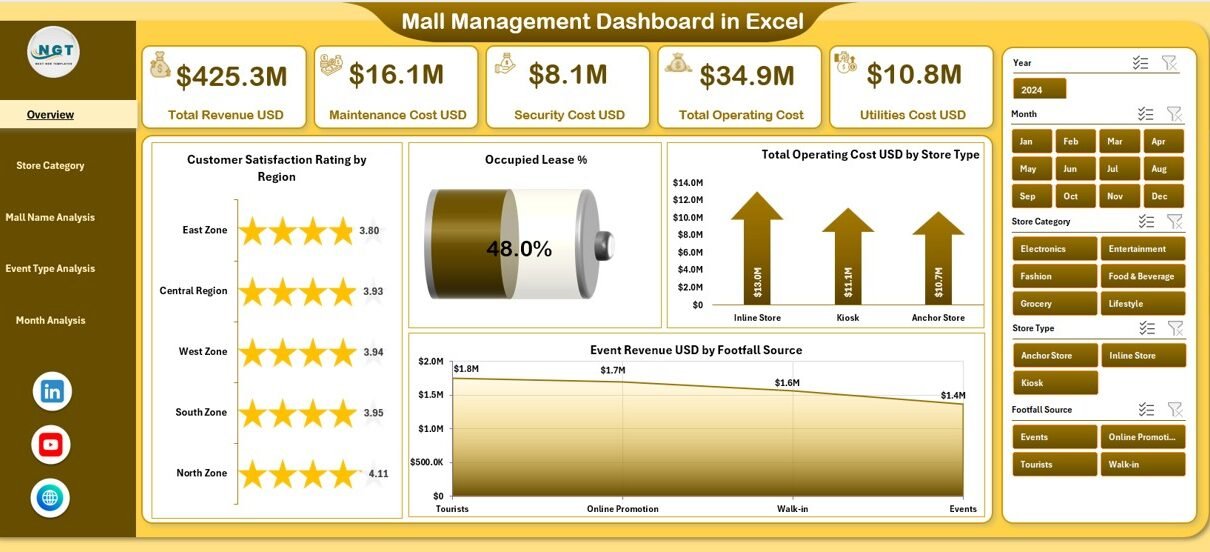
Overview Page: How Does the Executive Summary Help?
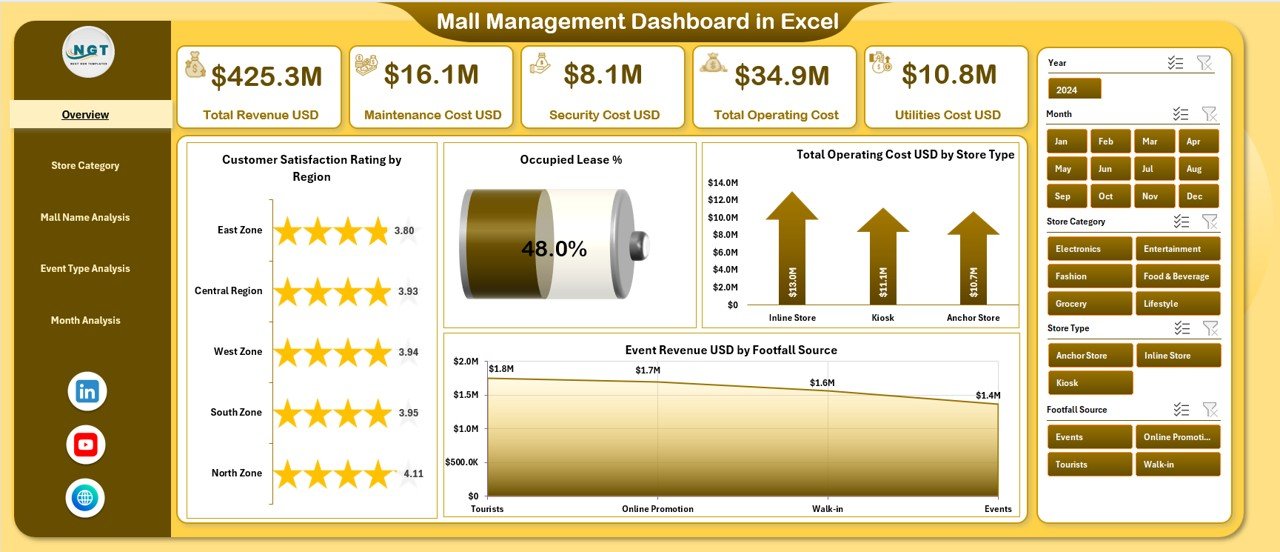
The Overview Page serves as the main landing page of the dashboard. It provides a high-level snapshot of overall mall performance.
Key Elements of the Overview Page
-
Right-Side Slicers for quick filtering
-
Four KPI Cards for instant performance tracking
-
Four Analytical Charts for summarized insights
Charts on the Overview Page
-
Customer Satisfaction Rating by Region
-
Occupied Lease %
-
Total Operating Cost USD by Store Type
-
Event Revenue USD by Footfall Source
Because of this layout, decision-makers can quickly assess mall health and identify areas that need attention.
Store Category Analysis Page: How Do Store Types Perform?
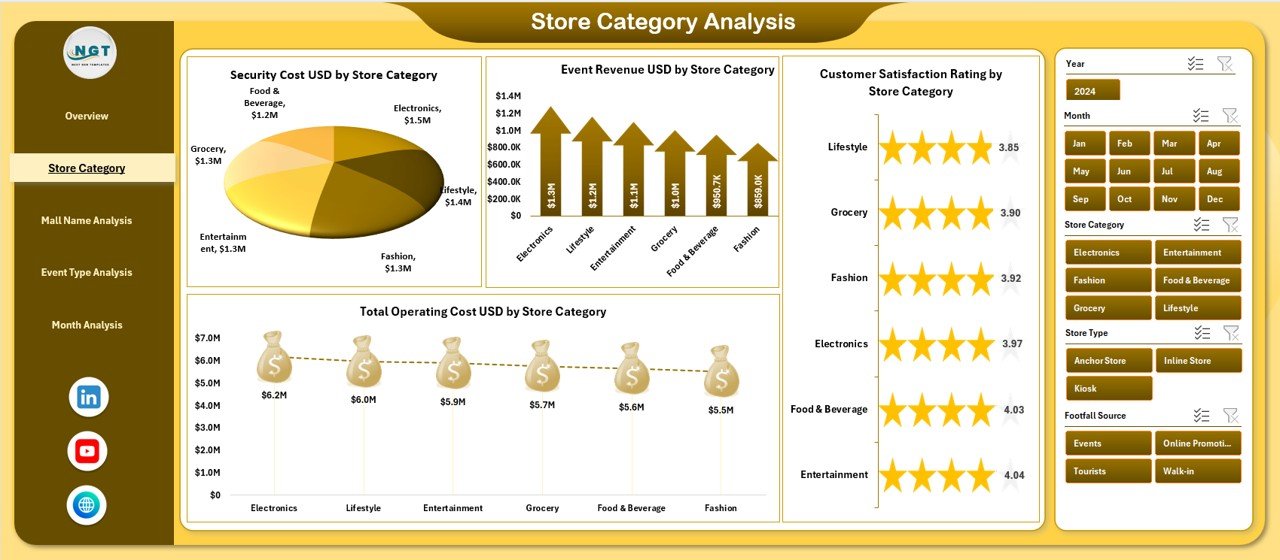
The Store Category Analysis Page focuses on performance by store category. This page helps mall managers understand which types of stores generate higher revenue and satisfaction.
Key Charts on This Page
-
Customer Satisfaction Rating by Store Category
-
Event Revenue USD by Store Category
-
Security Cost USD by Store Category
-
Total Operating Cost USD by Store Category
As a result, managers can compare performance across categories such as fashion, food, entertainment, and electronics.
Mall Name Analysis Page: How Do Individual Malls Compare?
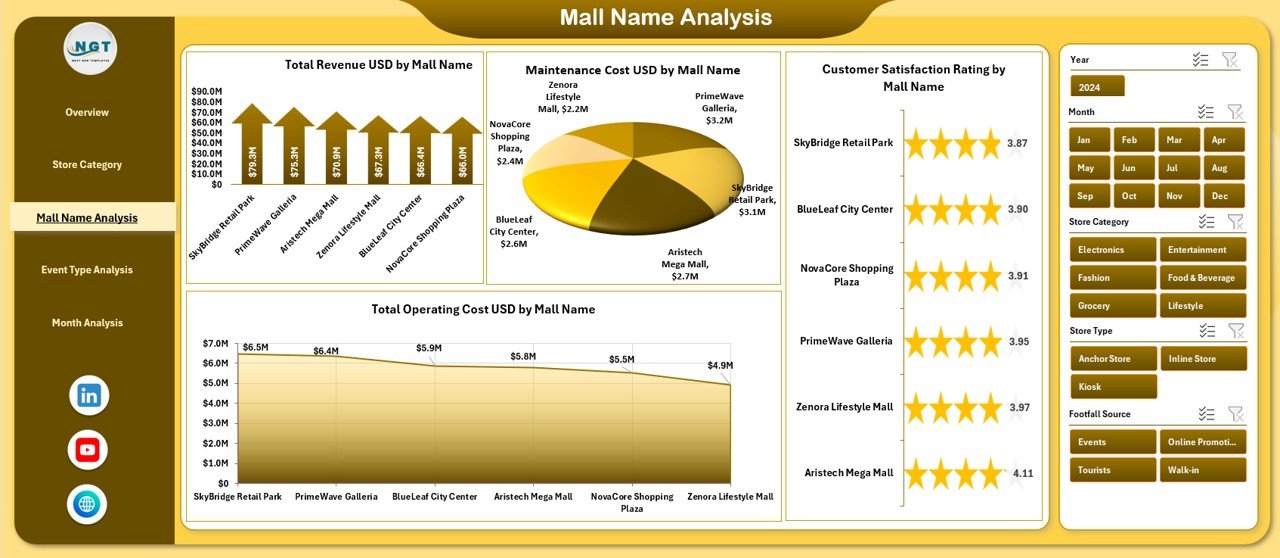
For organizations managing multiple malls, this page becomes extremely valuable.
Purpose of the Mall Name Analysis Page
This page compares performance across different mall locations. Therefore, managers can identify top-performing and underperforming malls.
Charts Included
-
Customer Satisfaction Rating by Mall Name
-
Total Revenue USD by Mall Name
-
Maintenance Cost USD by Mall Name
-
Total Operating Cost USD by Mall Name
Because of these insights, leadership teams can allocate budgets and resources more effectively.
Event Type Analysis Page: Which Events Drive Revenue?
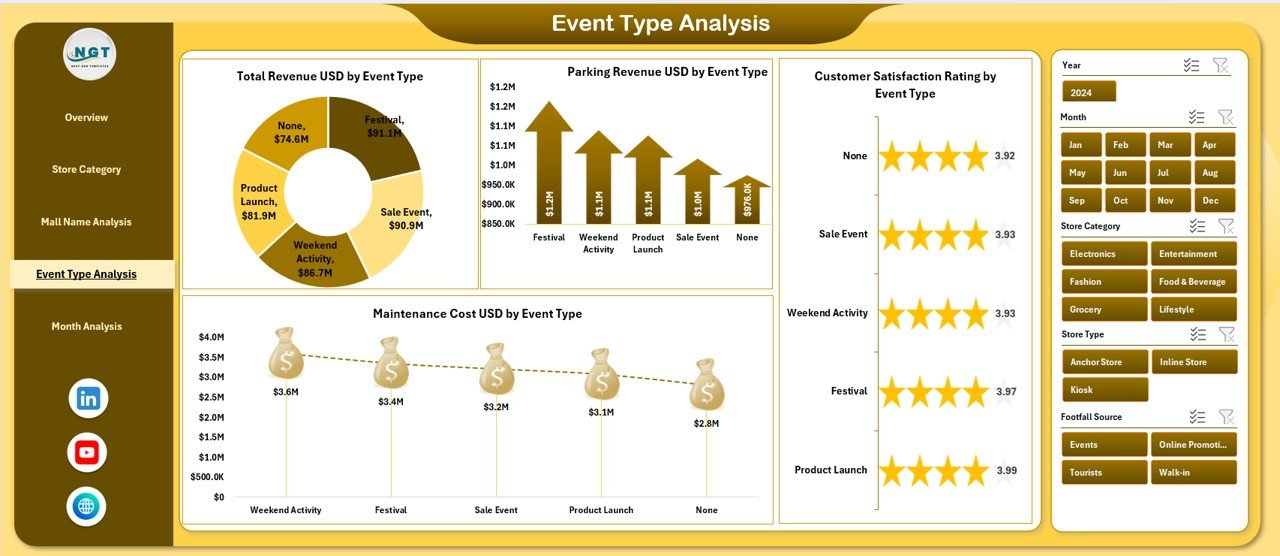
Events play a major role in increasing footfall and revenue. The Event Type Analysis Page evaluates how different events perform.
Charts on the Event Type Analysis Page
-
Customer Satisfaction Rating by Event Type
-
Total Revenue USD by Event Type
-
Parking Revenue USD by Event Type
-
Maintenance Cost USD by Event Type
As a result, mall managers can focus on high-impact events and optimize event planning strategies.
Month Analysis Page: How Does Performance Change Over Time?
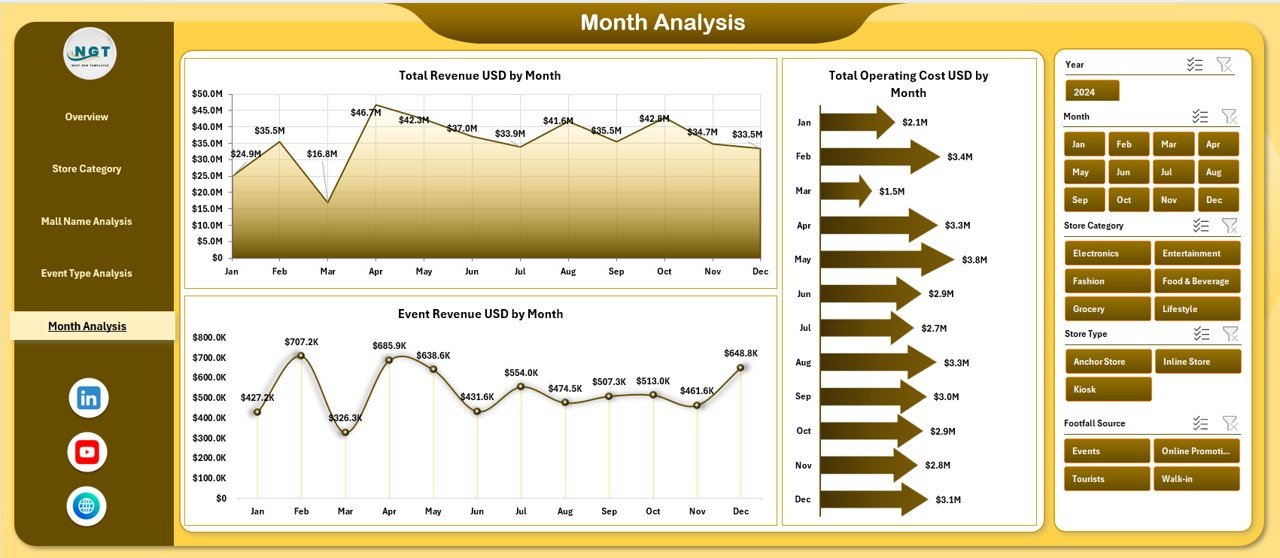
Trends matter in mall management. Therefore, the Month Analysis Page focuses on time-based performance.
Charts Included on This Page
-
Total Revenue USD by Month
-
Total Operating Cost USD by Month
-
Event Revenue USD by Month
Because of this page, managers can identify seasonal trends, peak months, and cost fluctuations.
What Is the Role of the Data and Support Sheets?
Behind every dashboard lies structured data.
Data Sheet
The Data Sheet stores all transactional and operational data, including:
-
Revenue figures
-
Operating costs
-
Lease occupancy
-
Event details
-
Customer satisfaction scores
Support Sheet
The Support Sheet contains:
-
Lookup tables
-
Category mappings
-
Calculations
-
Helper formulas
Together, these sheets ensure accurate and consistent reporting.
Advantages of Mall Management Dashboard in Excel
Click to Purchases Mall Management Dashboard in Excel
Using a Mall Management Dashboard in Excel offers multiple advantages for mall operators and management teams.
Key Advantages
-
📊 Centralized Performance Tracking
-
⏱️ Time-Saving Reporting
-
📈 Clear Visual Insights
-
🔄 Flexible and Customizable
-
💰 Cost-Effective Solution
-
🧩 Easy Integration with Existing Data
-
📌 Improved Decision-Making
Because Excel remains widely used, adoption becomes fast and smooth.
Who Can Benefit from a Mall Management Dashboard in Excel?
Many stakeholders benefit from this dashboard.
Key Users
-
Mall Managers
-
Operations Teams
-
Finance Teams
-
Leasing Teams
-
Event Coordinators
-
Senior Management
Each user group can view insights relevant to their role.
Best Practices for the Mall Management Dashboard in Excel
To get maximum value from the dashboard, users should follow proven best practices.
Keep Data Clean and Updated
Always update data regularly. Clean data ensures accurate insights and reliable decisions.
Use Standard Naming and Categories
Maintain consistent naming for malls, store categories, and event types. This practice avoids confusion during analysis.
Review KPIs Regularly
Schedule weekly or monthly dashboard reviews. Regular reviews help teams stay proactive.
Avoid Overloading the Dashboard
Focus only on key metrics. Too many charts reduce clarity and impact.
Train Users Properly
Provide basic Excel training to dashboard users. Even simple guidance improves adoption and effectiveness.
How Does a Mall Management Dashboard Improve Decision-Making?
A Mall Management Dashboard in Excel improves decision-making by turning raw data into actionable insights.
-
It highlights cost overruns early
-
It identifies high-performing malls and events
-
It reveals customer satisfaction trends
-
It supports strategic planning and budgeting
As a result, decisions become faster, smarter, and more confident.
How Can You Customize the Mall Management Dashboard in Excel?
Click to Purchases Mall Management Dashboard in Excel
Excel dashboards offer high flexibility.
Common Customization Options
-
Add new KPIs
-
Modify charts
-
Change slicer dimensions
-
Add new analysis pages
-
Adjust color themes and branding
Because of Excel’s flexibility, each organization can tailor the dashboard to its needs.
Conclusion: Why Should You Use a Mall Management Dashboard in Excel?
A Mall Management Dashboard in Excel provides a powerful, simple, and cost-effective way to manage mall operations. It consolidates revenue, costs, leases, events, and satisfaction data into one interactive system. Moreover, it improves visibility, reduces manual effort, and supports smarter decisions.
If you want better control, transparency, and performance across your mall operations, this dashboard becomes an essential tool.
Frequently Asked Questions (FAQs)
What is a Mall Management Dashboard in Excel used for?
A Mall Management Dashboard in Excel tracks and visualizes mall performance metrics such as revenue, operating costs, lease occupancy, events, and customer satisfaction.
Do I need advanced Excel skills to use this dashboard?
No, you only need basic Excel knowledge. The dashboard uses simple slicers, charts, and structured sheets.
Can I use this dashboard for multiple malls?
Yes, the Mall Name Analysis page supports performance comparison across multiple malls.
How often should I update the data?
You should update data daily, weekly, or monthly based on your reporting needs.
Can I customize the dashboard?
Yes, Excel allows full customization, including adding KPIs, charts, and branding.
Is this dashboard suitable for small malls?
Yes, both small and large malls can benefit from this dashboard because of its flexible structure.
Visit our YouTube channel to learn step-by-step video tutorials