In the fast-paced world of digital marketing, staying on top of your campaigns is not just beneficial—it’s essential. From tracking ad performance to measuring conversions, having a centralized dashboard can change how you manage and optimize your campaigns. This is where the Marketing Campaign Dashboard in Excel comes into play. In this article, we will explore everything you need to know about this powerful tool: what it is, why you need it, how it works, and how to make the most out of it.
Click to Purchases Marketing Campaign Dashboard in Excel
What is a Marketing Campaign Dashboard in Excel?
A Marketing Campaign Dashboard in Excel is a visual and analytical tool that helps marketers track the performance of their campaigns across various dimensions such as channels, campaign types, regions, and time. Built entirely in Excel, this ready-to-use template provides insightful metrics using slicers, dynamic charts, and data-driven visuals—all without needing any third-party software.
Key Features of the Marketing Campaign Dashboard
Here are the standout features that make this Excel dashboard exceptionally useful:
Page Navigator
Easily jump between pages using the top-page navigator. It simplifies access to detailed reports with just one click.
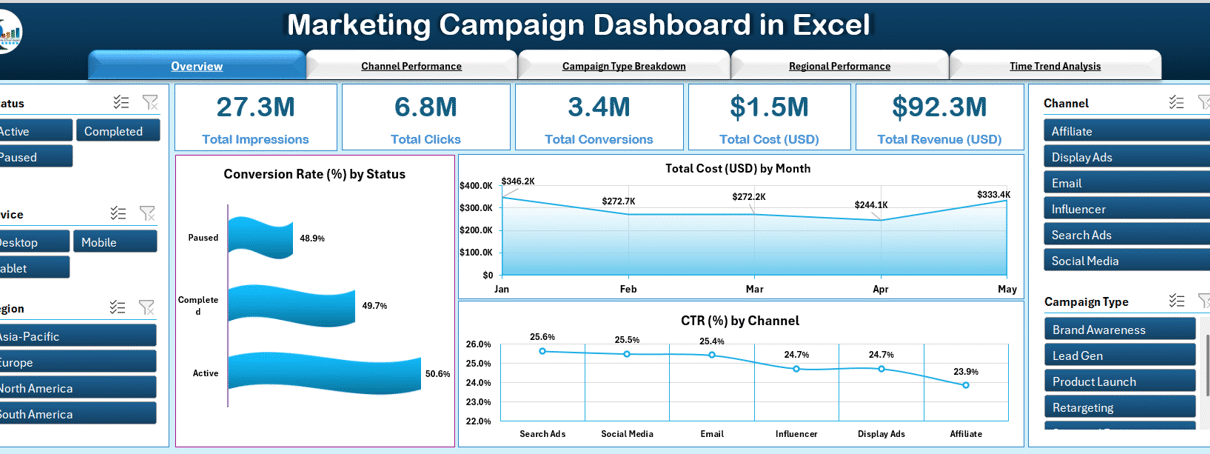
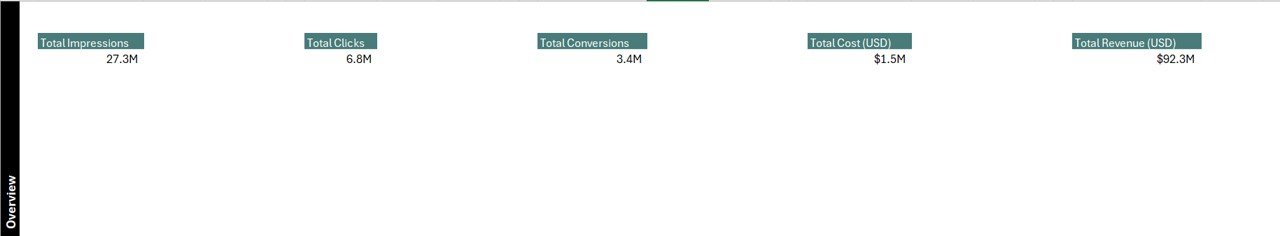
Overview Page
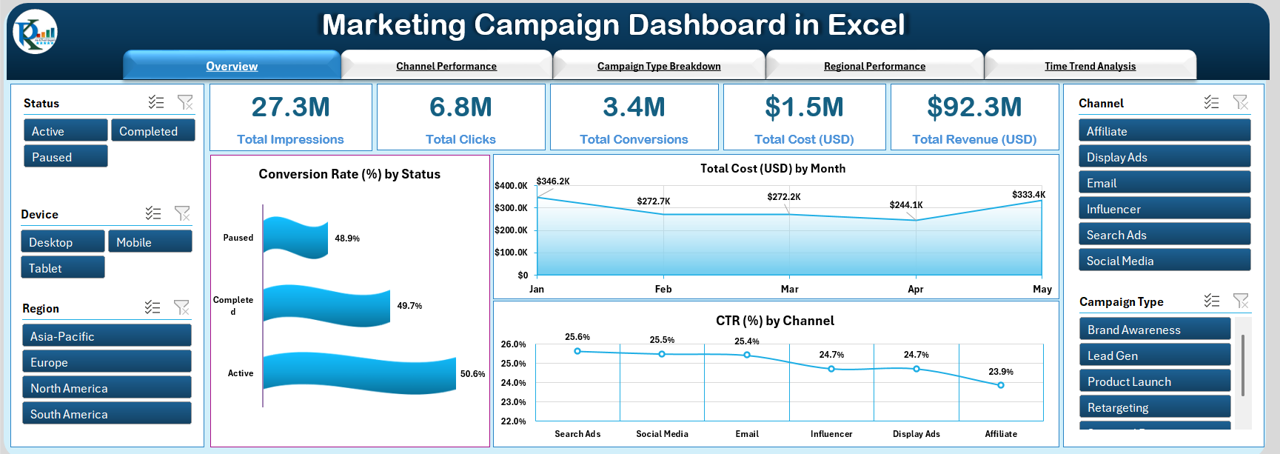
- Slicers on both sides for quick filtering by dimensions like campaign type, region, and more
- Cards displaying metrics such as Total Impressions, Clicks, Conversions, Cost, and Revenue
Charts included:
- Campaign Rate (%) by Status
- Total Cost (USD) by Month
- CTR (%) by Channel
Channel Performance Page
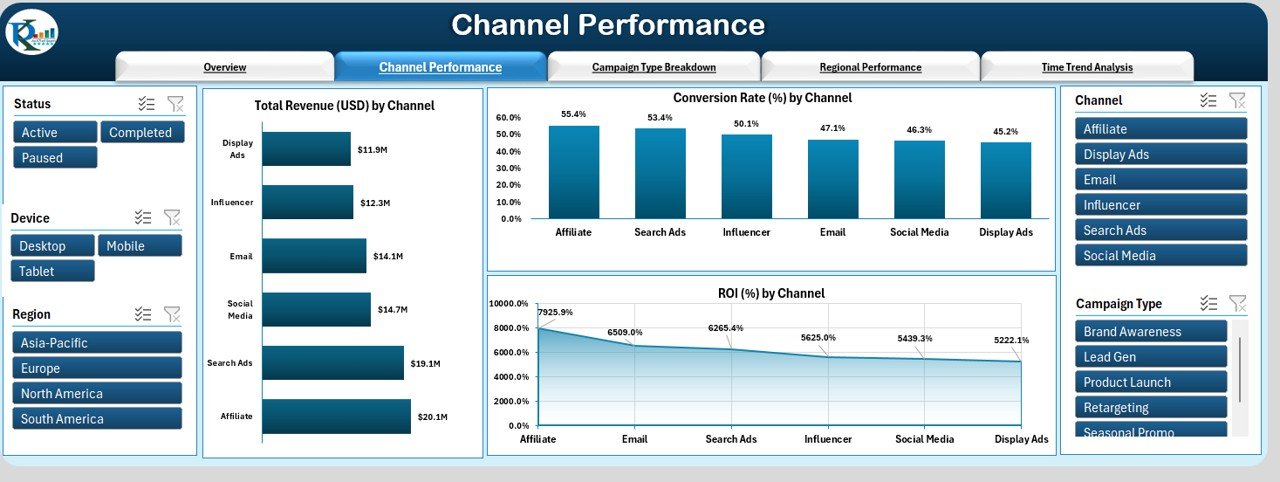
- Focus on channel-specific performance
- Cards for KPIs like Impressions, Clicks, Conversions, Cost, and Revenue
Charts included:
- Total Revenue (USD) by Channel
- Conversion Rate (%) by Channel
- ROI (%) by Channel
Campaign Type Breakdown Page
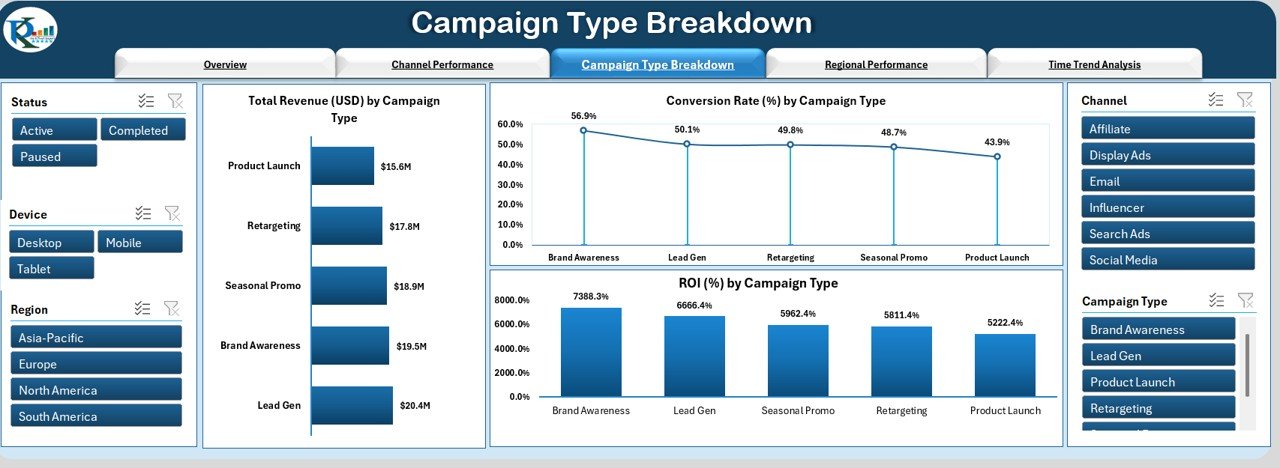
- Visualize data based on campaign types
Charts included:
- Total Revenue (USD) by Campaign
- Conversion Rate (%) by Campaign Type
- ROI (%) by Campaign Type
Regional Performance Page
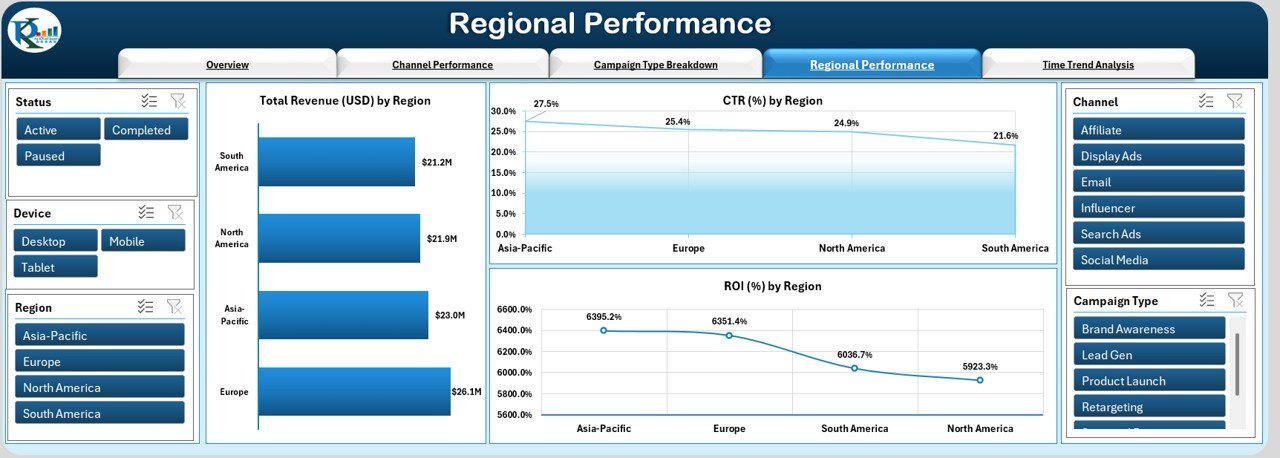
- Region-wise analysis for better targeting
Charts included:
- Total Revenue (USD) by Region
- CTR (%) by Region
- ROI (%) by Region
Time Trend Analysis Page
Click to Purchases Marketing Campaign Dashboard in Excel
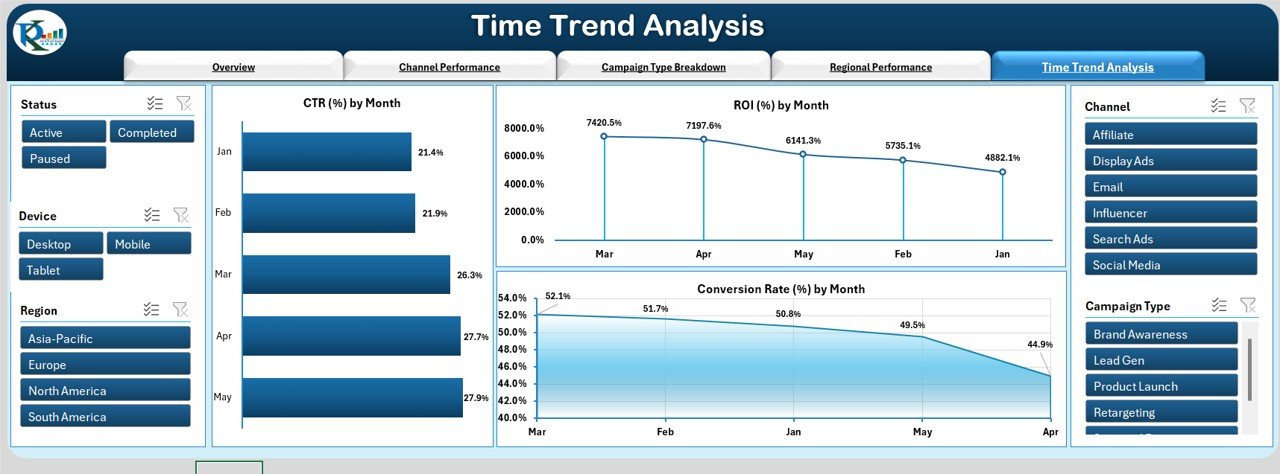
- Month-wise trends for performance monitoring
Charts included:
- CTR (%) by Month
- ROI (%) by Month
- Conversion Rate (%) by Month
Why Use a Marketing Campaign Dashboard?
There are plenty of good reasons to adopt this dashboard:
✅ Centralized Campaign View: Monitor all your campaigns in one place
🔄 Dynamic Filtering: Slice and dice the data using slicers and dropdowns
⚡ Instant Visual Feedback: Real-time charts and KPIs update instantly with filters
💸 Budget Efficiency: Track ROI and cost metrics clearly
⏳ Time Analysis: Spot trends by month to adjust campaigns accordingly
Components of the Dashboard
Data Sheet
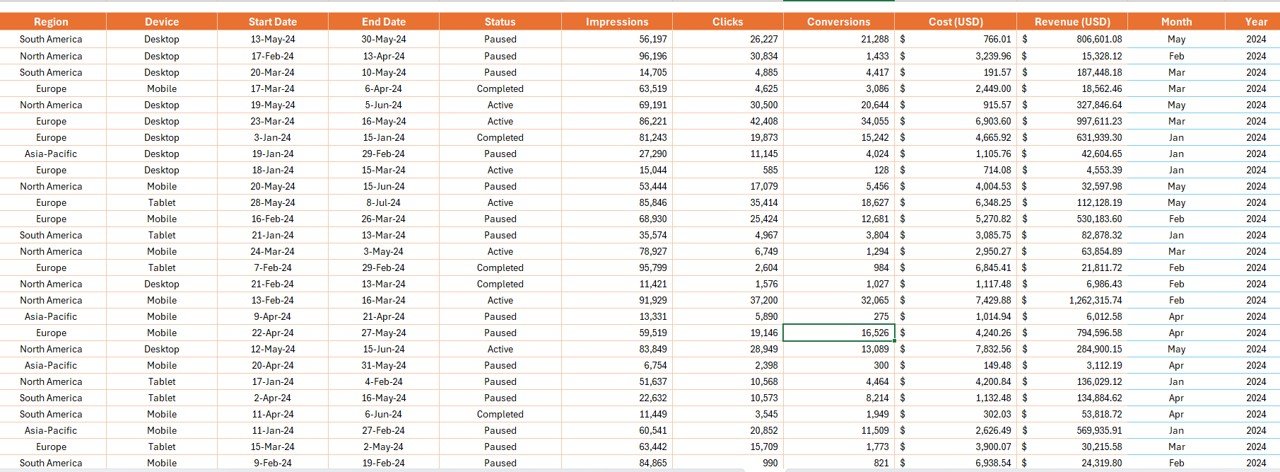
This is where all the raw data is stored. It includes:
- Campaign ID, Name, Channel
- Campaign Type, Region, Device
- Start Date, End Date, Status
- Impressions, Clicks, Conversions
- Cost (USD), Revenue (USD), Month, Year
Support Sheet
This sheet helps with drop-downs, unique values, and slicer sources to ensure data integrity and smooth filtering.
Click to Purchases Marketing Campaign Dashboard in Excel
Advantages of Marketing Campaign Dashboard in Excel
📈 Improves Decision-Making
You can make faster, data-driven decisions by having key metrics in front of you.
🪝 Saves Time
You don’t need to switch between multiple tools. Everything is in Excel.
✂️ Fully Customizable
You can adjust the visuals and data fields as per your team’s needs.
🏦 Works Offline
No need for internet access or paid platforms. Everything works in Excel.
Best Practices for Using the Dashboard
🌐 Keep Your Data Clean
Always ensure that the data you enter is accurate and well-formatted.
📆 Update Data Monthly
To maintain relevance, update the raw data monthly or weekly depending on campaign cycles.
🧪 Use Slicers Strategically
Apply multiple slicers to explore hidden patterns and correlations.
🤝 Collaborate with Teams
Share the dashboard with stakeholders to align goals and strategies.
✏️ Customize KPIs
Modify the card values and charts based on what matters most to your campaigns.
How to Get Started
📁 Download the Excel Template
🔍 Review all worksheet tabs
📊 Input or paste your campaign data into the Data Sheet
🔄 Watch charts and KPIs automatically update
📊 Apply slicers to drill into specific campaign insights
Conclusion
The Marketing Campaign Dashboard in Excel is your all-in-one solution to track, analyze, and improve your marketing campaigns. It blends simplicity with power, allowing marketers to focus on strategy rather than struggling with fragmented data. If you want to elevate your campaign reporting and make smarter decisions, this dashboard is a must-have tool in your arsenal.
Frequently Asked Questions (FAQs)
1. Can I use this dashboard without any technical skills?
Yes, it is built in Excel with user-friendly slicers and charts. No coding or formulas are required.
2. Is the dashboard compatible with Excel Online?
While it works best in the Excel desktop app due to slicers and advanced charts, some functionality may also work in Excel Online.
3. Can I add my own KPIs to the dashboard?
Absolutely! You can modify the KPI cards and charts based on your campaign goals and metrics.
4. How often should I update the data?
It’s best to update the dashboard either weekly or monthly depending on the frequency of your campaigns.
5. Will this dashboard work for both B2B and B2C campaigns?
Yes, the structure is flexible enough to support any kind of marketing campaign—B2B or B2C.
6. Can I track performance by campaign owner or team?
Yes, you can add additional fields like “Campaign Owner” in the data sheet and build slicers accordingly.
Click to Purchases Marketing Campaign Dashboard in Excel
Visit our YouTube channel to learn step-by-step video tutorials