In today’s technology-driven world, cybersecurity is no longer a luxury—it’s a necessity. Organizations face constant threats from cyberattacks, data breaches, and security loopholes. So, how do you track your cybersecurity performance effectively? The answer lies in a powerful, easy-to-use tool: the IT and Tech Cybersecurity KPI Dashboard in Excel.
This article will guide you through everything you need to know about this dashboard. From its core features to best practices, advantages, and frequently asked questions, we’ll break it down in the simplest terms possible.
Click to Purchases IT and Tech Cybersecurity KPI Dashboard in Excel
What is an IT and Tech Cybersecurity KPI Dashboard in Excel?
An IT and Tech Cybersecurity KPI Dashboard is an Excel-based template that helps IT teams monitor key cybersecurity metrics in real-time. It includes various visualizations, monthly and yearly comparisons, and conditional formatting to help you track progress, spot anomalies, and make informed decisions.
With multiple sheets integrated into a single file, this dashboard ensures you never miss a beat when it comes to tracking your organization’s cybersecurity posture.
Key Features of the Cybersecurity KPI Dashboard
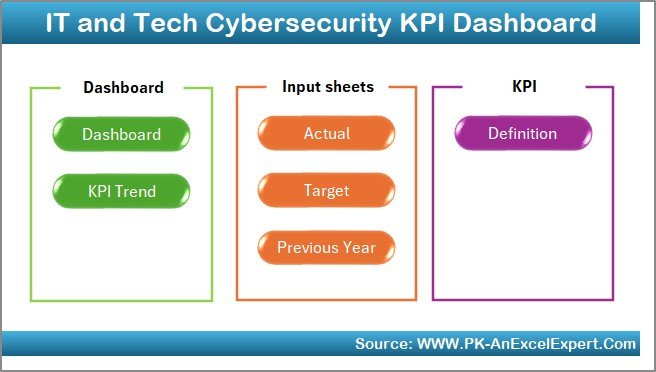
This ready-to-use Excel dashboard comes with seven fully functional worksheets. Each tab plays a critical role in giving you a complete picture of your cybersecurity metrics.
Home Sheet
- Acts as the main menu
- Includes 6 navigation buttons that allow you to jump to other sheets instantly
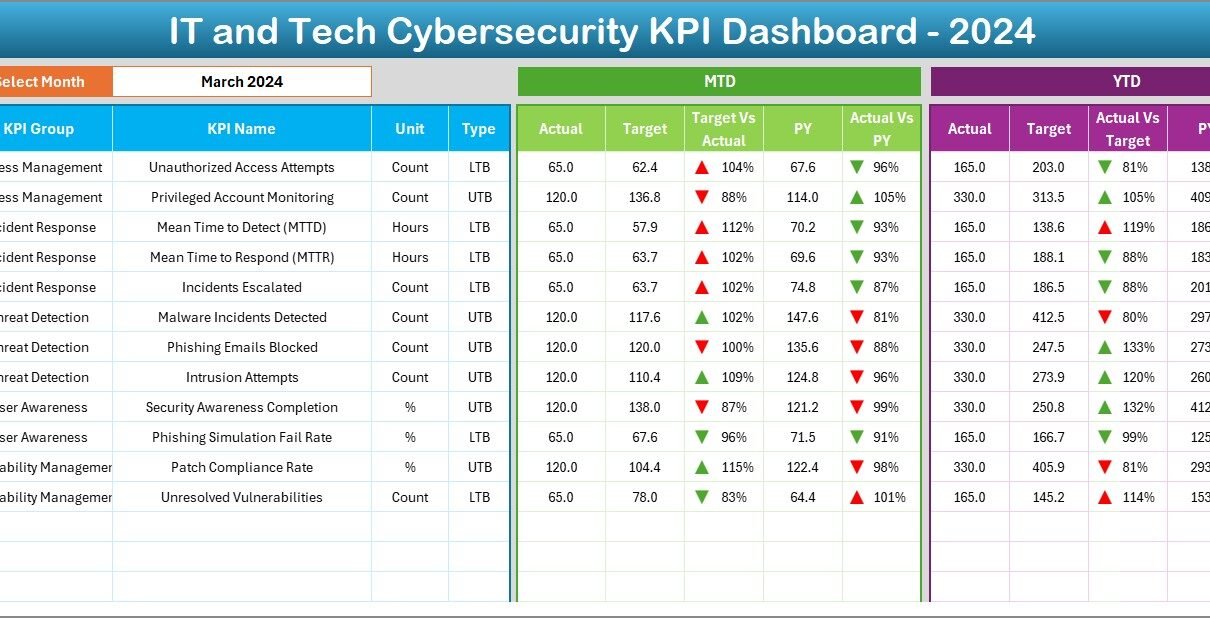
Dashboard Sheet Tab
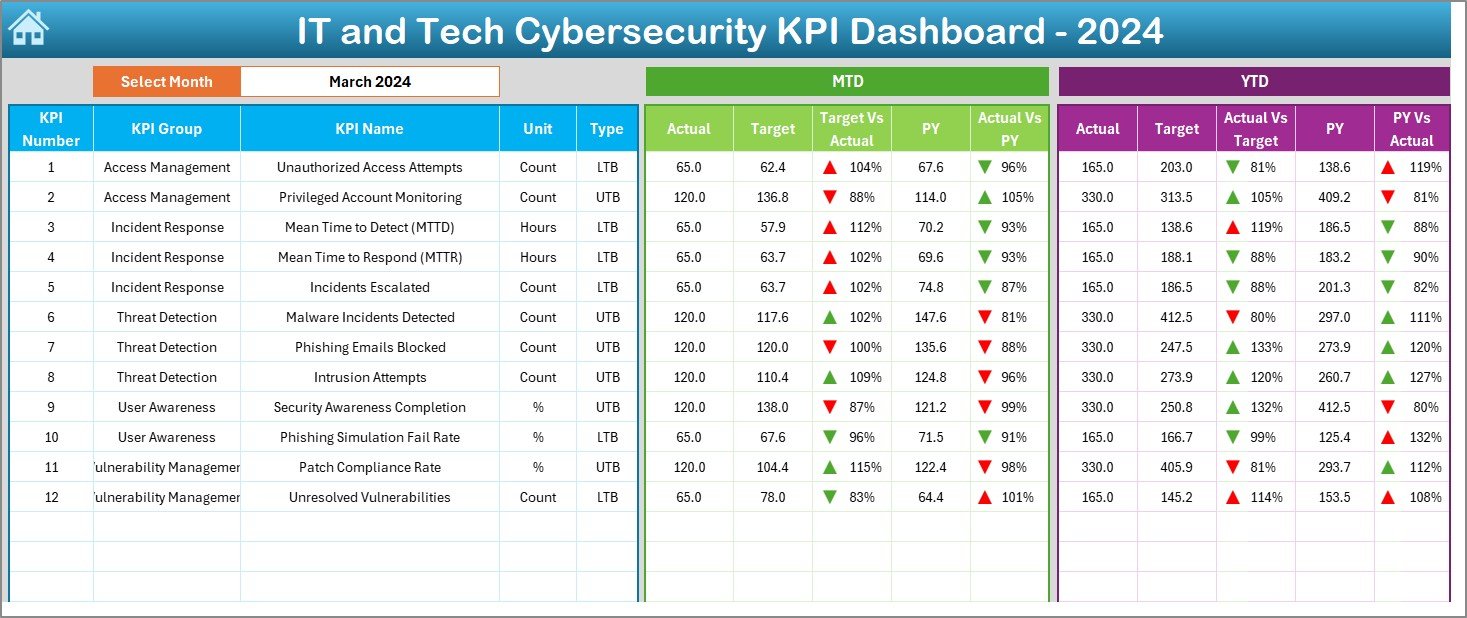
- The core of the dashboard
- Drop-down menu at cell D3 to select a month
Displays:
- MTD (Month to Date) Actual, Target, and Previous Year data
- YTD (Year to Date) Actual, Target, and Previous Year data
- Target vs Actual and Previous Year vs Actual comparisons with up/down arrows
Click to Purchases IT and Tech Cybersecurity KPI Dashboard in Excel
KPI Trend Sheet Tab
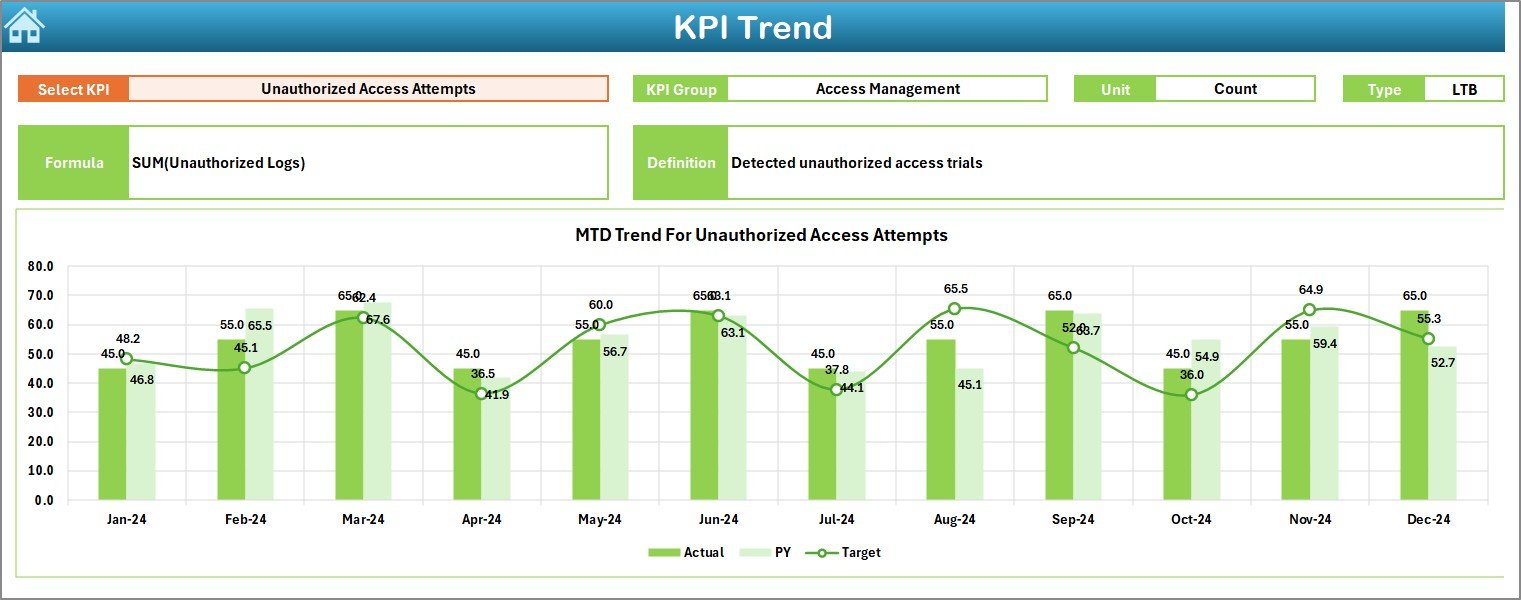
- Choose a KPI from the drop-down in cell C3
Displays:
- KPI Group, Unit, Type (UTB/LTB), Formula, and Definition
- Trend charts for MTD and YTD
Actual Numbers Input Sheet
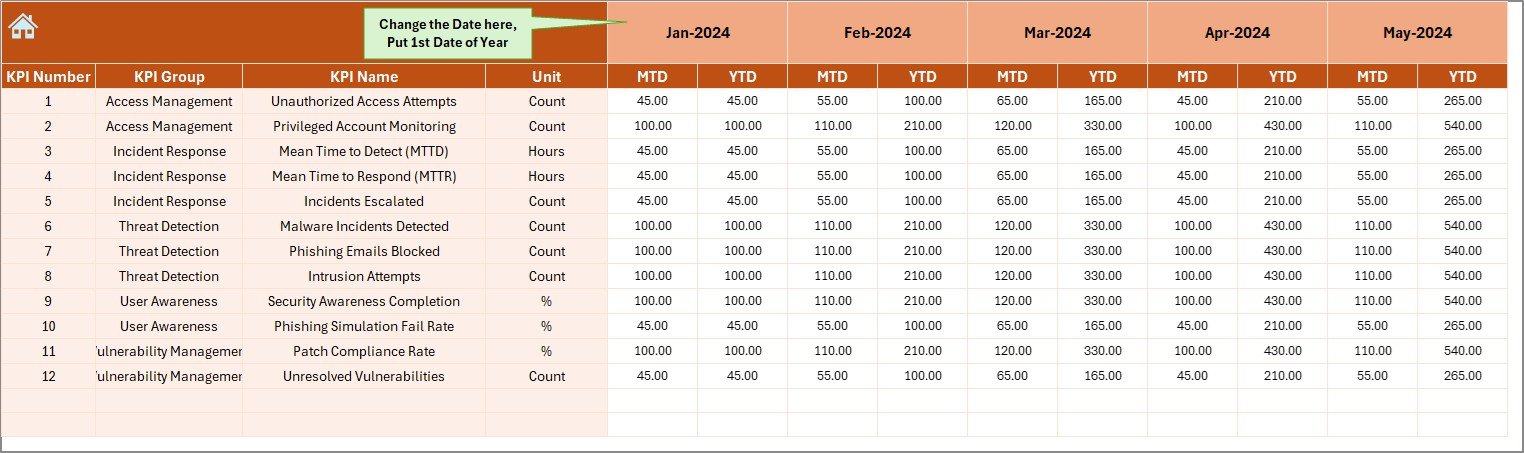
- Enter the actual KPI numbers for each month
- Set the starting month for the year in cell E1
Target Sheet Tab
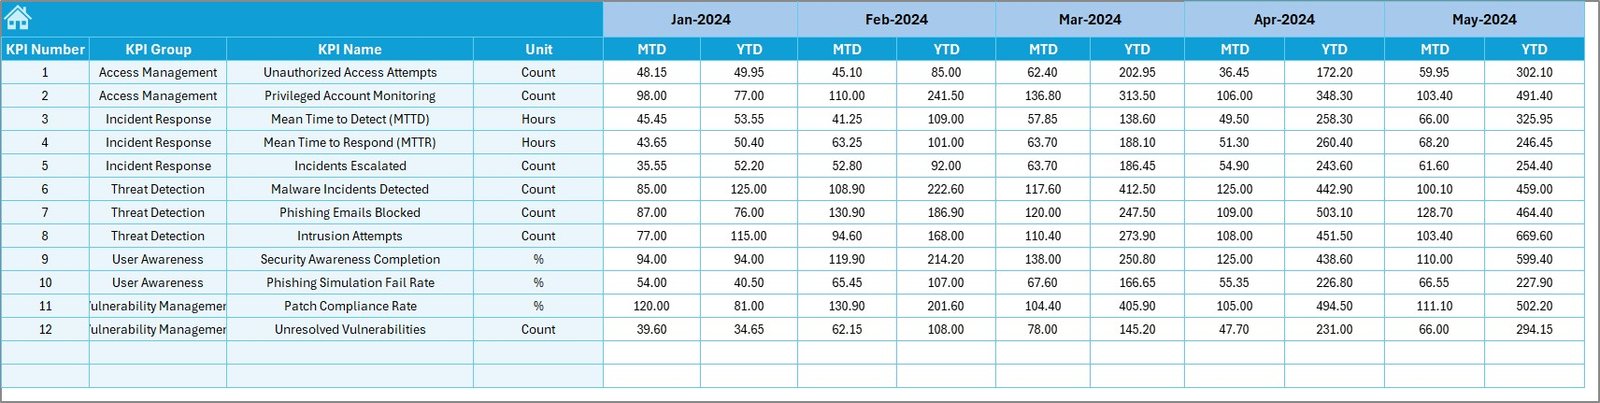
- Record monthly and yearly target values for each KPI
Previous Year Numbers Sheet Tab
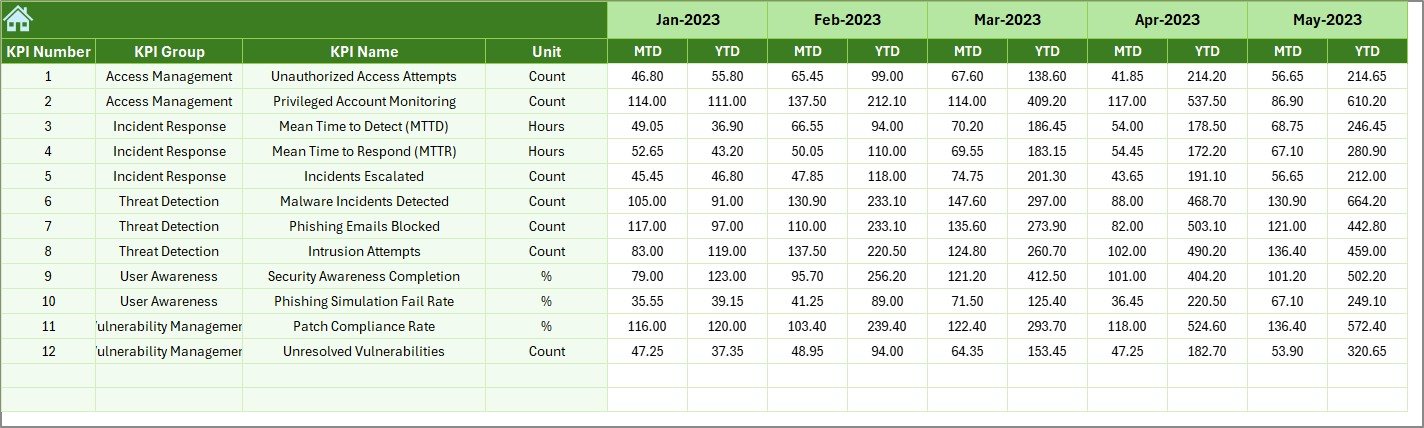
- Log the previous year’s values for each KPI to enable comparison
KPI Definition Sheet Tab
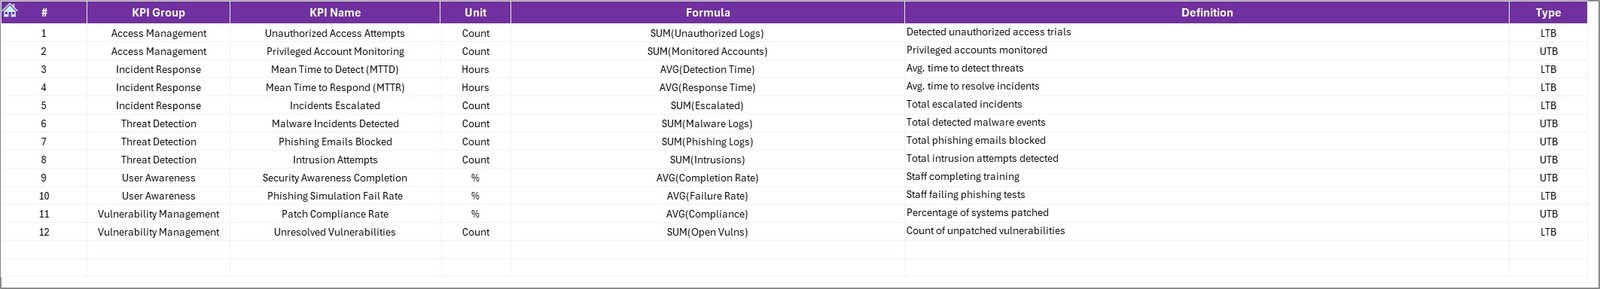
Contains metadata such as:
- KPI Name
- Group
- Unit
- Formula
- Definition
Why Should You Use a Cybersecurity KPI Dashboard?
Click to Purchases IT and Tech Cybersecurity KPI Dashboard in Excel
Let’s explore the advantages of using this Excel-based tool.
🌐 Centralized Monitoring
All your cybersecurity KPIs are available in one place, ensuring you get an overview without toggling between tools.
⏳ Real-Time Decision Making
Conditional formatting and drop-down selections help you instantly assess your current performance.
🔬 Data-Driven Insights
Visual charts and metrics support better decision-making based on real performance, not guesswork.
📊 Historical Comparisons
Compare this year’s performance with the previous year to evaluate improvement or identify problem areas.
Important Cybersecurity KPIs to Track
Here are some examples of KPIs you can track using the dashboard:
- Number of Intrusion Attempts
- Incident Response Time
- Number of Patches Applied
- User Access Control Violations
- Firewall Effectiveness
- System Downtime due to Attacks
- Data Recovery Time
- Compliance Violations
Each KPI includes units, aggregation formulas, and definitions, making the dashboard intuitive to use.
How to Use the Cybersecurity Dashboard Effectively
Step-by-Step Instructions:
Go to the Actual Numbers Input Sheet
Input monthly and YTD values
Fill in the Target Sheet Tab
Set your desired monthly and yearly goals
Add Previous Year Data
Use the Previous Year Numbers sheet
Navigate to the Dashboard Tab
Select a month from the drop-down
Instantly view insights and performance metrics
Use KPI Trend Tab for Deeper Insights
Select any KPI to see its detailed trend and info
Best Practices for Using a Cybersecurity KPI Dashboard
Here are some tried-and-true best practices:
✅ Keep Data Updated
Update actuals, targets, and previous year values monthly. Set reminders if needed.
✅ Review Trends Monthly
Use the KPI Trend sheet to analyze changes and take timely action.
✅ Define Clear Thresholds
Clearly identify what counts as good or bad performance. Use arrows and color codes for better visibility.
✅ Involve the Right Stakeholders
Share the dashboard with department heads, auditors, and security teams regularly.
✅ Customize for Your Needs
Modify KPI definitions, add new KPIs, or adjust targets as your organization evolves.
Advantages of a Cybersecurity KPI Dashboard in Excel
Let’s take a closer look at the benefits you’ll enjoy:
🔧 Customizable and Scalable
Easily add new KPIs or update sheets to match growing business requirements.
📅 Monthly and Yearly Comparisons
Track how you’re doing month over month and year over year.
📊 Visual Insights
Conditional formatting and charts help interpret complex data quickly.
🛠️ No Technical Expertise Required
Built in Excel, which most professionals already use and understand.
🚀 Faster Response to Threats
Catch and fix issues early by spotting downward trends or missed targets.
Conclusion
Cyber threats are increasing every day. But with the IT and Tech Cybersecurity KPI Dashboard in Excel, you can stay ahead of the curve. It’s simple, powerful, and efficient—everything a modern cybersecurity team needs.
By using this dashboard regularly, you’ll gain insights that can guide strategy, improve security posture, and ensure compliance.
Don’t let cyber risks catch you off guard. Start tracking your KPIs today!
Frequently Asked Questions (FAQs)
❓ What is the purpose of a Cybersecurity KPI Dashboard?
It helps you monitor the effectiveness of your security policies and practices using visual metrics.
❓ Can I customize the dashboard for my own KPIs?
Yes, the template is fully editable. You can add, delete, or modify KPIs based on your needs.
❓ Do I need Excel expertise to use this?
No. Basic Excel knowledge is enough. Everything is built using user-friendly formulas and drop-downs.
❓ How often should I update the dashboard?
Ideally, you should update it once a month for best results.
❓ Can I use this dashboard for audit or compliance checks?
Absolutely. It can serve as a report for internal reviews, audits, and compliance tracking.
❓ Is this dashboard suitable for small IT teams?
Yes, it works well for both small teams and large organizations.
❓ What if I want to add more KPIs later?
No problem! Simply go to the KPI Definition sheet and add new entries. Update the relevant sheets accordingly.
Click to Purchases IT and Tech Cybersecurity KPI Dashboard in Excel
Visit our YouTube channel to learn step-by-step video tutorials
Watch the step-by-step video tutorial: