In today’s fast-paced digital world, marketing teams must make quick and data-driven decisions. Whether you run paid ads, email marketing, or multi-channel campaigns, knowing what’s working (and what’s not) is crucial. That’s where the Marketing Campaign Dashboard in Power BI steps in—a visual, dynamic, and intelligent way to track every angle of your marketing strategy.
From cost efficiency to campaign type performance, regional breakdowns to monthly trend analysis, this dashboard is a one-stop solution for marketing professionals who want clear, actionable insights without drowning in spreadsheets.
In this article, we’ll walk through everything you need to know about this powerful tool—its features, benefits, best practices, and frequently asked questions.
Click to Purchases Marketing Campaign Dashboard in Power BI
What Is the Marketing Campaign Dashboard in Power BI?
The Marketing Campaign Dashboard in Power BI is a pre-built, interactive business intelligence tool that pulls marketing data from Excel and presents it in a visual and organized manner. Instead of manually creating reports, this dashboard updates automatically with new data and provides marketing teams with up-to-date performance metrics.
You can track campaign costs, conversions, impressions, and revenues across different channels, regions, and campaign types—all in one place. The dashboard uses filters (called slicers in Power BI) that let you view segmented insights within seconds.
Key Components of the Dashboard
The dashboard comes with 5 powerful pages—each focusing on a specific dimension of marketing analysis. Let’s break them down:
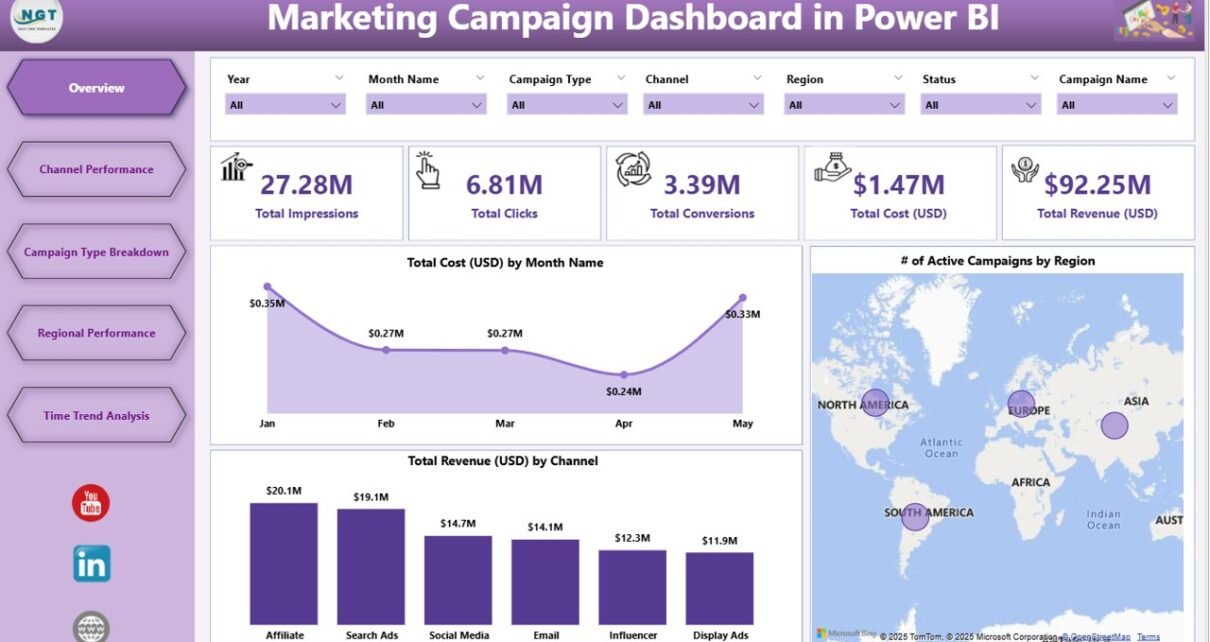
Overview Page

The Overview Page acts as the main control center. It gives a quick, high-level summary of campaign activities.
✅ Slicers (7 total): Allow filtering by month, region, campaign type, and more.
🧮 Cards: Display key metrics such as Total Cost, Total Revenue, Number of Campaigns.
📈 Charts:
Total Cost (USD) by Month
- # of Active Campaigns by Region
- Total Revenue (USD) by Channel
This page helps stakeholders get a bird’s-eye view of marketing health.
Channel Performance Page
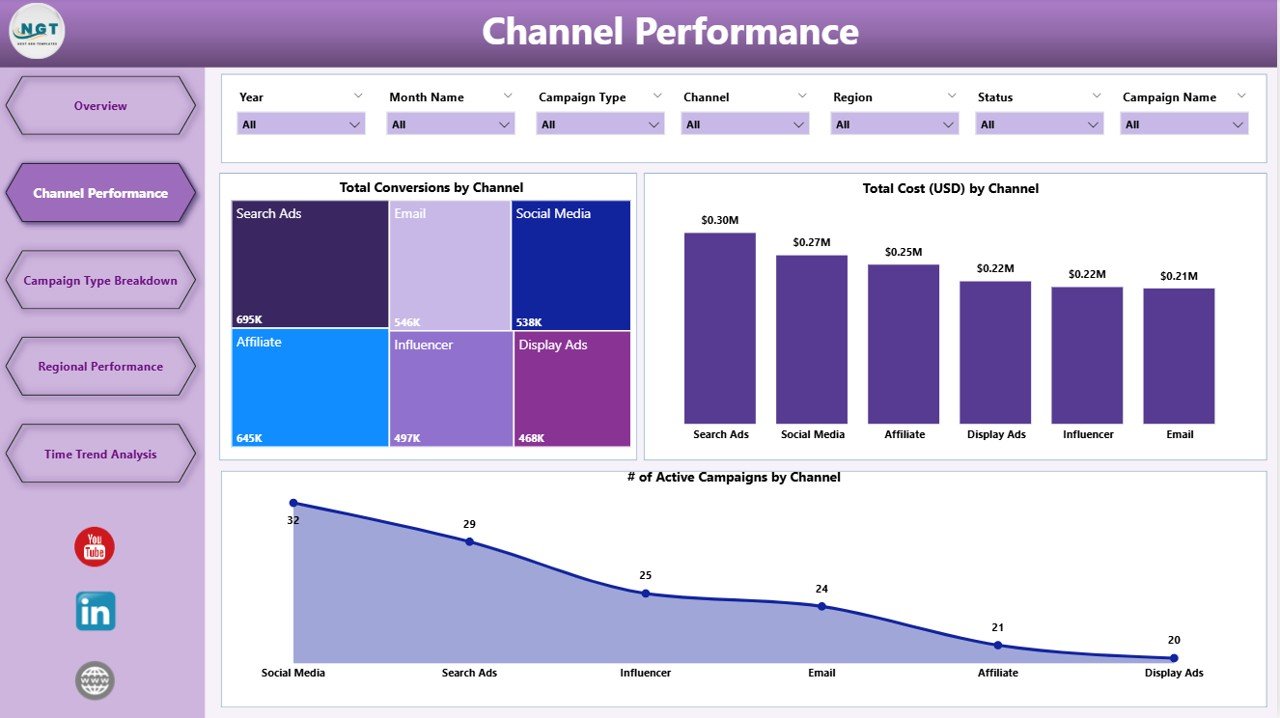
This page dives deep into how each marketing channel (e.g., Email, Social Media, Search Ads) performs.
-
✅ Slicers: Same as the Overview page for consistency.
📊 Charts:
- Total Conversions by Channel
- Total Cost by Channel
- # of Active Campaigns by Channel
Marketers can instantly identify which channels deliver the most conversions and the best ROI.
Campaign Type Breakdown Page

Want to know whether video, banner, email, or influencer campaigns are working best? This page has you covered.
-
✅ Slicers: Again, allowing granular filtering.
📊 Charts:
- Total Revenue by Campaign Type
- Total Impressions by Campaign Type
- Total Conversions by Campaign Type
This helps teams allocate budgets more strategically based on performance trends.
Regional Performance Page
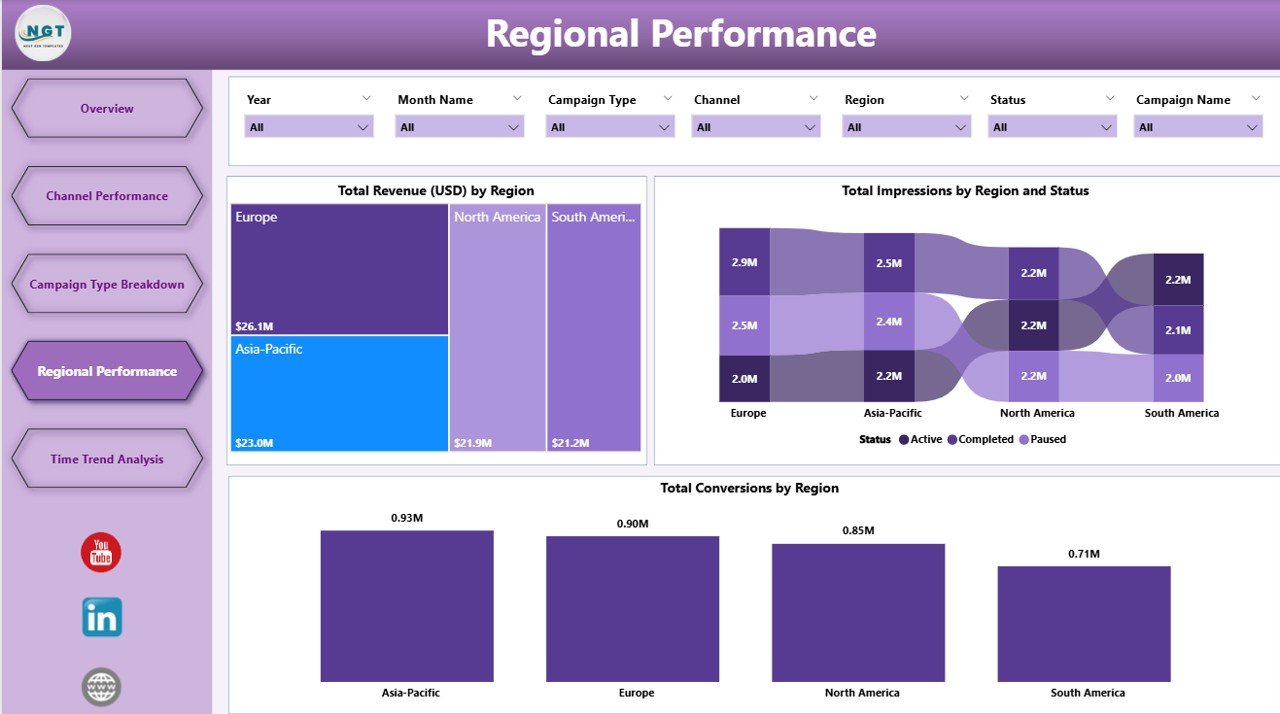
Marketing isn’t one-size-fits-all. This page reveals how your campaigns are performing across different geographies.
📍 Charts:
- Total Revenue by Region
- Total Impressions by Region
- Total Conversions by Region
Regional data helps marketing teams localize strategies and maximize impact.
Click to Purchases Marketing Campaign Dashboard in Power BI
Time Trend Analysis Page
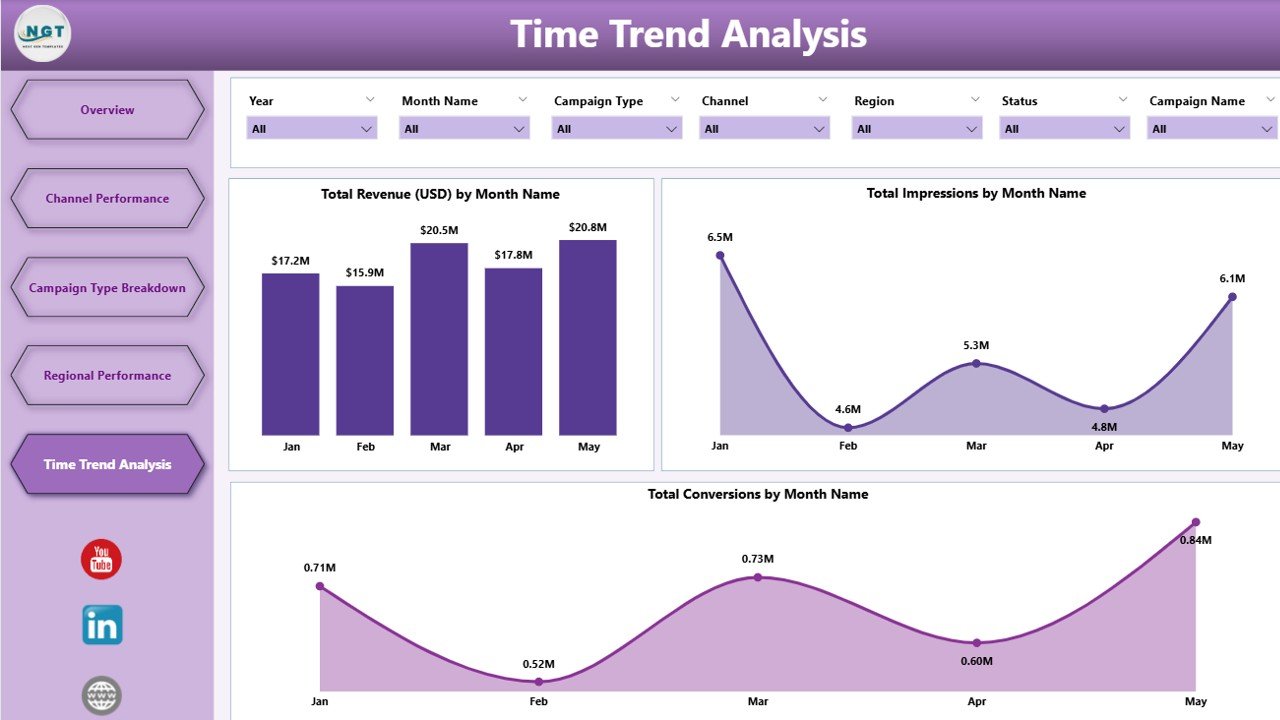
This is your timeline-based dashboard that shows how your campaigns evolve month-over-month.
Charts:
- Total Revenue by Month
- Total Impressions by Month
- Total Conversions by Month
Ideal for identifying seasonal trends, campaign fatigue, or promotional impacts.
Advantages of the Marketing Campaign Dashboard in Power BI
Let’s explore the biggest benefits of using this dashboard for campaign tracking:
-
🔁 Real-Time Data Updates: Connects directly with Excel data for fresh insights without manual effort.
-
📊 Interactive Visuals: Dynamic filters (slicers) and drill-down features help explore details on the fly.
-
🧠 Better Decision Making: Clear visualization improves understanding of which tactics are working.
-
💸 Budget Optimization: Spot overspending or underperforming channels quickly.
-
🌍 Geographic Insights: Helps tailor strategies based on location-based data.
-
📈 Historical Comparison: Time trend page reveals how campaigns progress across months.
Best Practices for Using the Marketing Campaign Dashboard in Power BI
To maximize the dashboard’s power, follow these best practices:
✅ Keep the Data Clean
Ensure the connected Excel data is accurate, complete, and free from duplicates or errors. This avoids misleading insights.
📅 Update Data Regularly
Set a weekly or monthly routine to refresh your Excel data and publish updates to the Power BI dashboard.
🎯 Use Filters Strategically
Don’t just look at overall numbers. Use slicers to filter by:
-
Month
-
Region
-
Campaign type
-
Marketing channel
This uncovers granular insights hidden beneath high-level data.
📤 Share With Stakeholders
Power BI allows you to share dashboards with your team or leadership. Use role-based permissions if needed.
🔄 Version Control
Keep backup versions of your Excel data and Power BI files, especially before applying big changes.
Use Cases for the Marketing Campaign Dashboard
Here are some real-world scenarios where this dashboard shines:
-
🛒 E-commerce Brand: Analyze ad spend vs. sales conversion across Google Ads, Facebook, and Instagram.
-
📧 Email Marketing Team: Monitor campaign type performance such as newsletters vs. promotional blasts.
-
📍 Regional Marketing Manager: Track KPIs per region to launch hyper-localized promotions.
-
🎯 Marketing Agency: Share dashboards with clients to showcase performance reports.
-
📆 CMO or VP Marketing: Get a monthly view of campaign ROI and year-over-year improvements.
How to Customize the Marketing Campaign Dashboard
You can customize this dashboard in Power BI to fit your business needs:
-
🎨 Change Chart Types: Switch between bar, line, pie, and combo charts.
-
✏️ Edit Slicers: Add new filters like campaign duration or budget tiers.
-
🧩 Add KPIs: Insert additional cards like CPA (Cost per Acquisition), CTR, or ROI.
-
🔔 Set Alerts: Power BI Pro users can set alerts when metrics cross certain thresholds.
Tips for Analyzing Campaign Data Using the Dashboard
Here are some practical tips:
-
Compare Channels: Look at conversions vs. cost to calculate efficiency.
-
Spot Drops: Use the Time Trend page to detect any sudden drop in performance.
-
Identify Best Performers: Use Campaign Type Breakdown to find high-converting creatives.
-
Double Down on What Works: Allocate more budget to top-performing regions and channels.
-
Benchmark Performance: Use filters to compare this month vs. last month or previous year.
How to Get Started With This Dashboard
Here’s how to implement this in 5 steps:
-
📥 Download the Dashboard File
-
📊 Prepare Your Excel Data: Ensure your data structure aligns with the template.
-
🔗 Connect Excel to Power BI: Use the “Get Data” feature.
-
🎨 Customize Visuals & Filters
-
📤 Publish and Share With Team
You don’t need to build from scratch—this template is plug-and-play!
Conclusion
The Marketing Campaign Dashboard in Power BI is an essential tool for any team that runs digital campaigns. It consolidates vast amounts of data into one clear, interactive, and professional visual space. Whether you’re optimizing ad spend, exploring regional engagement, or analyzing monthly trends, this dashboard gives you the insights to act fast and smart.
No more juggling spreadsheets or waiting for manual reports—your campaign performance is now just a few clicks away.
Frequently Asked Questions (FAQs)
🔹 What data source does this dashboard use?
It uses a Microsoft Excel file as the primary data source. You can customize or extend the data fields as needed.
🔹 Can I add more metrics to the dashboard?
Yes! Power BI allows you to add new visuals like ROI, Bounce Rate, or Cost per Click. You can also modify slicers and filters.
🔹 Do I need coding knowledge to use this dashboard?
Not at all. This is a no-code solution. You can simply update the Excel file and refresh Power BI.
🔹 Can this dashboard be shared with my team?
Yes. You can publish the dashboard using Power BI service and assign viewing or editing permissions.
🔹 Is it compatible with Power BI Pro?
Yes. The dashboard works in both Power BI Desktop and Power BI Pro (for cloud sharing and collaborati
Visit our YouTube channel to learn step-by-step video tutorials