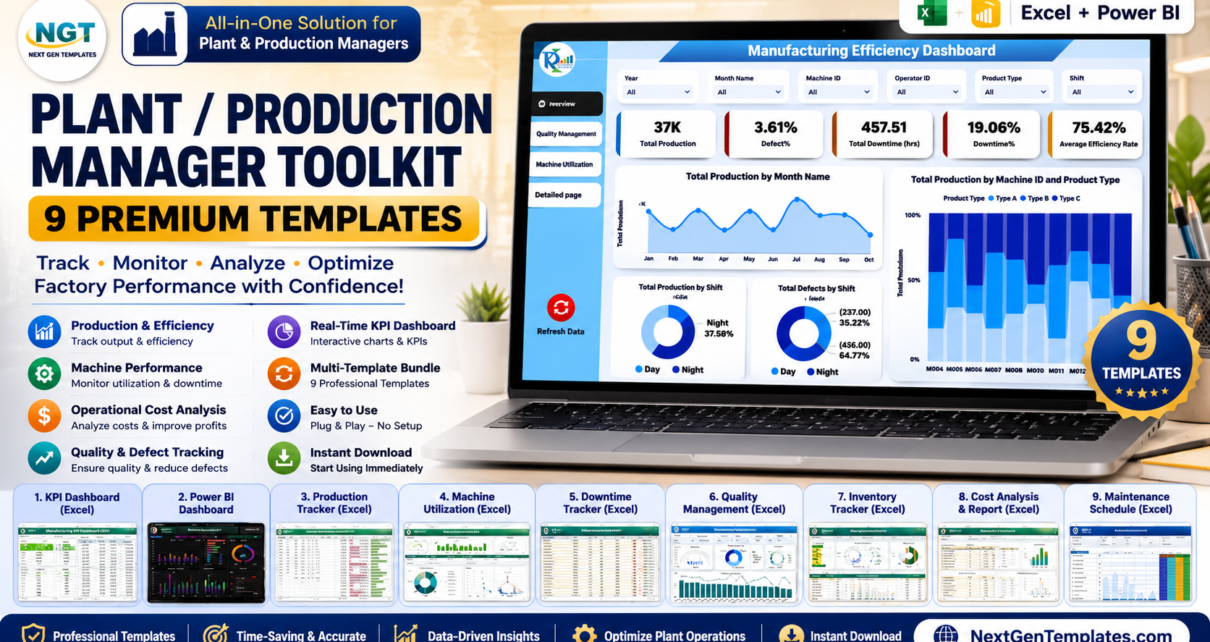
Plant Production Manager Toolkit If you manage a plant, your week is a loop of the same questions: Did we hit target? Where did we lose time? Which machine is bleeding OEE? What does leadership need to see on Friday? The Plant / Production Manager Toolkit answers all of them with 9 premium manufacturing templates spanning Excel and Power BI — production dashboards, OEE analytics, planning trackers, KPI scorecards, a full VBA data-entry system, and heavy-machinery reporting. Purchased separately these templates cost $132.91; as a bundle you get everything for $79.99 — a clean 40% saving of $52.92. In this guide we break down exactly what is inside, how the numbers compare, and how to roll the toolkit out across your factory.
🏭 Plant / Production Manager Toolkit
9 Premium Templates | Excel + Power BI | Instant Download
$132.91 $79.99
You Save $52.92 (40% OFF)
Key Features of the Plant / Production Manager Toolkit
Complete factory coverage in one purchase. Most template shopping for a production role happens piecemeal — a dashboard here, a scorecard there, a planning sheet from somewhere else, each with a different look and logic. This toolkit was assembled as a coherent stack: the same manufacturing KPI language (OEE, FPY, MTBF, MTTR, throughput, schedule attainment) runs through every file, so numbers reconcile across your daily, weekly and monthly reporting.
Excel and Power BI, deliberately mixed. Excel remains the fastest tool for shop-floor standups and shift handovers — it works offline, needs no licence beyond Office, and everyone can open it. Power BI is what leadership expects for interactive multi-plant reviews. The toolkit gives you both: eight Excel-based templates for the operational layer and a Power BI efficiency dashboard for the executive layer.
From data entry to boardroom. The bundle is unusual in covering the entire reporting chain. The VBA-based Production Management System captures records at the source through forms; the dashboards and reports turn those records into analysis; the KPI Scorecard condenses everything into a traffic-light MTD/YTD summary your monthly review can run on. Nothing needs to be built — only filled.
Plug-and-play by design. Every template ships with sample data, a structured input sheet, and pre-wired charts and KPI cards. Replace the sample rows with your production records and the visuals refresh automatically — no formulas to write, no DAX to learn for the Excel files, and a ready-made model in the Power BI file.
What’s Included in the Toolkit
1. Manufacturing Dashboard in Excel – $17.99
The flagship of the kit: a 7-page factory dashboard covering production overview, OEE with its Availability–Performance–Quality components, quality and defect analysis, downtime with MTBF/MTTR, and inventory. 100% native Excel with no macros. View the product page.
 Manufacturing Dashboard in Excel
2. Manufacturing Efficiency Dashboard in Power BI – $17.99
The leadership view. Interactive OEE and efficiency analytics with slicers and drill-downs, built for comparing lines, shifts and plants in review meetings. View the product page.
 Manufacturing Efficiency Dashboard in Power BI
3. Manufacturing KPI Dashboard – $12.99
A compact Excel KPI board for fast daily tracking — the sheet you pull up at the morning standup and the shift handover. View the product page.
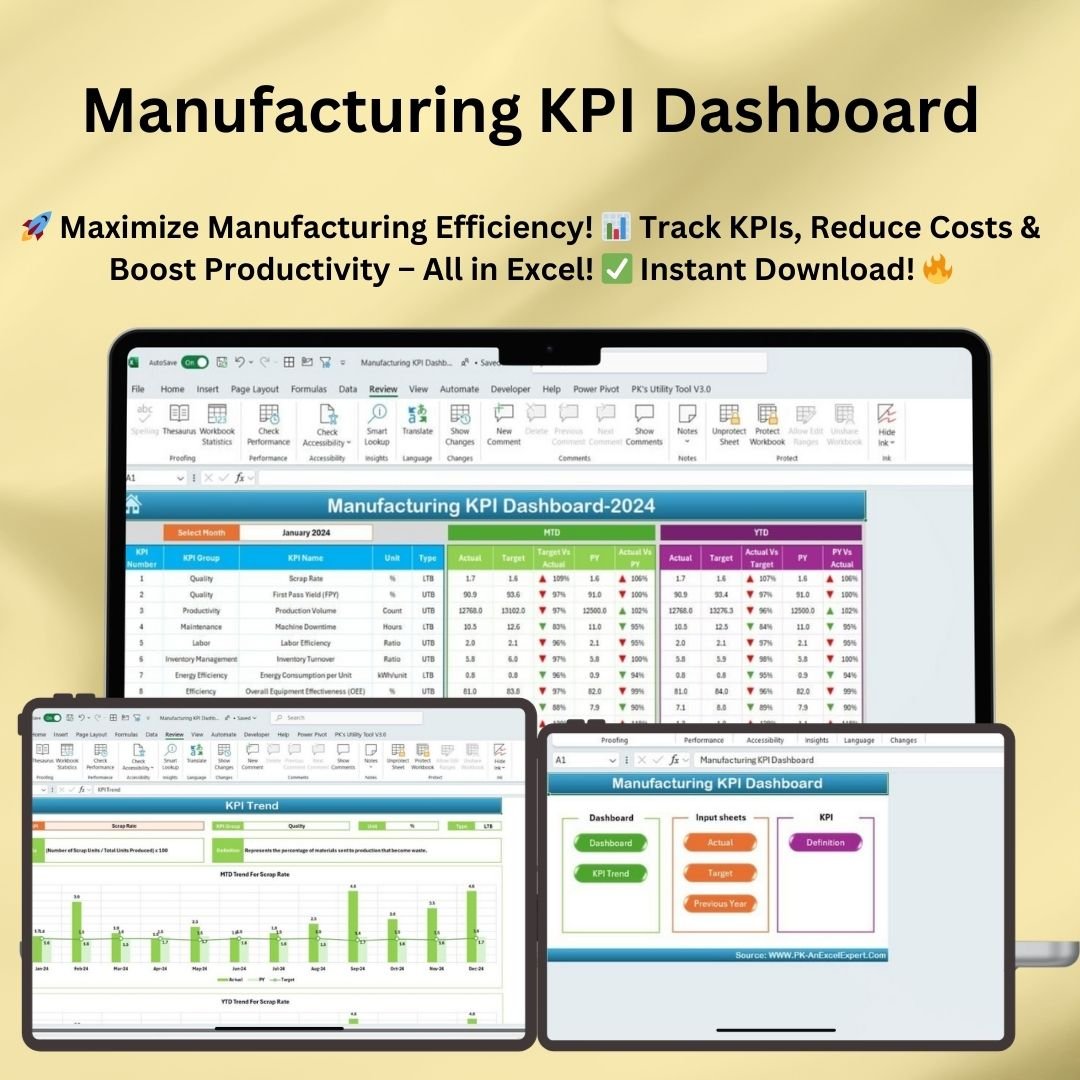 Manufacturing KPI Dashboard
4. Industrial Manufacturing KPI Dashboard in Excel – $12.99
Heavy-industry KPI views for multi-line industrial plants — output, efficiency and cost tracked side by side. View the product page.
 Industrial Manufacturing KPI Dashboard in Excel
5. Manufacturing KPI Scorecard in Excel – $12.99
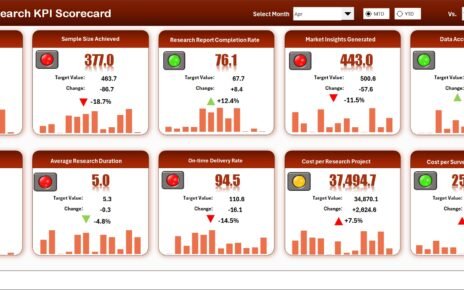
An MTD/YTD actual-vs-target scorecard with traffic-light status — the one-page summary that turns monthly reviews from a slide-building exercise into a five-minute update. View the product page.
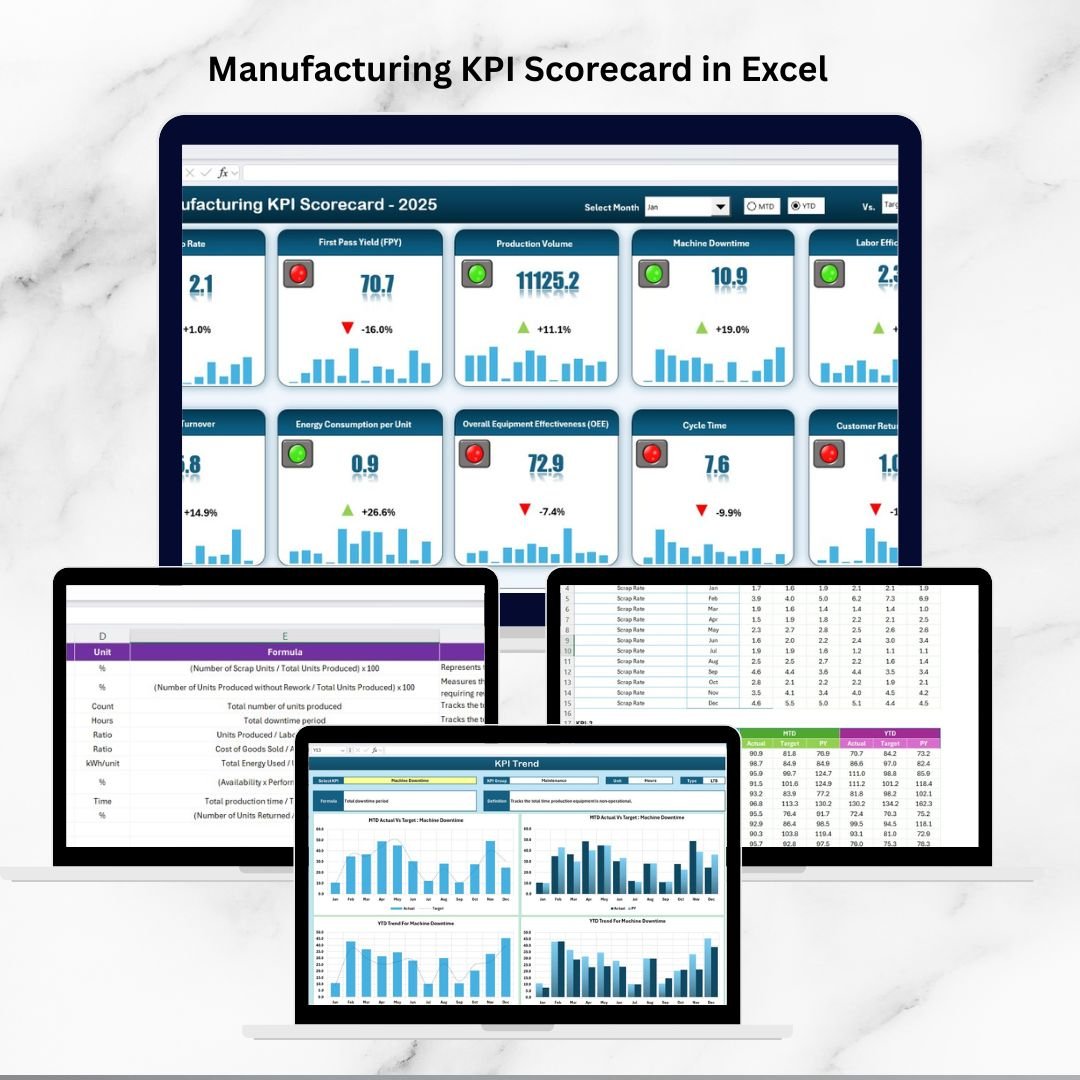 Manufacturing KPI Scorecard in Excel
6. Manufacturing Process Report in Excel – $6.99
A clean process-level reporting template for shift and line summaries — structured, print-ready and quick to fill. View the product page.
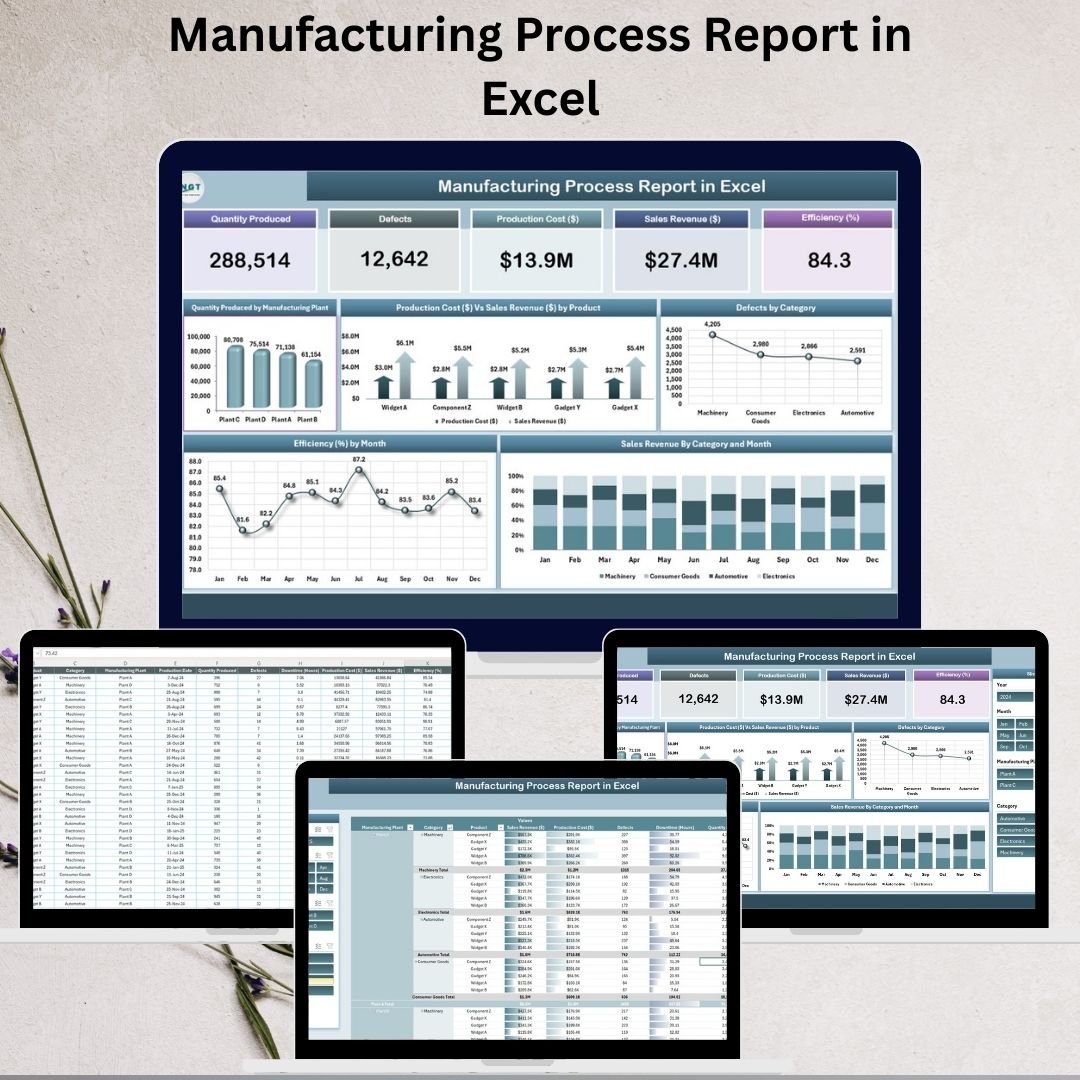 Manufacturing Process Report in Excel
7. Manufacturing Production Management System V1.0 – $19.99
A complete Excel VBA application for production record-keeping: data-entry forms, add/update/delete management, and built-in reporting — so records are captured cleanly at the source instead of retyped from paper. View the product page.
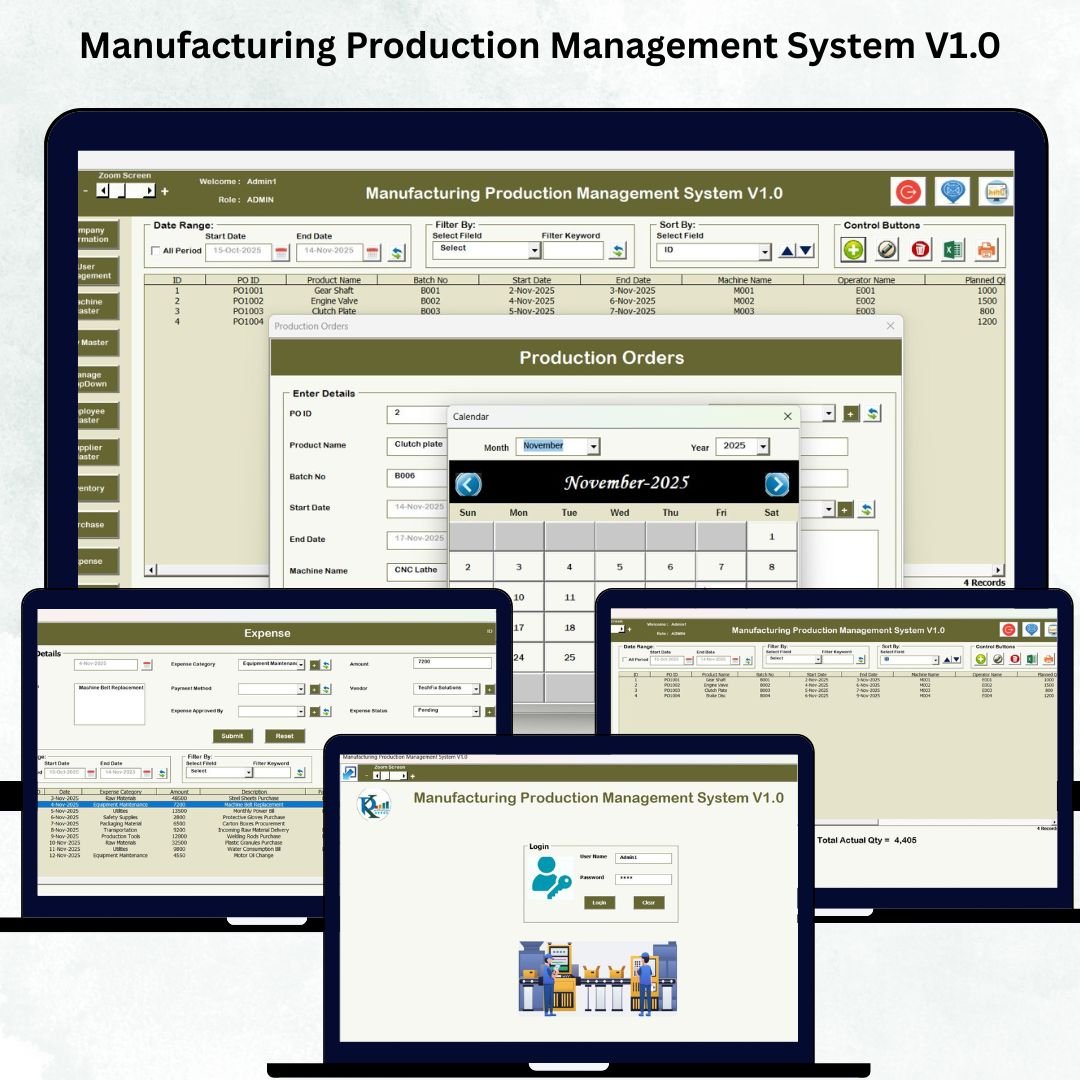 Manufacturing Production Management System V1.0
8. Production Planning Dashboard in Excel – $17.99
Plan vs actual output, capacity and schedule attainment in one tracker — closing the loop between what planning promised and what the floor delivered. View the product page.
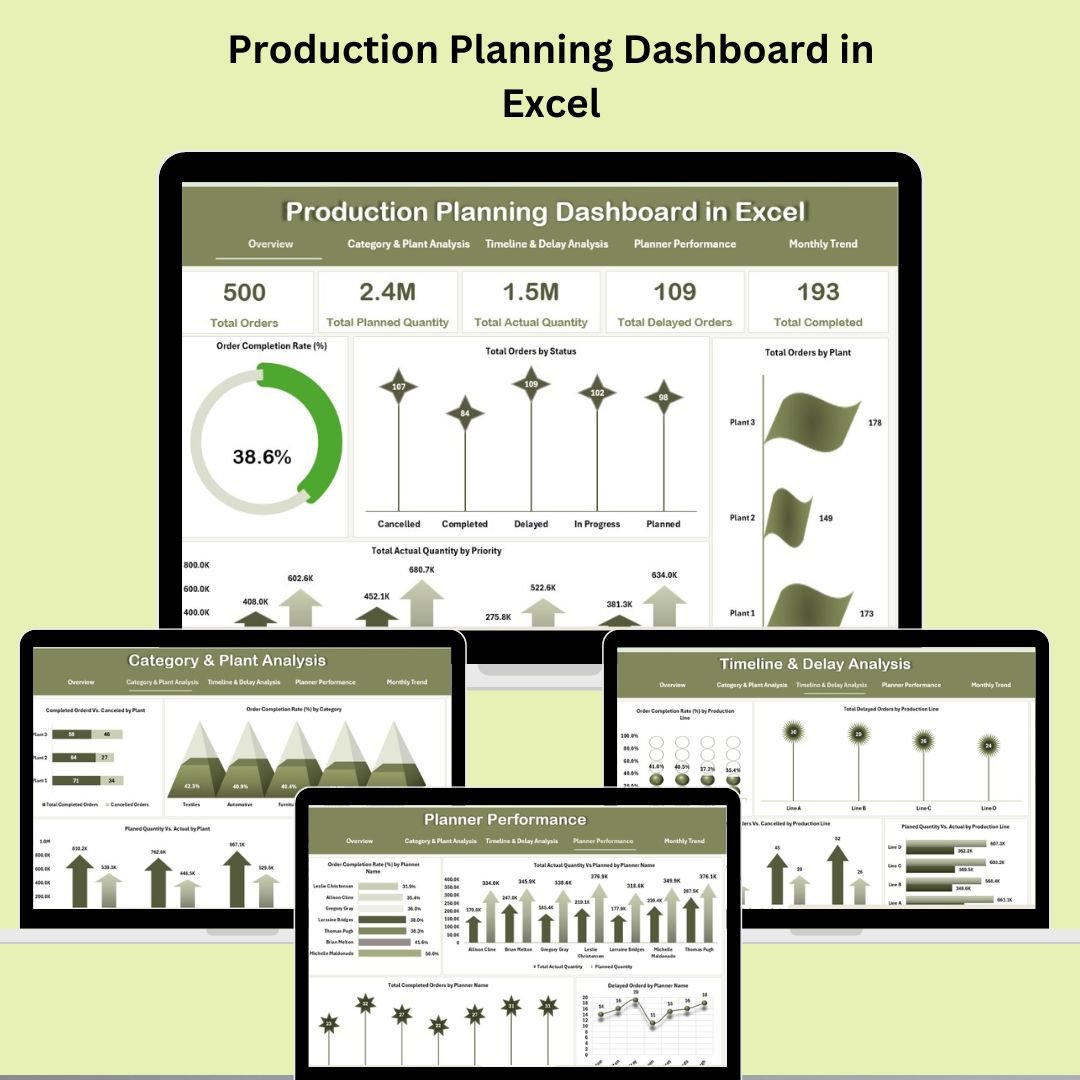 Production Planning Dashboard in Excel
9. Heavy Machinery KPI Dashboard in Excel – $12.99
For equipment-intensive operations: machinery utilisation, fuel consumption, maintenance schedules and downtime analytics in a single Excel file. View the product page.
 Heavy Machinery KPI Dashboard in Excel
Smart Comparison — Individual Prices vs the Bundle
| # | Template | Platform | Individual Price |
|---|---|---|---|
| 1 | Manufacturing Dashboard in Excel | Excel | $17.99 |
| 2 | Manufacturing Efficiency Dashboard in Power BI | Power BI | $17.99 |
| 3 | Manufacturing KPI Dashboard | Excel | $12.99 |
| 4 | Industrial Manufacturing KPI Dashboard in Excel | Excel | $12.99 |
| 5 | Manufacturing KPI Scorecard in Excel | Excel | $12.99 |
| 6 | Manufacturing Process Report in Excel | Excel | $6.99 |
| 7 | Manufacturing Production Management System V1.0 | Excel (VBA) | $19.99 |
| 8 | Production Planning Dashboard in Excel | Excel | $17.99 |
| 9 | Heavy Machinery KPI Dashboard in Excel | Excel | $12.99 |
| Individual Total | |||
| 🏭 Plant / Production Manager Toolkit | $79.99 — Save $52.92 (40%) | ||
Advantages of Buying the Bundle
The economics are simple. Nine templates for $79.99 works out to under $8.90 per template — less than the cheapest item in the kit costs on its own at full price. Even if you only ever use six of the nine files, you are still ahead of buying those six individually.
Consistency across reporting layers. Because every template speaks the same KPI language, the OEE number on the shop-floor dashboard matches the OEE number on the leadership scorecard. That alignment usually takes weeks of internal template-building to achieve; here it is the default.
One download, immediate rollout. A single checkout delivers one ZIP containing all nine files. There is no licence management, no subscription renewals, and no per-user pricing — the templates are yours to deploy across the plant.
Room to grow. Smaller operations can start with just the Manufacturing Dashboard and the Process Report, then activate planning, machinery and Power BI layers as reporting matures — without buying anything new.
Best Practices for Rolling Out the Toolkit
Start with one source of truth. Begin with the Manufacturing Dashboard in Excel and standardise your data columns (date, shift, machine, units, downtime, defects). Every other template in the kit consumes the same style of data, so getting the input format right once pays off nine times.
Put the VBA system at the point of capture. Deploy the Production Management System where records are created — the supervisor’s desk or the line-side terminal — so data enters through forms instead of loose spreadsheets. Clean capture upstream is what makes every downstream dashboard trustworthy.
Match the template to the meeting. Daily standup: Manufacturing KPI Dashboard. Weekly ops review: Production Planning Dashboard plus the downtime pages. Monthly leadership review: KPI Scorecard and the Power BI Efficiency Dashboard. Maintenance review: Heavy Machinery KPI Dashboard. When each meeting has a fixed artefact, reporting stops being reinvented every week.
Set targets before you present. Each template exposes target fields — fill them from last year’s actuals or your budget before the first review, so every chart shows variance rather than raw numbers.
Explore More Templates
The toolkit pairs well with the wider NextGenTemplates catalog. Browse the complete Manufacturing Excel template library, the full Excel KPI Dashboard collection, and the broader Excel dashboard catalog for adjacent areas like maintenance, inventory and quality.
Frequently Asked Questions
What is the Plant / Production Manager Toolkit?
It is a bundle of 9 premium manufacturing templates — 8 Excel-based files (dashboards, a KPI scorecard, a process report, a planning tracker, a VBA management system, and machinery analytics) plus 1 Power BI efficiency dashboard — sold together for $79.99 instead of the $132.91 combined individual price.
Who is this toolkit for?
Plant managers, production heads, operations directors, maintenance and reliability engineers, production planners, continuous-improvement teams, and manufacturing consultants who need ready-made reporting rather than weeks of spreadsheet building.
What software do I need?
Excel 2016 or later (or Microsoft 365) for the eight Excel files — the VBA management system requires macros to be enabled — and the free Power BI Desktop for the Power BI dashboard.
Can I use my own production data?
Yes. Every template includes a structured data sheet with sample records. Replace the samples with your own rows and all KPI cards and charts update automatically; targets and lists are adjustable on each template’s support/settings sheet.
Is this a subscription?
No. It is a one-time purchase with instant download and lifetime access — no recurring fees, no user limits, and no expiry.
How much do I actually save?
The nine templates cost $132.91 when bought separately. The bundle price is $79.99, which is a saving of $52.92 — 40% off — for the identical files.
Conclusion
A production manager’s reporting stack usually gets assembled slowly and painfully — one template at a time, each with its own formatting and logic. The Plant / Production Manager Toolkit compresses that whole journey into a single $79.99 download: daily dashboards, planning, scorecards, machinery analytics, a data-entry system and a Power BI leadership view, all speaking the same KPI language. At 40% below the individual total, it is the fastest and cheapest route to a complete plant-analytics setup.
🏭 Get All 9 Templates for $79.99
$132.91 $79.99
You Save $52.92 (40% OFF)
For step-by-step Excel & Power BI dashboard tutorials, visit our YouTube channel: Youtube.com/@PKAnExcelExpert