Port operations play a critical role in global trade and logistics. Every day, ports handle vessel arrivals, cargo movements, yard operations, and turnaround schedules. Therefore, even a small delay or inefficiency can create significant financial and operational impact.
That is why a Port Operations KPI Dashboard in Excel becomes an essential management and decision-support tool.
In this detailed article, you will learn what a Port Operations KPI Dashboard in Excel is, why ports need it, how it works, its worksheet-wise structure, data input process, advantages, best practices, and frequently asked questions. Moreover, the language remains clear, practical, and easy to understand for both operational and management teams.
Click to Purchases Port Operations KPI Dashboard in Excel
What Is a Port Operations KPI Dashboard in Excel?
A Port Operations KPI Dashboard in Excel is a ready-to-use analytical tool that tracks, measures, and visualizes key performance indicators related to port and terminal operations.
Instead of relying on multiple spreadsheets and manual reports, this dashboard consolidates all KPIs into one structured Excel file. As a result, port managers, operations teams, and analysts can monitor performance quickly and accurately.
Furthermore, Excel makes this dashboard flexible, cost-effective, and easy to customize. Therefore, even ports without advanced BI tools can benefit from strong data-driven insights.
Why Do Port Operations Need a KPI Dashboard?
Port operations involve complex processes such as cargo handling, vessel berthing, yard utilization, and equipment performance. Without a structured KPI system, tracking these processes becomes difficult.
A KPI dashboard helps because it:
-
Provides real-time operational visibility
-
Highlights delays and bottlenecks
-
Tracks target achievement clearly
-
Improves coordination between teams
-
Reduces manual reporting effort
-
Supports faster operational decisions
As a result, ports can improve efficiency, reduce turnaround time, and enhance service quality.
How Does a Port Operations KPI Dashboard in Excel Work?
The dashboard works by combining structured data input with automated calculations and visuals.
The overall workflow looks like this:
-
Enter actual, target, and previous year data
-
Select the reporting month
-
Excel calculates MTD and YTD metrics
-
Conditional formatting highlights performance
-
Charts and trends update automatically
Because of this design, users spend less time on reporting and more time on analysis.
Click to Purchases Port Operations KPI Dashboard in Excel
Worksheet-Wise Structure of the Port Operations KPI Dashboard in Excel
This dashboard contains 7 well-organized worksheets, each designed for a specific purpose.
1. Home Sheet: How Does Navigation Become Easy?
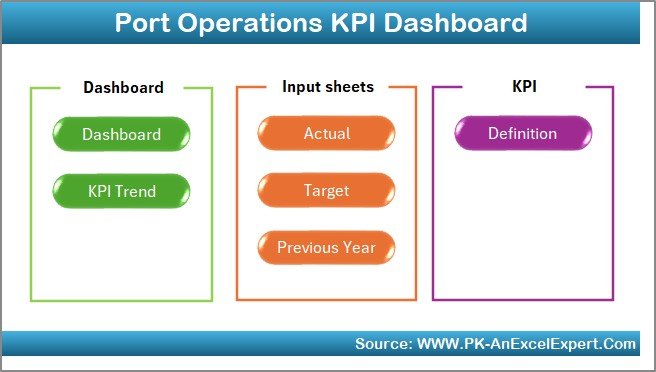
The Home sheet acts as an index or landing page for the dashboard.
Key Features of the Home Sheet
-
Clean and simple layout
-
6 navigation buttons
-
One-click access to all major sheets
Because of this structure, users can quickly jump to the required analysis page without scrolling through tabs.
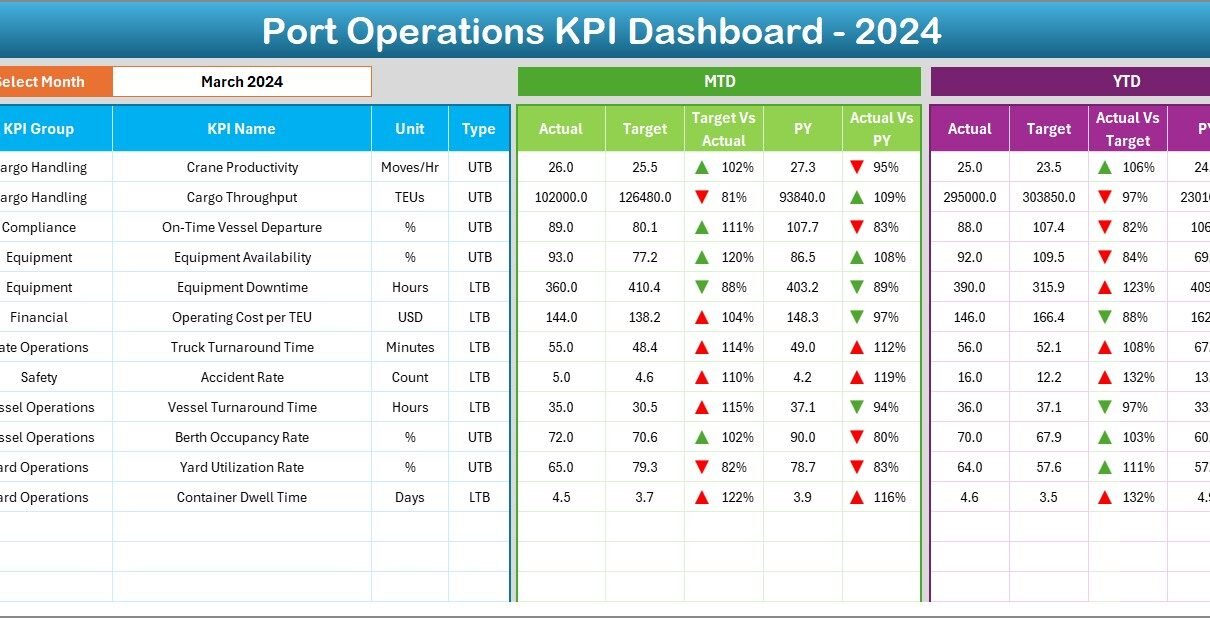
2. Dashboard Sheet: How Do You Monitor Overall KPI Performance?
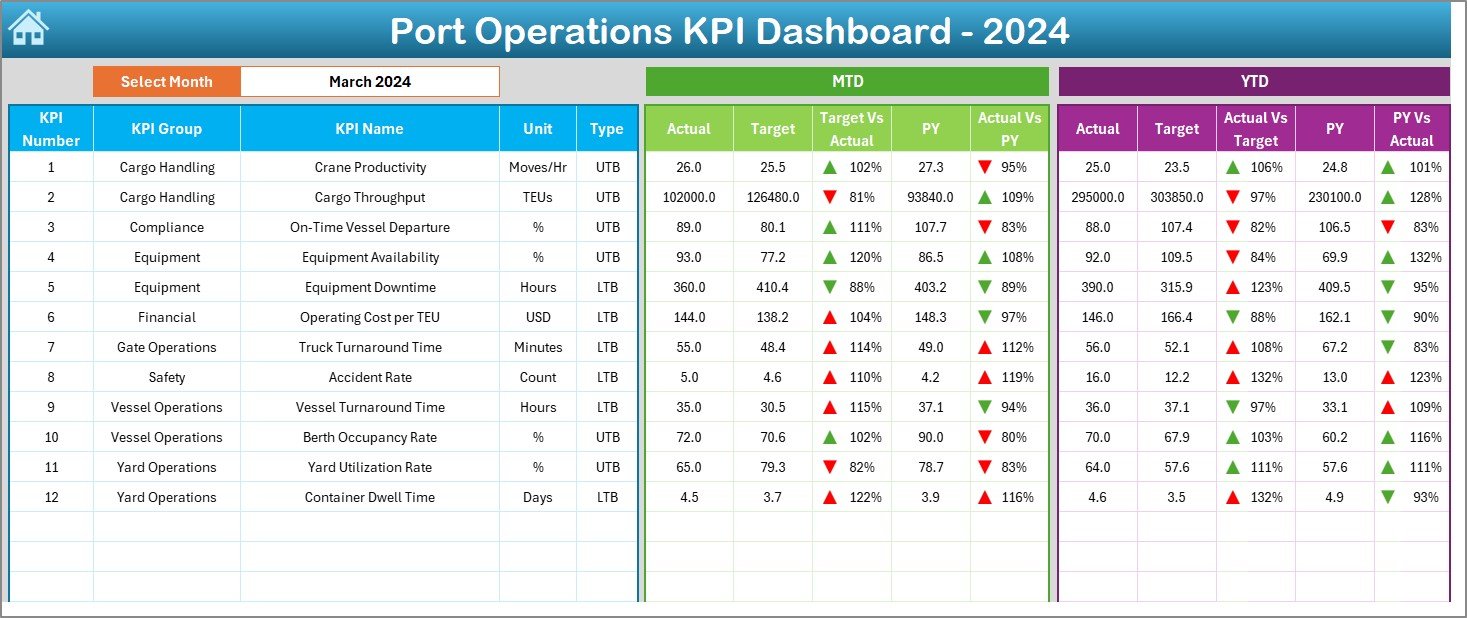
The Dashboard sheet is the main analytical page of the file.
Month Selection Feature
On cell D3, you can select the reporting month using a drop-down list. Once selected:
-
All KPI values update automatically
-
MTD and YTD calculations refresh
-
Comparisons adjust for the selected month
Therefore, month-wise analysis becomes fast and accurate.
KPI Performance Metrics Displayed
This dashboard displays comprehensive KPI information, including:
Monthly Performance (MTD)
-
Actual MTD
-
Target MTD
-
Previous Year MTD
-
Target vs Actual (MTD)
-
Previous Year vs Actual (MTD)
Conditional formatting with up (▲) and down (▼) arrows visually indicates performance status.
Year-to-Date Performance (YTD)
-
Actual YTD
-
Target YTD
-
Previous Year YTD
-
Target vs Actual (YTD)
-
Previous Year vs Actual (YTD)
As a result, users can evaluate both short-term and long-term performance in one view.
3. KPI Trend Sheet: How Can You Analyze KPI Behavior Over Time?
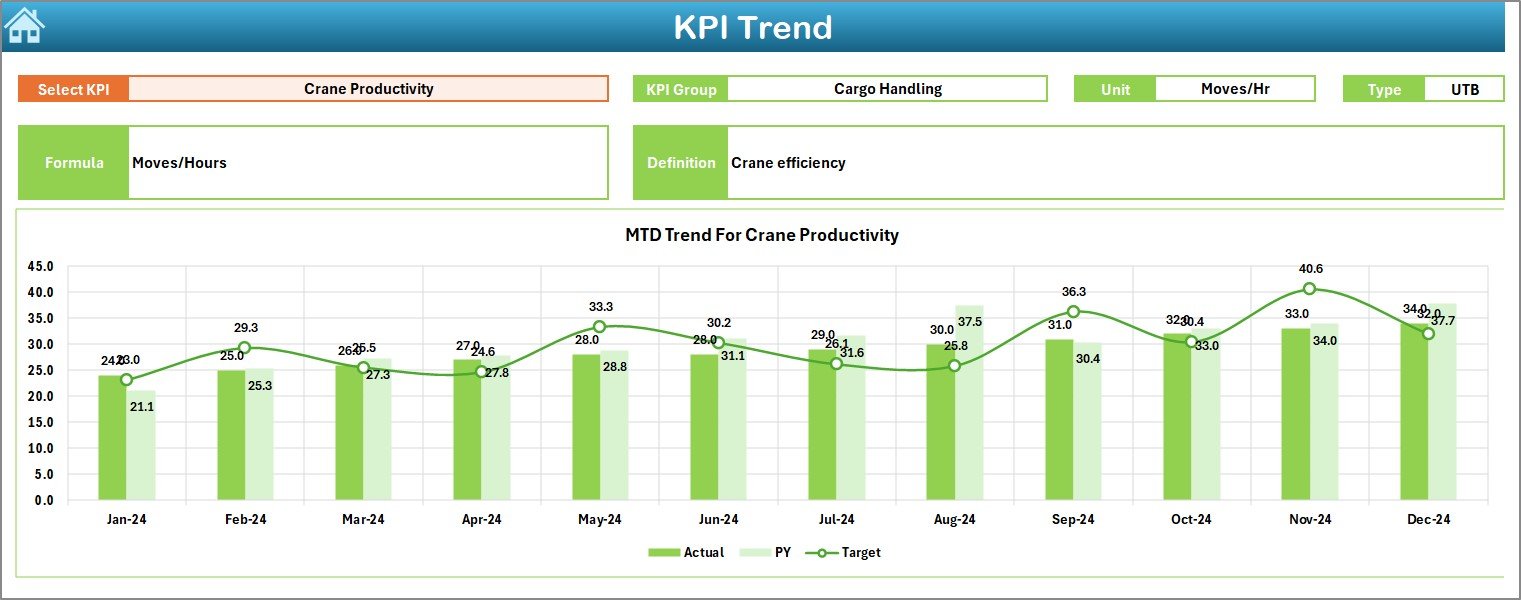
The KPI Trend sheet focuses on trend-based analysis for individual KPIs.
KPI Selection Feature
On cell C3, users can select a KPI name from the drop-down list. Once selected, the dashboard dynamically updates all related details.
KPI Details Displayed
This sheet clearly shows:
-
KPI Group
-
KPI Unit
-
KPI Type (LTB or UTB)
-
KPI Formula
-
KPI Definition
Because of this, users always understand what they are analyzing.
Trend Charts Included
The sheet displays MTD and YTD trend charts for:
-
Actual values
-
Target values
-
Previous Year values
Therefore, users can easily identify growth patterns, inefficiencies, and seasonal trends.
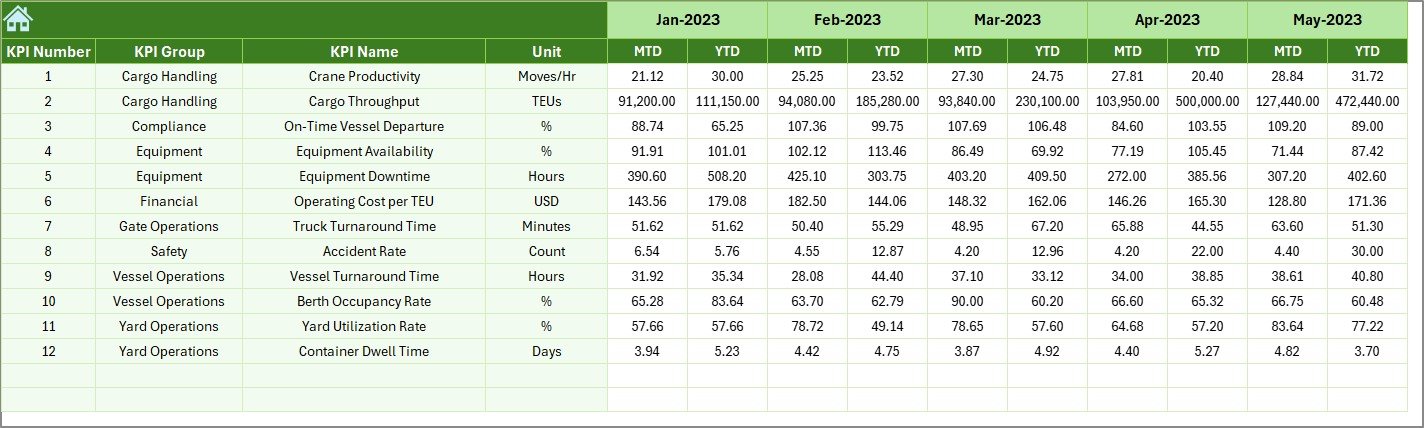
4. Actual Numbers Input Sheet: How Do You Enter Actual Data?

The Actual Numbers Input sheet captures real operational performance.
How to Enter Data Correctly
-
Enter MTD and YTD actual values for each KPI
-
Use cell E1 to select the reporting month
-
Always input the first month of the year initially
This sheet serves as the backbone for all performance calculations.
5. Target Sheet: How Do You Define Performance Goals?

The Target sheet stores planned performance values.
Key Inputs Required
-
KPI-wise MTD target values
-
KPI-wise YTD target values
-
Month-specific target setting
Targets help compare planned versus actual performance effectively.
Click to Purchases Port Operations KPI Dashboard in Excel
6. Previous Year Number Sheet: Why Is Historical Comparison Important?
The Previous Year Number sheet captures last year’s performance data.
Why This Sheet Matters
-
Enables year-on-year comparison
-
Highlights growth or decline
-
Supports realistic target setting
Historical data adds context and depth to performance analysis.
7. KPI Definition Sheet: Why Is KPI Standardization Critical?
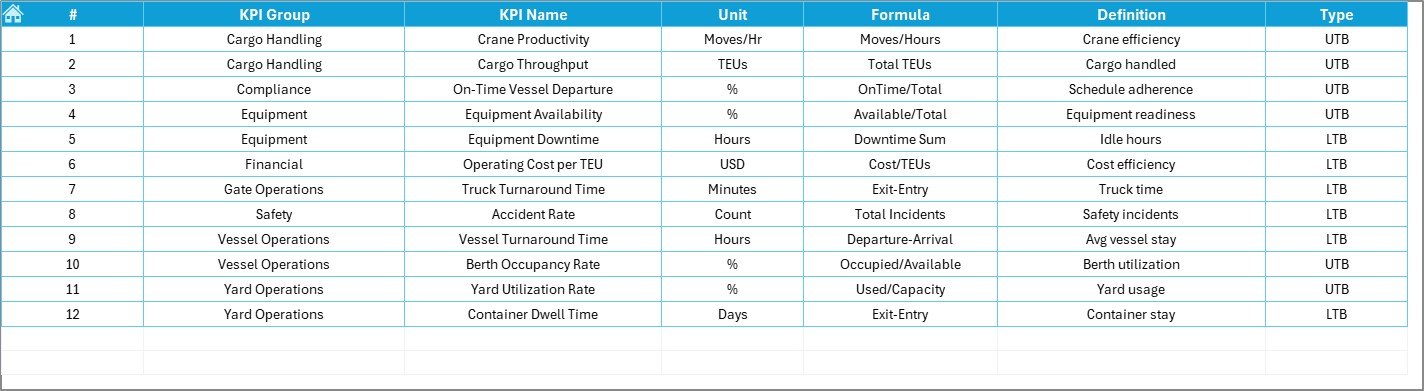
The KPI Definition sheet ensures consistency and clarity across the dashboard.
Information Captured in This Sheet
-
KPI Name
-
KPI Group
-
Unit of Measurement
-
KPI Formula
-
KPI Definition
Because of this sheet, all users interpret KPIs in the same way.
Advantages of Port Operations KPI Dashboard in Excel
Using this dashboard offers multiple operational and strategic advantages.
Key Advantages Explained
-
Centralized KPI monitoring
All operational metrics stay in one file. -
Improved efficiency tracking
Identify delays and bottlenecks quickly. -
Visual performance indicators
Conditional formatting simplifies analysis. -
Time-saving reporting
Automated calculations reduce manual work. -
Flexible and customizable
Easily add or modify KPIs. -
Cost-effective solution
No advanced BI tools required.
Best Practices for Port Operations KPI Dashboard in Excel
Following best practices ensures reliable and actionable insights.
Recommended Best Practices
-
Define KPIs clearly and consistently
-
Update actual data regularly
-
Review MTD and YTD performance monthly
-
Validate target and previous year data
-
Avoid tracking too many KPIs at once
-
Train users on dashboard navigation
-
Maintain data accuracy and consistency
By applying these practices, ports can maximize dashboard value.
Click to Purchases Port Operations KPI Dashboard in Excel
Who Should Use a Port Operations KPI Dashboard?
This dashboard benefits a wide range of users:
-
Port authorities
-
Terminal managers
-
Operations supervisors
-
Planning and strategy teams
-
Logistics and supply chain analysts
Because of its Excel-based design, it suits both small ports and large terminals.
Conclusion: Why Is a Port Operations KPI Dashboard in Excel Essential?
A Port Operations KPI Dashboard in Excel transforms complex operational data into clear, actionable insights. It improves visibility, enhances efficiency, and supports better decision-making.
Instead of managing multiple reports, port teams rely on a single, structured dashboard. Moreover, Excel makes this solution accessible, flexible, and easy to maintain.
If you want stronger operational control, improved efficiency, and data-driven port management, this dashboard becomes an essential tool.
Frequently Asked Questions (FAQs)
What is a Port Operations KPI Dashboard in Excel?
It is an Excel-based dashboard used to track and analyze port performance KPIs.
Do I need advanced Excel skills to use this dashboard?
No. Basic Excel knowledge is sufficient.
Can I customize KPIs in the dashboard?
Yes. You can easily add, remove, or modify KPIs.
How often should I update the data?
You should update it monthly or as required.
Can this dashboard support multiple terminals?
Yes. With minor customization, it can support multiple terminals.
Is this dashboard suitable for small ports?
Yes. It works well for both small and large port operations.
Click to Purchases Port Operations KPI Dashboard in Excel
Visit our YouTube channel to learn step-by-step video tutorials