In any organization, managing resources effectively can be the difference between a successful project and a missed deadline. Whether you’re handling a small team or coordinating across multiple departments, knowing how your resources are allocated matters. That’s why we created the Resource Allocation Dashboard in Excel — a powerful, ready-to-use solution designed to help you visualize, track, and manage resource allocation in one place.
So, if you’re tired of juggling spreadsheets and wish there was a simple, effective way to keep your resource planning organized, then keep reading — because this dashboard will change the way you work.
Click to Purchases Resource Allocation Dashboard in Excel
What Is a Resource Allocation Dashboard in Excel?
A Resource Allocation Dashboard is a dynamic Excel template that allows project managers, HR professionals, and operations teams to view and analyze how human resources are distributed across tasks, roles, departments, and time periods.
Instead of manually updating endless columns and charts, this dashboard does all the heavy lifting for you. It pulls data from your inputs and displays the information using interactive charts, cards, and slicers — all in real-time.
Who Can Use This Dashboard?
-
Project Managers
-
HR Departments
-
Department Heads
-
Business Analysts
-
Small Business Owners
And honestly, anyone responsible for assigning or tracking employee work hours can benefit from it.
Key Features of the Resource Allocation Dashboard
Our Excel-based dashboard comes with five powerful analytical pages and intuitive navigation, making it incredibly easy to use — even if you aren’t an Excel expert.
Page Navigator
Located at the top of the dashboard, the Page Navigator lets you jump between different views instantly. No need to scroll endlessly!
Dashboard Pages
Let’s explore each page and what it offers:
Overview Page

This is the main hub of your dashboard. On this page, you’ll find:
-
A summary panel with 5 Key Metric Cards
4 interactive charts:
- # of Resources by Utilization Category
- Average Allocation Hours by Department
- Progress % by Utilization Category
- Total Allocated Hours by Utilization Category
It gives a bird’s-eye view of your current resource situation.
Departmental Summary
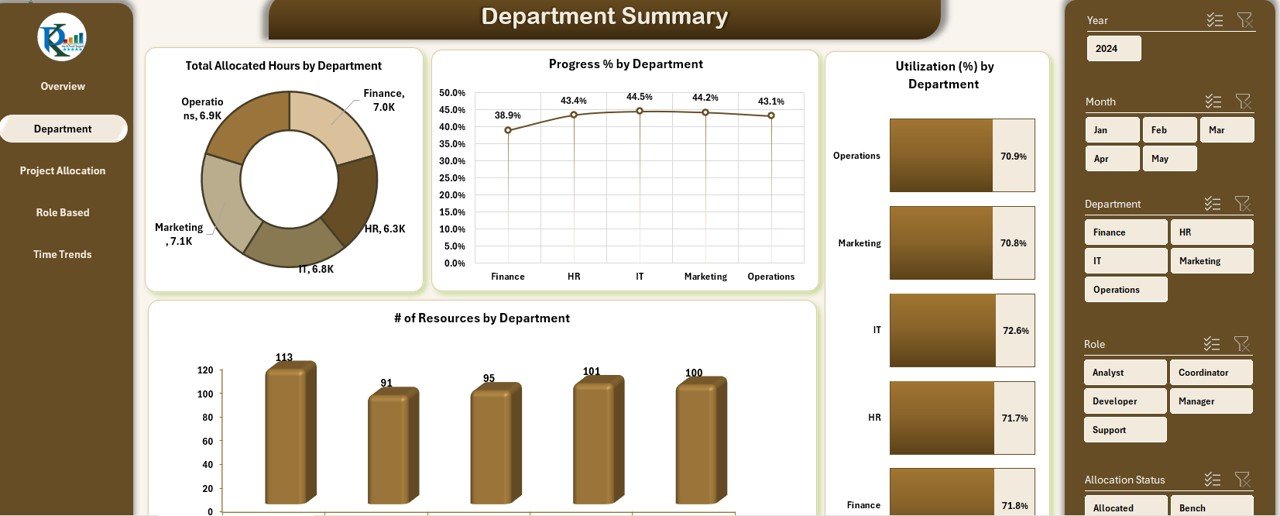
This page breaks down resource metrics by department:
-
Total Allocated Hours
-
Progress Percentage
-
Utilization Rate (%)
-
Number of Resources
Great for department heads to quickly identify bottlenecks or underutilized teams.
Click to Purchases Resource Allocation Dashboard in Excel
Project Allocation View

Here, you can analyze data based on individual projects:
-
Resources assigned per project
-
Utilization percentage
-
Allocation hours
-
Progress tracking
It’s perfect for tracking how each project is moving and whether it’s overstaffed or understaffed.
Role-Based Utilization

Focuses on employee roles such as Developer, Designer, Analyst, etc. This page showcases:
-
Utilization by Role
-
Allocated Hours by Role
-
Total Resources Assigned
-
Progress % by Role
Ideal for understanding how specific skillsets are being used.
Time Trends

Time is everything in resource management. This page shows monthly trends:
-
Allocation Hours by Month
-
Progress Percentage by Month
-
Utilization Rate over Time
Use this to predict future workloads and plan more effectively.
Data Input and Structure
Behind the scenes, the dashboard relies on two main sheets:
Data Sheet

This is where you input all your information. It includes the following fields:
-
Resource ID
-
Employee Name
-
Department
-
Project
-
Role
-
Start Date & End Date
-
Allocated Hours
-
Utilization (%)
-
Allocation Type
-
Status
-
Progress (%)
-
Utilization Category
-
Month & Year
Support Sheet

This sheet handles dropdown lists and backend data validation to keep the dashboard running smoothly.
Advantages of the Resource Allocation Dashboard in Excel
✅ Visual Clarity
Instead of looking at rows of raw data, view everything in charts, cards, and percentages — making decision-making much easier.
✅ Centralized Planning
See all departments, roles, and projects in one place. This helps prevent over-allocating or underutilizing your team.
✅ No Extra Tools Needed
Everything runs in Microsoft Excel. No need to buy or learn new software.
✅ Real-Time Tracking
Make changes in the Data Sheet and instantly see the updated numbers across all pages.
✅ Time-Saving
Automated charts and formulas reduce manual work, saving hours every week.
Best Practices for Using the Resource Allocation Dashboard
To get the most out of this dashboard, follow these tips:
1. Keep Your Data Updated
Update your Data Sheet regularly. The more current your data, the more reliable your dashboard insights will be.
2. Use Consistent Naming Conventions
Avoid variations like “Marketing” vs. “Mktg.” for departments. Consistency ensures your charts and filters work correctly.
3. Assign Clear Roles and Statuses
Clarify whether a task is “In Progress,” “Planned,” or “Completed” using the Status column.
4. Monitor Utilization Rates
A very high utilization rate might burn out your team, while too low a rate indicates inefficiency. Use this dashboard to balance workloads.
5. Use Slicers and Filters Actively
Leverage Excel’s slicers to view department-wise, project-wise, or role-wise breakdowns in a click.
How to Get Started with the Dashboard
Click to Purchases Resource Allocation Dashboard in Excel
-
Download the Template
Get the ready-to-use dashboard file. -
Fill the Data Sheet
Enter all relevant details such as Employee Name, Role, Project, Allocation, and Dates. -
Navigate Through Pages
Use the page navigator to move between Overview, Departmental View, Projects, Roles, and Time Trends. -
Analyze and Take Action
Review the charts and metrics to redistribute resources as needed.
When Should You Use This Dashboard?
Here are some scenarios where this dashboard becomes invaluable:
-
You’re planning multiple projects and need to allocate staff efficiently.
-
You want to reduce resource idleness or overwork.
-
You need to prepare monthly resource reports for leadership.
-
You want to improve employee utilization without hiring more staff.
Why Excel for Resource Allocation?
You might wonder, why not use specialized software?
Here’s why Excel still wins:
-
Cost-Effective: No license or subscription fees.
-
Customizable: You can tweak the dashboard to fit your unique needs.
-
Easy to Use: Almost everyone knows how to use Excel.
-
Offline Access: No internet? No problem.
Excel gives you flexibility without the learning curve.
Conclusion
Managing your team’s time and effort shouldn’t be chaotic. The Resource Allocation Dashboard in Excel is a smart, efficient, and user-friendly tool that helps you plan and analyze resource distribution across departments, roles, and projects. With real-time visuals, interactive filters, and centralized data, you’re empowered to make data-driven decisions — without the need for expensive tools.
Frequently Asked Questions (FAQs)
1. Can I customize the dashboard to suit my organization’s needs?
Yes, the Excel file is fully editable. You can add more departments, roles, or modify charts to fit your needs.
2. Do I need advanced Excel skills to use it?
Not at all! This dashboard uses pre-built formulas and slicers. If you can enter data into a table, you can use this tool.
3. Can I track projects across months or years?
Yes, the dashboard includes fields for Month and Year, allowing for multi-period tracking.
4. How often should I update the data?
Weekly updates are recommended for accurate tracking, but you can update it as frequently as needed.
5. Is this dashboard suitable for freelancers or small teams?
Absolutely. It works well for teams of any size — from freelancers managing multiple clients to large organizations with multiple departments.
Visit our YouTube channel to learn step-by-step video tutorials