Retail and e-commerce businesses evolve at breakneck speed. Consequently, product development teams must stay agile, data-driven, and customer-focused. A Retail and E-commerce Product Development KPI Dashboard in Excel gives you a centralized, interactive view of your most critical metrics. With this dashboard, you can monitor progress, spot trends, and make informed decisions—right from your Excel workbook.
Moreover, you avoid manual report generation and siloed data. Furthermore, by leveraging Excel’s familiar interface and powerful PivotTable functionality, you empower every stakeholder—from developers to executives—to collaborate effectively. In this article, we’ll explore the dashboard’s features, demonstrate its benefits, and share best practices to ensure you extract maximum value from your KPI tracking.
Click to Purchases Retail and E-commerce Product Development KPI Dashboard in Excel
What Is a Retail and E-commerce Product Development KPI Dashboard?
A KPI (Key Performance Indicator) Dashboard consolidates vital metrics into one visual interface. Specifically, a Retail and E-commerce Product Development KPI Dashboard focuses on the entire lifecycle of product creation—from ideation and prototyping to launch and performance evaluation. You’ll track metrics such as:
-
Time-to-Market (TTM): Measures the duration between product ideation and launch.
-
Development Cost Variance: Compares actual spending against budgeted costs.
-
Feature Completion Rate: Tracks the percentage of planned features delivered per sprint or development cycle.
-
Return on Investment (ROI): Assesses profitability relative to development and marketing expenses.
By monitoring these KPIs, your team can identify bottlenecks, reallocate resources, and drive continuous improvement. And importantly, you eliminate guesswork, since real-time data guides every decision.
Key Features of the Dashboard
Our template includes seven interlinked worksheets. Each one serves a distinct purpose, yet they all update dynamically via PivotTables and drop-down controls. Here’s a walkthrough:
Home Sheet
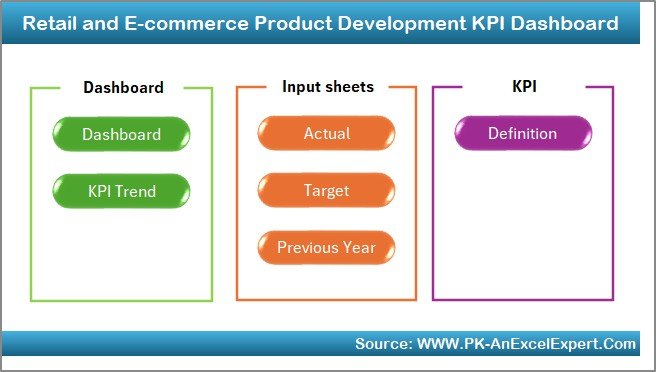
First, the Home sheet acts as a navigation hub. You’ll find six clearly labeled buttons that jump to the respective worksheets:
-
Dashboard
-
KPI Trend
-
Actual Numbers Input
-
Target
-
Previous Year Numbers
-
KPI Definition
Because of its intuitive design, you reduce friction for new users. Consequently, adoption rates rise and data entry errors fall.
Dashboard Sheet
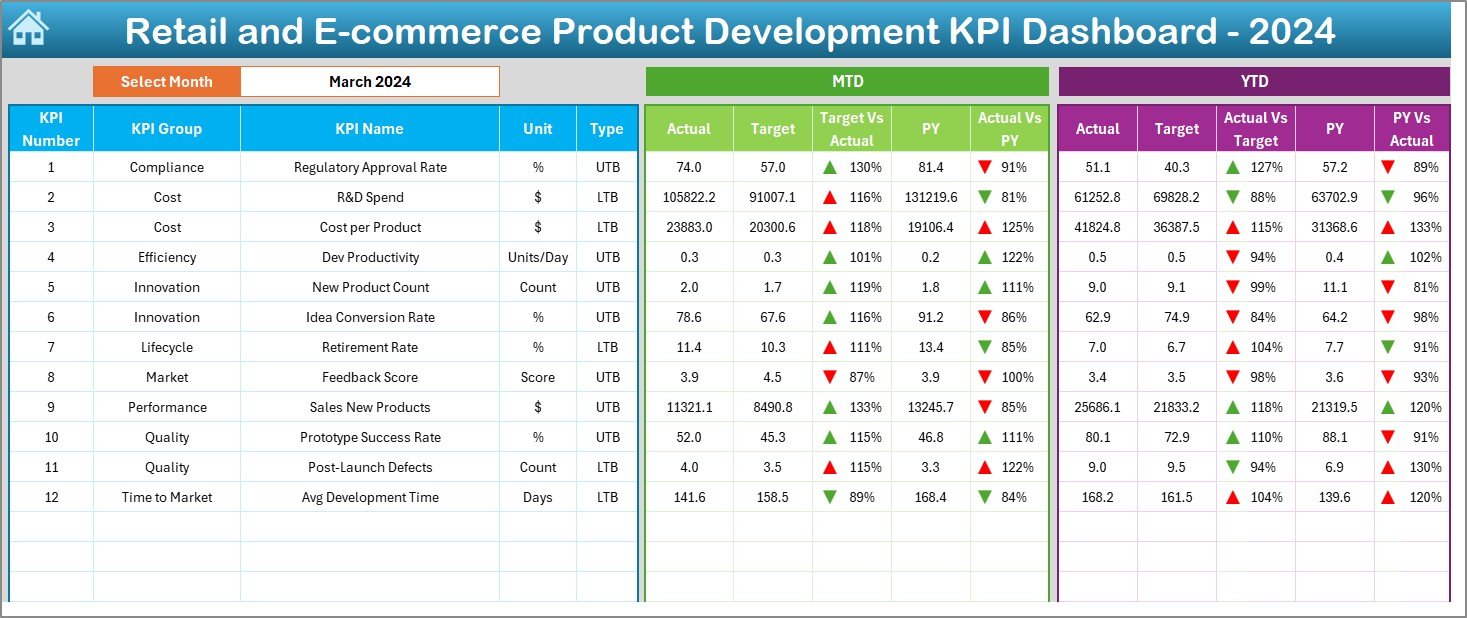
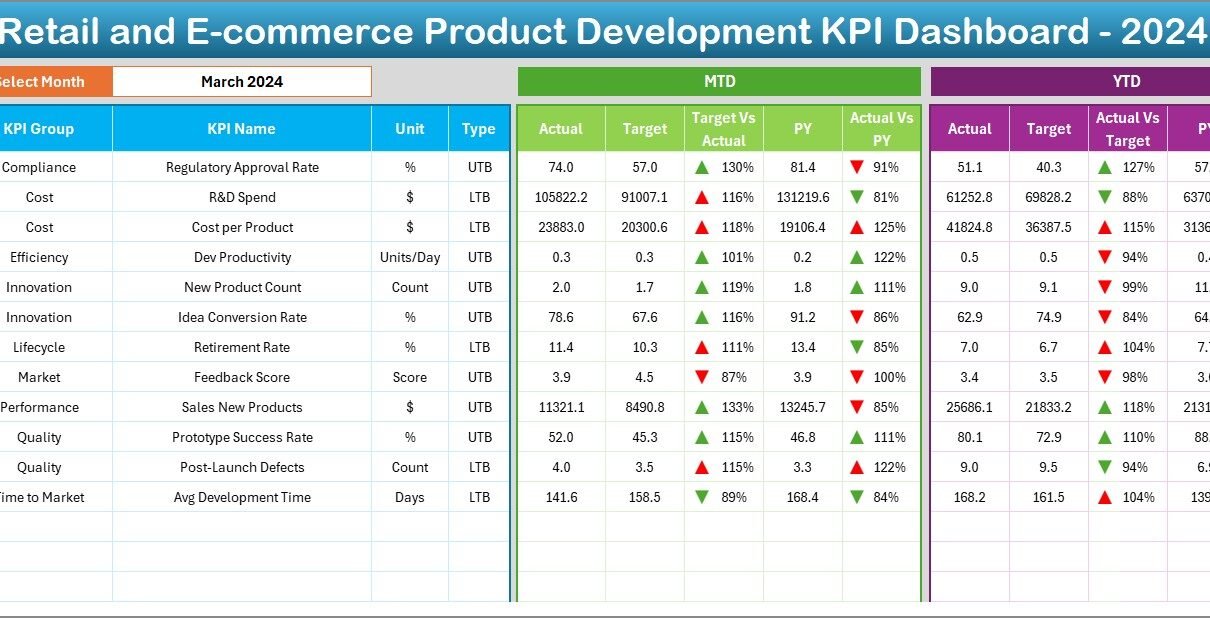
Next, the Dashboard sheet offers a snapshot of all KPIs for a selected month. Use the drop-down in cell D3 to choose any month, and the dashboard refreshes instantly. Here you see:
-
MTD Actual, Target, Previous Year: Compare current performance against goals and last year’s metrics.
-
Conditional Formatting: Up/down arrows highlight whether you exceed or lag behind targets.
-
YTD Actual, Target, Previous Year: Track cumulative performance across the fiscal year.
Since you rely solely on PivotCharts and PivotTables, you maintain full interactivity. As a result, you can slice and dice data without breaking charts.
KPI Trend Sheet
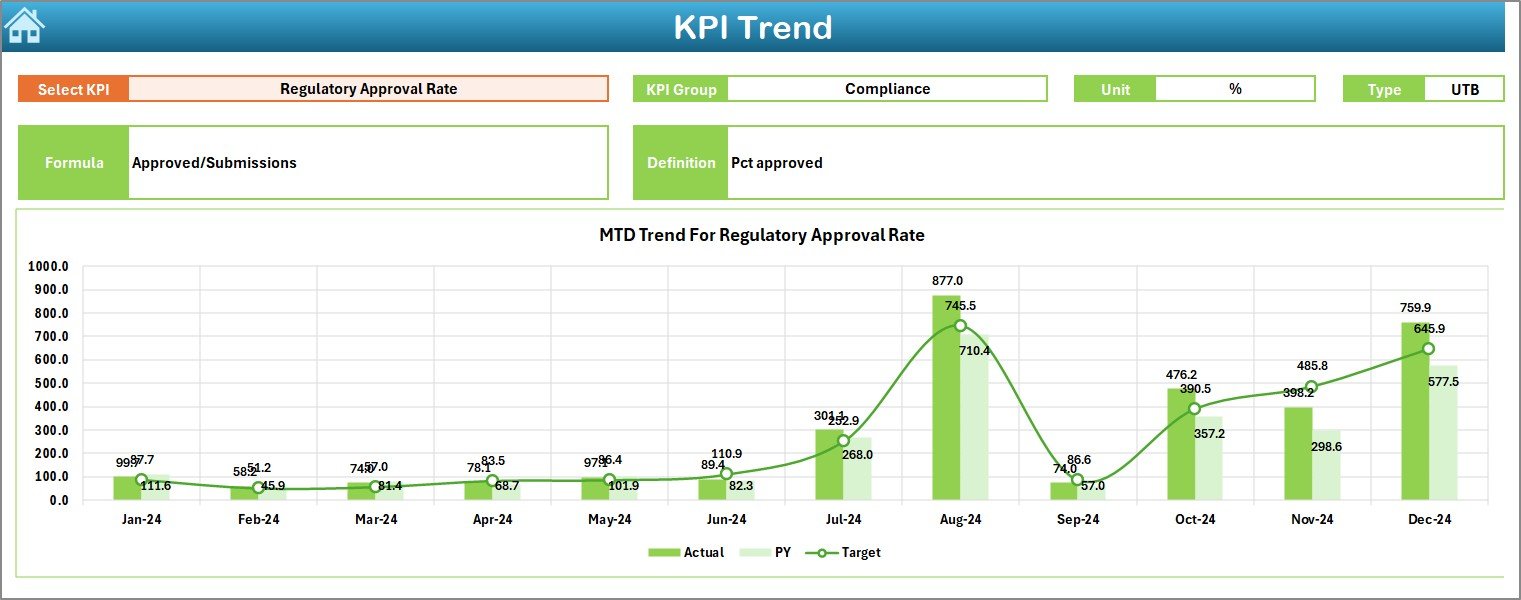
Then, the KPI Trend sheet provides deeper analysis. Select any KPI from the drop-down in cell C3, and you’ll view:
-
KPI Details: Group, unit, type (Lower the Better or Upper the Better), formula, and definition.
-
MTD Trend Chart: Visualizes monthly Actual, Target, and Previous Year data.
-
YTD Trend Chart: Shows how each measure evolves year-to-date.
By isolating one KPI, you can pinpoint seasonal patterns or development hiccups. Consequently, teams adjust sprint planning and resource allocation proactively.
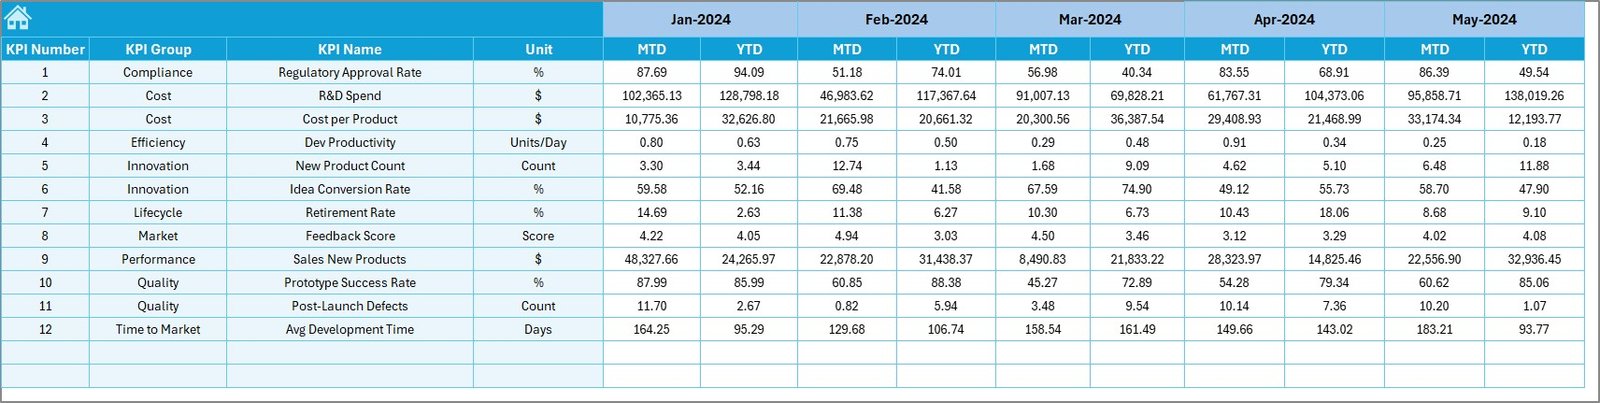
Actual Numbers Input Sheet
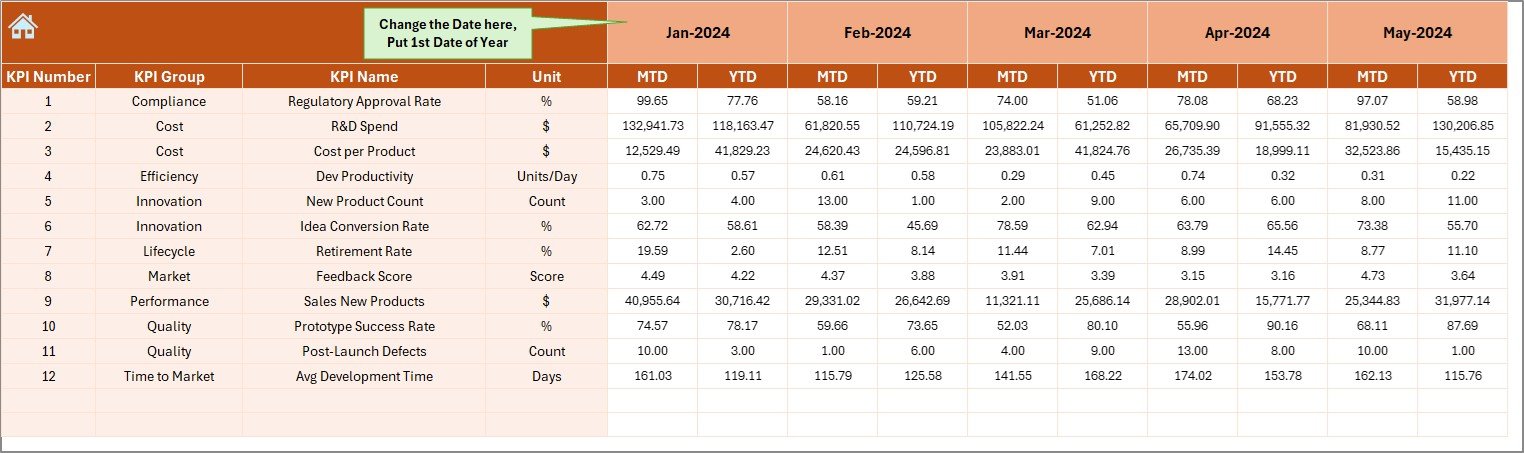
On the Actual Numbers Input sheet, you enter monthly MTD and running YTD figures. Simply change the starting month in cell E1, and your data table shifts accordingly. Because of this flexibility:
-
You update numbers in bulk.
-
You avoid manual date recalculations.
-
You maintain consistency across the workbook.
Keep your raw data accurate, and the rest of the dashboard reflects true performance.
Click to Purchases Retail and E-commerce Product Development KPI Dashboard in Excel
Target Sheet
Similarly, the Target sheet collects monthly MTD and YTD targets for each KPI. To maintain alignment:
-
Enter targets at the start of each quarter or year.
-
Adjust targets mid-year when market conditions shift.
-
Use consistent units and formatting.
By inputting targets here, you ensure the dashboard compares against the right benchmarks.
Previous Year Numbers Sheet
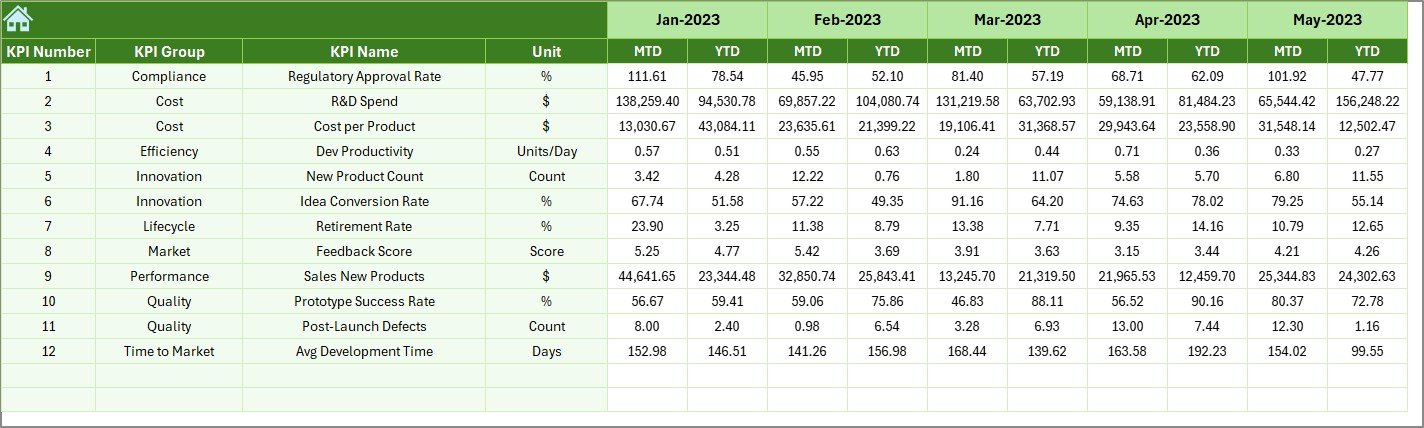
Next, input historical performance on the Previous Year Numbers sheet. Match each current KPI entry with its counterpart from the prior year. In this way, you can:
-
Evaluate year-over-year growth.
-
Identify emerging trends.
-
Recognize areas that require course correction.
Because you use the same layout as the Actual Numbers Input sheet, data entry stays simple.
KPI Definition Sheet
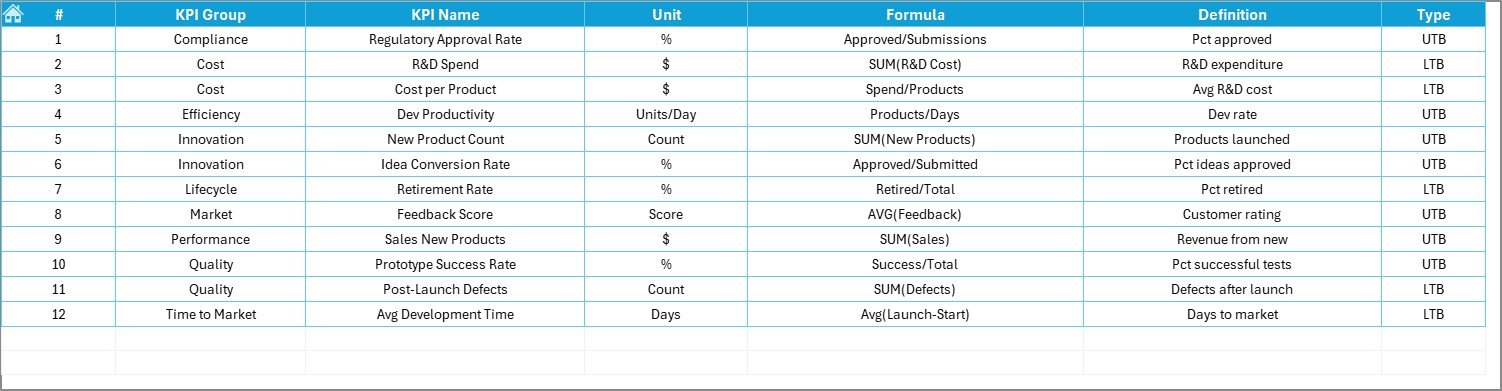
Finally, the KPI Definition sheet serves as your reference guide. Here, you list:
Advantages of Retail and E-commerce Product Development KPI Dashboard
1. Real-Time Visibility.
You no longer wait for monthly reports. Instead, you view up-to-date metrics at a glance. Since you refresh PivotTables instantly, you respond faster to market shifts.
2. Data-Driven Decisions.
Rather than rely on intuition, you leverage hard numbers. Consequently, your product development prioritizes high-impact features, optimizes budgets, and reduces time waste.
3. Cross-Functional Alignment.
Marketing, sales, finance, and development teams see the same dashboard. Therefore, they share a common data language. As a result, collaboration improves and finger-pointing drops.
4. Scalability & Flexibility.
Within Excel’s familiar environment, you add new KPIs easily. Furthermore, you extend the dashboard to track customer feedback scores, defect rates, or supplier performance.
5. Low Cost & High ROI.
Most organizations already have licenses for Microsoft 365. Hence, you avoid extra BI tool investments. Ultimately, you achieve a solid return on minimal incremental effort.
How to Use the Dashboard Effectively
-
Set Clear KPI Definitions.
-
Confirm that every metric has a unique formula.
-
Standardize units (e.g., days, dollars, percent).
-
Document definitions to avoid disputes.
-
-
Enter Data Promptly.
-
Update the Actual, Target, and Previous Year sheets at least monthly.
-
Assign ownership to individuals or teams.
-
Use data-validation drop-downs to reduce entry errors.
-
-
Review Trends Weekly.
-
Use the KPI Trend sheet to spot deviations quickly.
-
Investigate any KPI that crosses thresholds (e.g., TTM spikes above 30 days).
-
Adjust sprint goals or resource allocation accordingly.
-
-
Communicate Insights.
-
Share dashboard snapshots in team meetings.
-
Highlight top-performing and underperforming KPIs.
-
Celebrate successes and plan corrective actions collaboratively.
-
-
Iterate & Improve.
-
Periodically revisit KPI relevance.
-
Add or retire metrics as business needs evolve.
-
Solicit feedback from dashboard users for enhancements.
-
Click to Purchases Retail and E-commerce Product Development KPI Dashboard in Excel
-
Best Practices for the Retail and E-commerce Product Development KPI Dashboard
-
Maintain Data Integrity: Use data-validation rules for dates and numeric fields. Consequently, you prevent typos that skew your analysis.
-
Document Changes: Log any formula updates or new KPI additions in a change log tab. Thus, you preserve historical context and ensure auditability.
-
Leverage Named Ranges: Define named ranges for tables and drop-down lists. As a result, formulas become more readable, and workbook maintenance simplifies.
-
Protect Critical Sheets: Lock formula cells on Dashboard and KPI Trend sheets to prevent accidental edits. Meanwhile, leave data-entry sheets unlocked for responsible users.
-
Use Consistent Formatting: Apply uniform number formats, font sizes, and color schemes. Therefore, you create a professional look and avoid confusion.
-
Back Up Regularly: Even though Excel files auto-save in OneDrive or SharePoint, schedule weekly backups. Hence, you mitigate data loss risks.
-
Train Your Team: Conduct short training sessions on dashboard usage. Furthermore, distribute a one-page quick reference guide for common tasks.
Frequently Asked Questions
1. Why should I use Excel for my KPI dashboard instead of a BI tool?
Excel offers a low-cost, highly flexible platform that most organizations already license. Moreover, Excel’s PivotTable and charting capabilities meet the needs of many small to midsize teams. However, if you require real-time data connections or advanced analytics, then a dedicated BI tool might make sense.
2. How often should I update my KPI dashboard?
Update monthly at a minimum. Nevertheless, top-performing teams refresh critical KPIs weekly or even daily for time-sensitive metrics. Ultimately, determine your update cadence based on business rhythm and stakeholder expectations.
3. Can I add more KPIs to this template?
Absolutely. Simply append rows on the KPI Definition, Actual Numbers Input, Target, and Previous Year sheets. Then, refresh PivotTables and adjust drop-down lists to include the new entries.
4. How do conditional formatting arrows work?
We use Excel’s built-in icon sets on the Dashboard sheet. Whenever Actual vs. Target or Actual vs. Previous Year meets certain thresholds, arrows indicate performance direction. You can customize these rules via Home → Conditional Formatting → Icon Sets.
5. What if I enter incorrect data?
Use Data → Data Validation to restrict entries (e.g., allow only whole numbers, dates between specific ranges, or drop-down selections). Moreover, lock the dashboard’s formula cells to prevent inadvertent overrides.
6. How do I change the fiscal year start month?
On the Actual Numbers Input sheet, modify the month in cell E1 to the first month of your fiscal year (e.g., “Apr-2024”). The dynamic date formulas update subsequent columns automatically.
7. Can I share this dashboard with colleagues?
Yes. Save the workbook on a shared network drive, OneDrive, or SharePoint. Then, set appropriate access permissions so team members can edit data but cannot alter dashboard formulas.
8. What are common pitfalls when implementing a KPI dashboard?
-
Lack of ownership for data entry.
-
Overloading the dashboard with too many KPIs.
-
Ignoring data validation and error checking.
-
Failing to train end users on navigation and interpretation.
Avoid these by establishing clear processes and governance up front.
Conclusion
A Retail and E-commerce Product Development KPI Dashboard in Excel transforms how you track product initiatives. By consolidating all critical metrics into one user-friendly file, you eliminate manual reporting, reduce errors, and enable data-driven decisions. Furthermore, Excel’s PivotTables and conditional formatting empower you to analyze performance trends, identify risks, and celebrate successes—faster than ever before.
Visit our YouTube channel to learn step-by-step video tutorials