In today’s fast-paced retail and e-commerce environment, stakeholders demand clear, timely insights into performance metrics. Consequently, companies must equip themselves with robust reporting tools that present critical data at a glance. Moreover, an Excel-based Stakeholder Reporting KPI Dashboard offers a flexible, cost-effective solution that brings together multiple data sources on one interactive platform. By leveraging such a dashboard, teams can make data-driven decisions, align on strategic priorities, and ultimately drive revenue growth.
In this comprehensive guide, you’ll discover:
-
What a Retail and E-commerce Stakeholder Reporting KPI Dashboard in Excel is
-
How each of the seven worksheet tabs functions
-
The advantages of using this dashboard
-
Best practices for implementation and maintenance
-
Frequently asked questions to address common concerns
Let’s dive in and explore how you can harness the full power of Excel to keep stakeholders informed and engaged.
Click to Purchases Retail and E-commerce Stakeholder Reporting KPI Dashboard in Excel
What Is a Retail and E-commerce Stakeholder Reporting KPI Dashboard in Excel?
A Retail and E-commerce Stakeholder Reporting KPI Dashboard in Excel is a ready-to-use template designed to consolidate key performance indicators (KPIs) related to sales, marketing, inventory, and customer engagement. First and foremost, it centralizes data in one file, meaning teams no longer juggle multiple spreadsheets or static reports. Instead, they interact with dynamic charts, slicers, and tables that update at the click of a button.
Furthermore, since the solution lives in Excel, it benefits from familiar features—such as drop-down lists, conditional formatting, and pivot charts—allowing rapid adoption without extensive training. As a result, stakeholders gain a real-time view of trends, month-to-date (MTD) progress, year-to-date (YTD) performance, and previous-year comparisons.
How Does the Dashboard Work?
Home Sheet
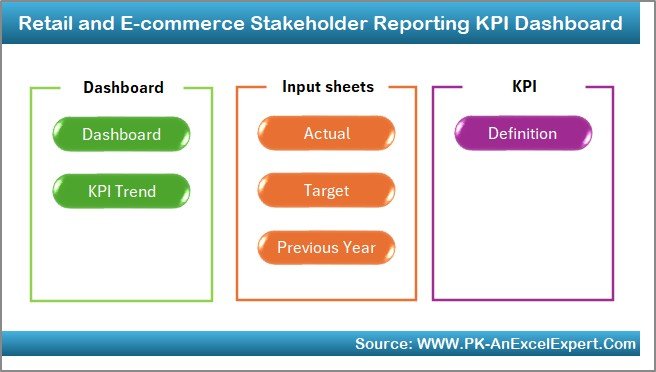
On the Home sheet, you’ll find a clean index with six clickable buttons. Each button jumps to a specific worksheet, enabling users to navigate quickly. Therefore, whether a stakeholder needs to review trends, input data, or examine definitions, they can do so without scrolling or searching.
Key elements:
-
Six buttons for one-click navigation
-
Dashboard overview text and instructions
-
Company logo placeholder for branding
Dashboard Sheet Tab
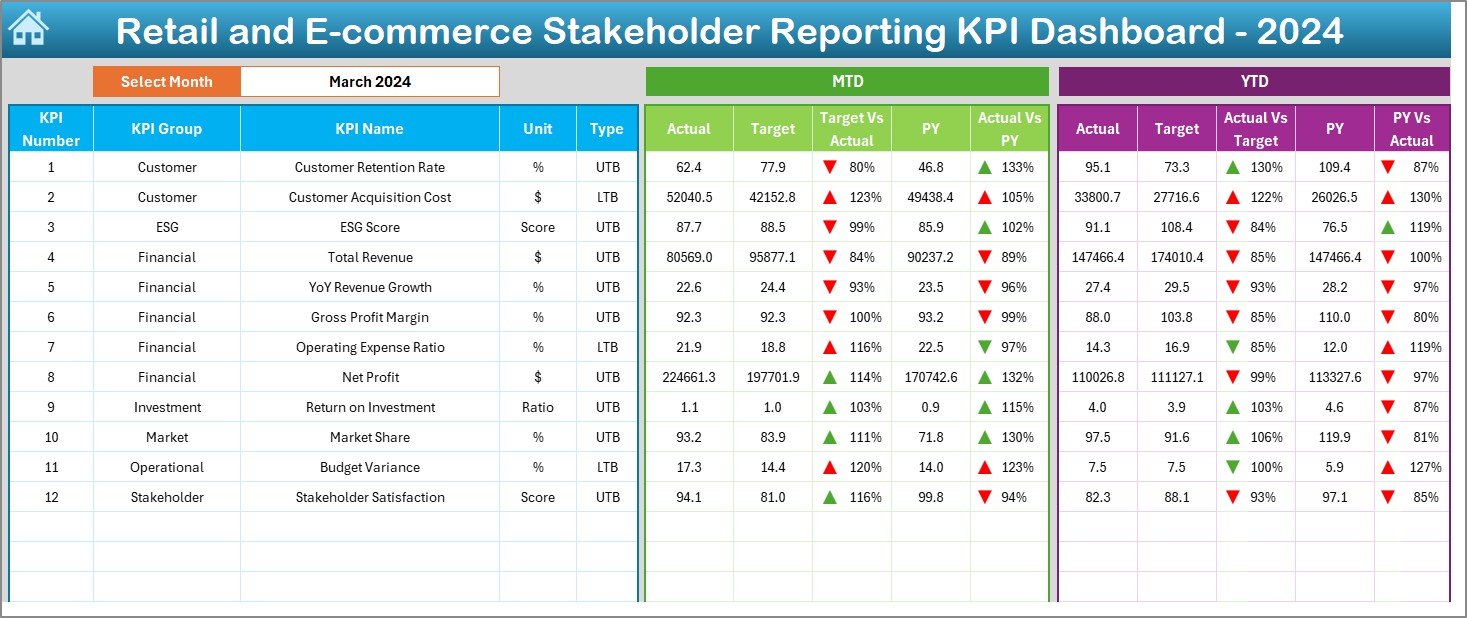
Next, the Dashboard tab serves as the command center. At the top, a drop-down in cell D3 lets you select the month you want to analyze. Immediately, all MTD and YTD values, as well as previous-year (PY) comparisons, update automatically.
Highlights include:
-
MTD Actual vs. Target chart with up/down arrow conditional formatting
-
MTD Actual vs. PY comparison with color indicators
-
YTD Actual vs. Target table and charts
-
YTD Actual vs. PY trendlines
By using pivot charts, you maintain the ability to slice data by category, region, or product line—without breaking the dashboard’s structure.
KPI Trend Sheet Tab
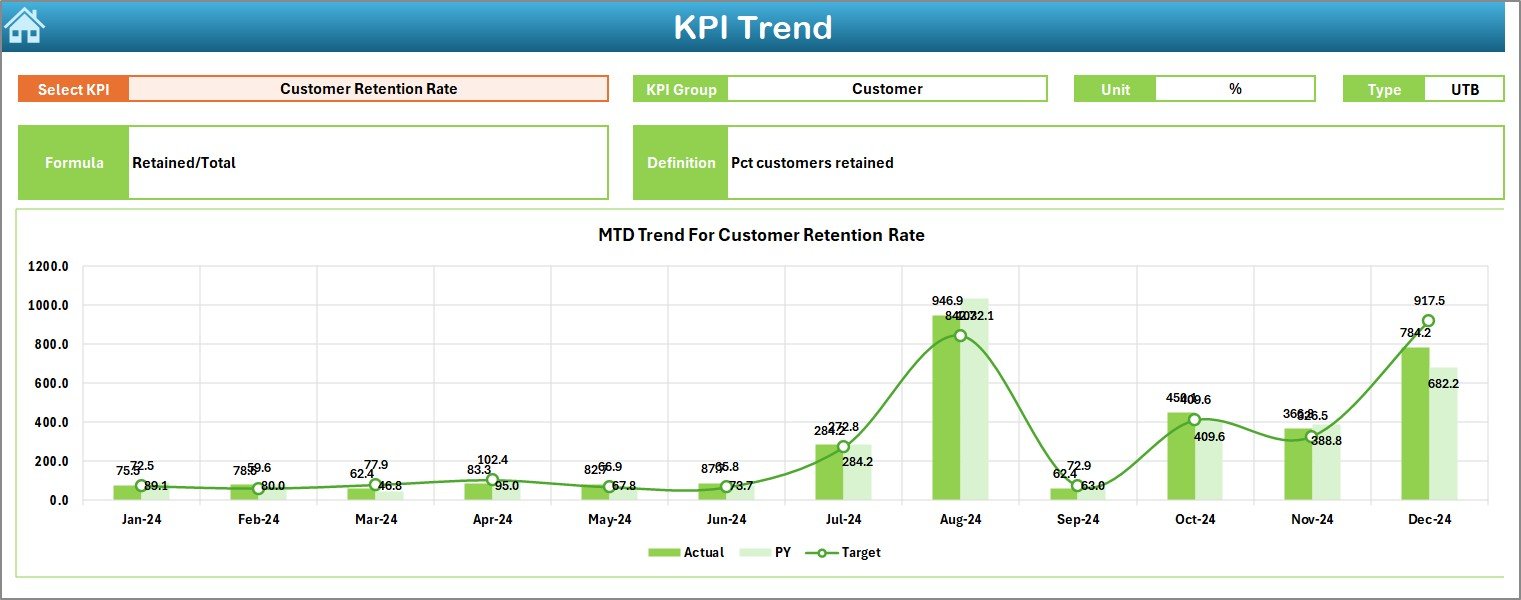
On the KPI Trend sheet, users select a specific KPI from a drop-down in cell C3. Immediately, the sheet displays:
-
KPI Group
-
Unit of measure (e.g., USD, units, %)
-
KPI type: LTB (Lower the Better) or UTB (Upper the Better)
-
Formula used to calculate the KPI
-
Short definition
Below these details, the sheet features side-by-side MTD and YTD trend charts—showing actual, target, and PY values over time. This granular view helps stakeholders spot emerging issues or positive trends early.
Click to Purchases Retail and E-commerce Stakeholder Reporting KPI Dashboard in Excel
Actual Numbers Input Sheet
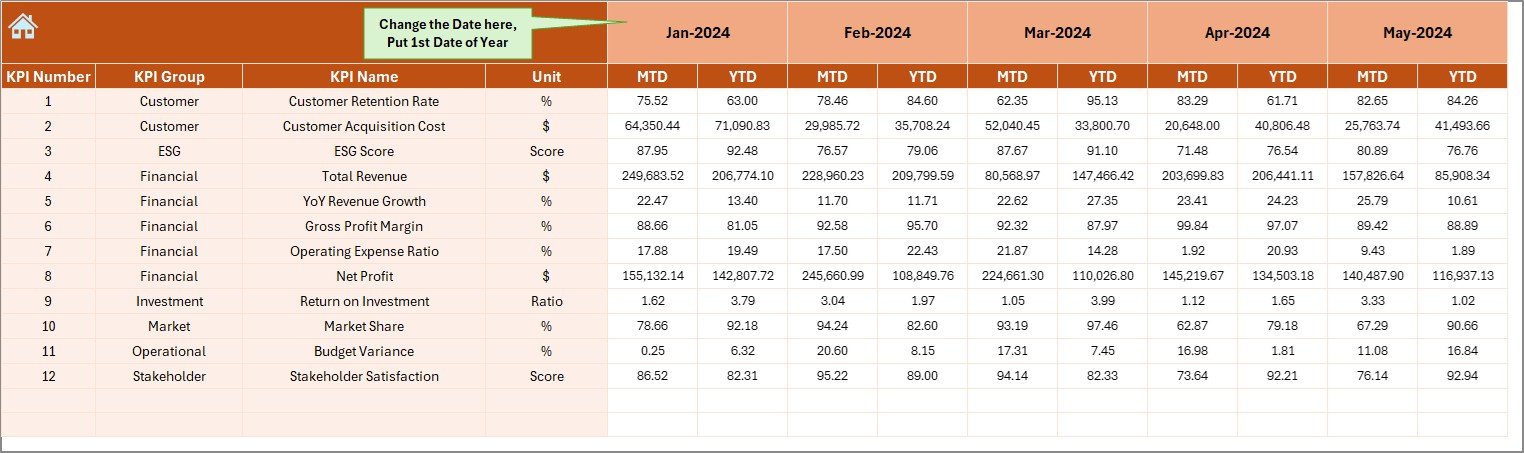
Then, the Actual Numbers Input sheet acts as your data-entry portal. In cell E1, enter the first month of the fiscal year (e.g., “Jan-2025”). The sheet automatically populates subsequent months in header labels. Simply key in the actual MTD and YTD figures for each KPI.
Benefits:
-
Streamlined data entry in a structured table
-
Automatic cascading of month labels
-
Input validation to prevent data entry errors
Target Sheet Tab
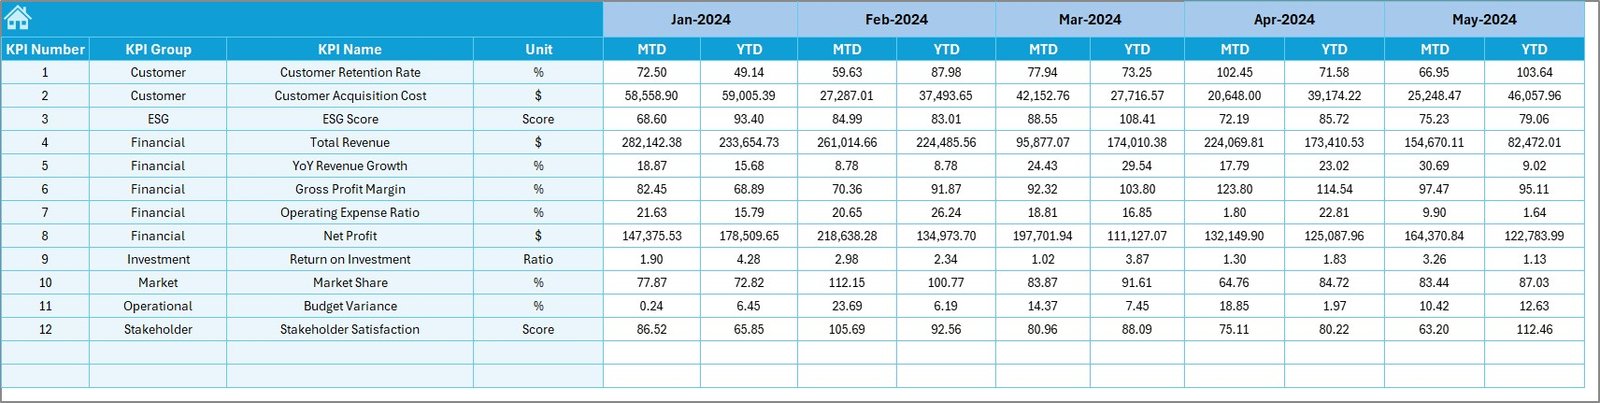
Similarly, the Target sheet mirrors the structure of the Actual Numbers Input sheet. Here, you enter monthly MTD and YTD target values for each KPI. Consequently, the system can calculate variances and display performance against goal directly on the Dashboard tab.
Previous Year Number Sheet Tab
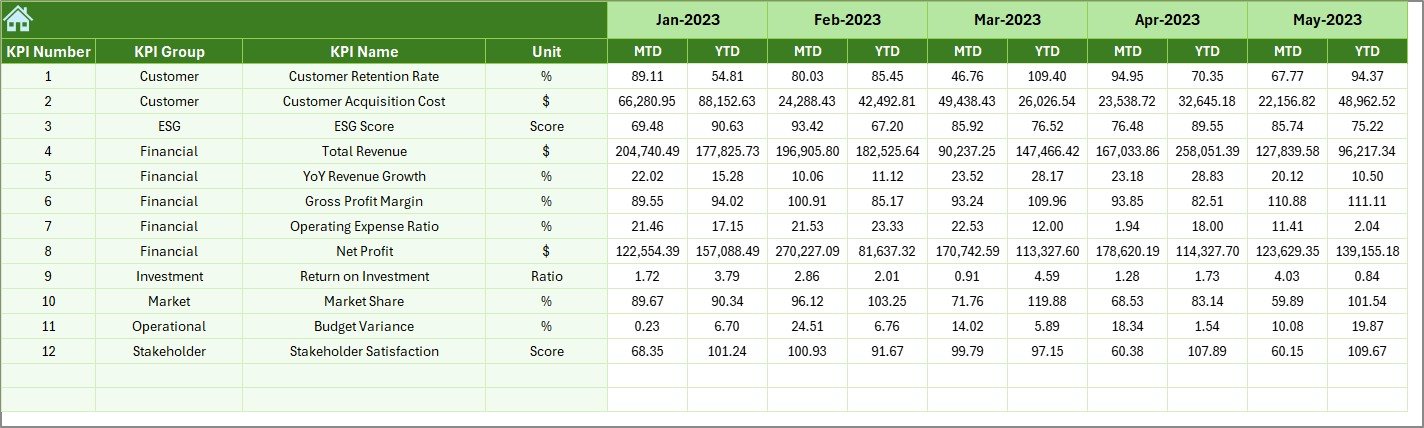
Equally important, the Previous Year Number sheet lets you upload historical data from the prior year. By entering MTD and YTD values for each month, the dashboard can draw direct comparisons, making it easy to assess growth or identify seasonal fluctuations.
KPI Definition Sheet Tab
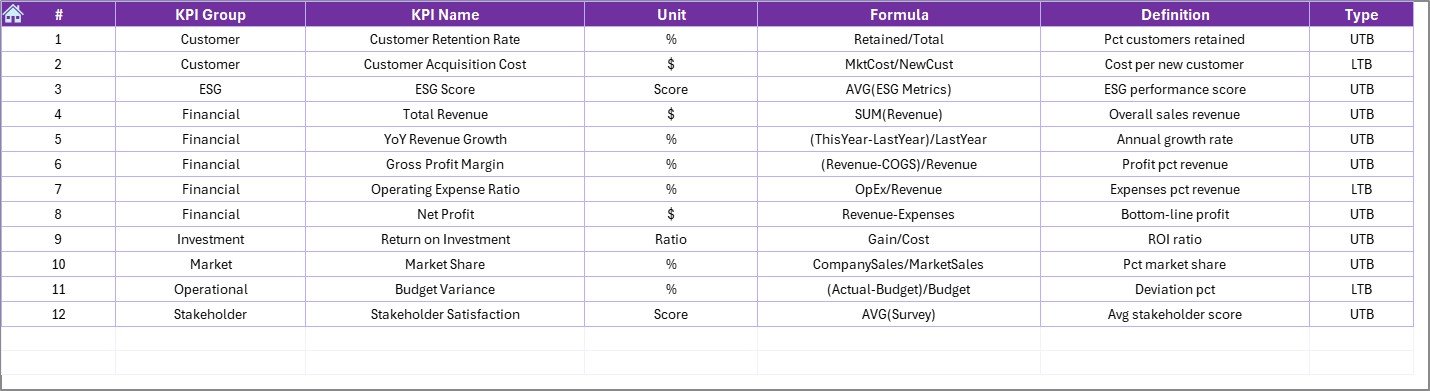
Finally, the KPI Definition sheet houses the master list of KPIs. In a neatly formatted table, you document:
-
KPI Name
-
KPI Group (e.g., Sales, Marketing, Operations)
-
Unit of measure
-
Formula (kept concise)
-
Definition (clear, under 70 characters)
By centralizing definitions, you ensure everyone interprets metrics consistently.
Advantages of a Retail and E-commerce Stakeholder Reporting KPI Dashboard in Excel
-
Cost Efficiency
Creating this dashboard in Excel costs far less than investing in specialized BI tools. Moreover, most organizations already possess an Office 365 license, so there’s no additional software expense. -
Rapid Deployment
Because the template is fully built, you can deploy it within hours. As a result, stakeholders begin receiving insights almost immediately. -
Flexibility and Customization
Excel’s inherent flexibility allows you to add new KPIs, adjust formulas, or rebrand dashboards with your company’s colors and logos. Consequently, the dashboard evolves alongside your business. -
Familiar Interface
Teams require minimal training since they already know Excel basics. Therefore, data entry errors decrease, and adoption rates rise. -
Interactive Analysis
Pivot charts and slicers empower users to explore data without altering source tables. Ultimately, stakeholders self-serve their analytics needs. -
Consistent Definitions
By housing all KPI formulas and definitions in one place, you maintain alignment across departments—avoiding confusion over what a “conversion rate” or “average order value” truly means. -
Historical Comparisons
With built-in PY data, you can quickly assess growth patterns, seasonal shifts, and long-term trends without manual data consolidation.
Best Practices for the Retail and E-commerce Stakeholder Reporting KPI Dashboard in Excel
-
Automate Data Refresh
Whenever possible, connect your actual, target, and PY data sheets to external data sources (via Power Query or macros). Thus, you minimize manual entry and ensure timely updates. -
Maintain a Single Data Entry Point
Restrict editing to the Actual Numbers Input, Target, and PY sheets. Lock all other sheets to prevent accidental changes to formulas or formatting. -
Use Clear Naming Conventions
Name your tables (e.g.,tblActual,tblTargets) and ranges consistently. Consequently, any future expansions or modifications become straightforward. -
Apply Data Validation
Set up drop-down lists for month selection and KPI names. In addition, restrict numeric fields to valid ranges to avoid invalid entries. -
Optimize Performance
If your dataset grows—say, exceeding 1,000 rows per sheet—consider turning off automatic calculation when updating in bulk. Then, switch back to automatic calculation to recalculate once data entry finishes. -
Implement Conditional Formatting Judiciously
Use up/down arrows and color scales on the Dashboard tab to highlight key variances. However, avoid overloading users with too many colors or icons that could distract rather than inform. -
Document Changes and Version Control
Keep a “Changelog” sheet where you note every dashboard update—such as added KPIs or formula tweaks. Moreover, save dated versions (e.g.,StakeholderDashboard_2025-06-23.xlsx) to track evolution and enable rollbacks if needed. -
Train Stakeholders Briefly
Host a 15-minute walkthrough demonstrating navigation, data entry, and how to interpret charts. Since Excel interfaces feel familiar, this quick session ensures everyone uses the dashboard confidently. -
Review Quarterly
At least once every quarter, audit your KPIs: remove metrics that no longer align with strategy, and add new ones as business needs change. -
Back Up Regularly
Store the dashboard on a secure shared drive or cloud repository (e.g., SharePoint, OneDrive) with version history enabled.
How Do You Customize KPIs for Your Business?
To tailor this template:
-
Identify Core Stakeholders
Interview department heads—sales, marketing, operations—to understand which KPIs they rely on. -
Select Relevant KPI Groups
From the master list on the KPI Definition sheet, choose groups that matter most (e.g., Customer Experience, Logistics, Finance). -
Add or Remove KPIs
If you need a new metric—say, “Net Promoter Score”—insert a row in the KPI Definition sheet, then update the input sheets accordingly. -
Adjust Units and Formulas
Use simple formulas in the Definition sheet (e.g.,=Sales/Ordersfor average order value) and ensure the Unit column reflects the correct symbol (%, $, or unit count). -
Test for Accuracy
After customization, enter sample data and verify that pivot charts update correctly.
When Should You Upgrade to a BI Platform?
While Excel offers tremendous flexibility, at some point you might outgrow it. Consider migrating to a dedicated BI tool (Power BI, Tableau) when:
-
Your data volume exceeds Excel’s limits (≈1 million rows).
-
You require real-time connectivity to cloud databases.
-
You need advanced analytics (predictive modeling, AI-driven insights).
However, for many small-to-mid-sized retailers, an Excel dashboard strikes the perfect balance of power, cost, and familiarity.
Conclusion
Click to Purchases Retail and E-commerce Stakeholder Reporting KPI Dashboard in Excel
In summary, a Retail and E-commerce Stakeholder Reporting KPI Dashboard in Excel empowers teams to monitor critical metrics, compare performance month-to-month and year-over-year, and maintain alignment across departments. By following best practices—such as automating data refreshes, applying data validation, and documenting changes—you ensure the dashboard remains accurate, reliable, and easy to use.
Ultimately, whether you are a small online retailer or a large omnichannel enterprise, this Excel template provides the visibility and control needed to drive growth, optimize operations, and satisfy stakeholders.
Frequently Asked Questions (FAQs)
Q1: How easy is it to update KPI formulas in the dashboard?
You can update formulas directly on the KPI Definition sheet. Since all pivot charts reference this sheet via named tables, changes reflect automatically—no further dashboard edits required.
Q2: Can I connect this Excel dashboard to my ERP system?
Yes. Use Power Query to pull data directly from your ERP’s database or CSV exports. Then, map your query output to the Actual, Target, and PY sheets.
Q3: How do I add a new KPI to the dashboard?
-
Insert a new row in the KPI Definition sheet.
-
Fill in the KPI Name, Group, Unit, Formula, and Definition.
-
Extend the tables on the Actual, Target, and PY sheets to include the new row.
-
Refresh all pivots.
Q4: What if I need more than one year of historical data?
You can duplicate the Previous Year Number sheet and rename it “PY_2023” and “PY_2024.” Then, adjust your pivot caches to pull from all historical sheets, or consolidate them into a single “Historical” sheet with a Year column.
Q5: How do I share this dashboard with non-Excel users?
Export key charts or entire sheets to PDF for easy distribution. Alternatively, upload the Excel file to SharePoint or OneDrive and grant view-only access.
Q6: Is this dashboard mobile-friendly?
While Excel’s desktop version offers the richest interactivity, you can view charts and tables on Excel for iPad or Android tablets. However, complex slicer interactions may be limited on mobile.
Q7: How often should I refresh the data?
For most retail teams, a weekly refresh suffices. Yet, if you have daily sales targets or real-time inventory needs, schedule daily updates—either manually or via a VBA macro.
Visit our YouTube channel to learn step-by-step video tutorials
Click to Purchases Retail and E-commerce Stakeholder Reporting KPI Dashboard in Excel