Retail and e-commerce businesses thrive on data-driven decisions. Moreover, organizations that invest in training and development amplify their teams’ capabilities, leading to improved customer experiences and stronger revenue growth. Consequently, measuring the right metrics becomes vital. The Retail and E-commerce Training and Development KPI Dashboard in Excel offers a ready-to-use template that empowers managers to track, analyze, and act on critical performance indicators. In this article, you’ll discover how this dashboard accelerates insights, boosts accountability, and fosters continuous improvement.
Click to Purchases Retail and E-commerce Training and Development KPI Dashboard in Excel
What Is the Retail and E-commerce Training and Development KPI Dashboard in Excel?
We designed this dashboard to centralize all training-related KPIs in a single Excel workbook. Rather than toggling among multiple files, you’ll access seven intuitive worksheets that guide you through:
Home sheet
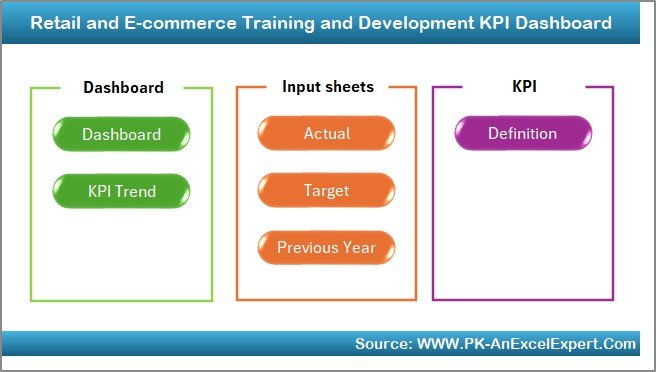
- Six clickable buttons navigate you instantly to key sections.
- You maintain focus and save time.
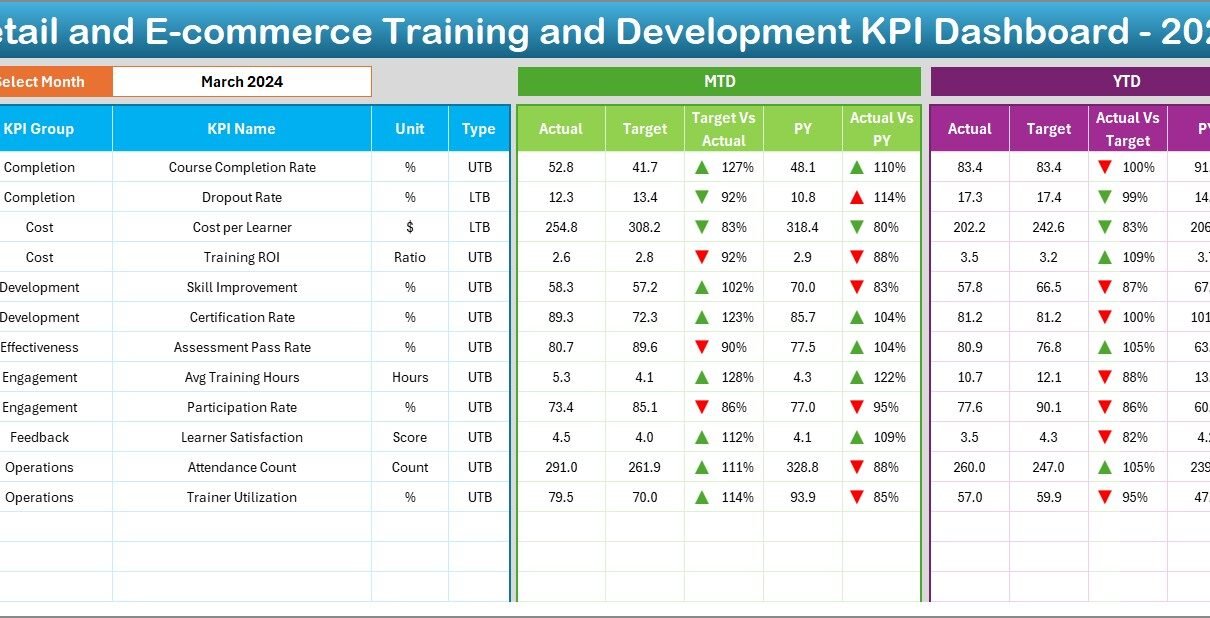
Dashboard sheet
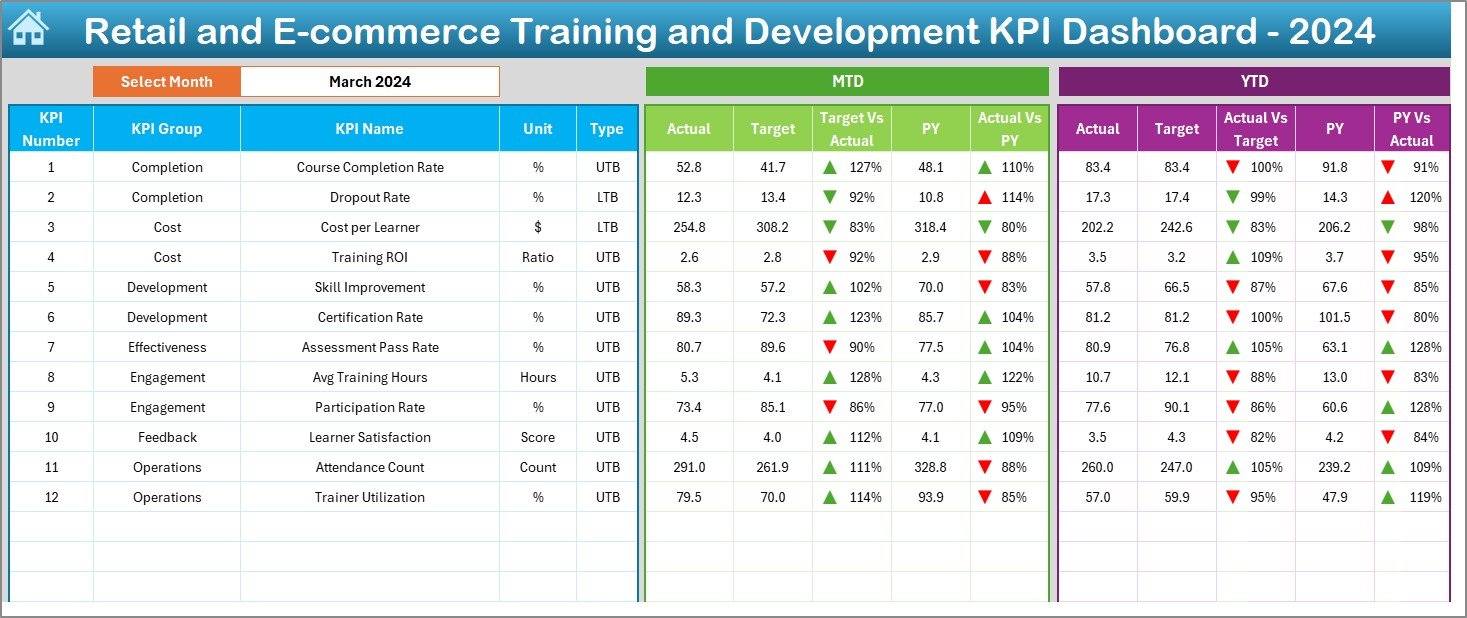
- You select any month via a drop-down (cell D3).
- Excel dynamically updates MTD and YTD figures for Actual, Target, and Previous Year.
- Conditional formatting arrows signal positive or negative variances at a glance.
Click to Purchases Retail and E-commerce Training and Development KPI Dashboard in Excel
KPI Trend sheet
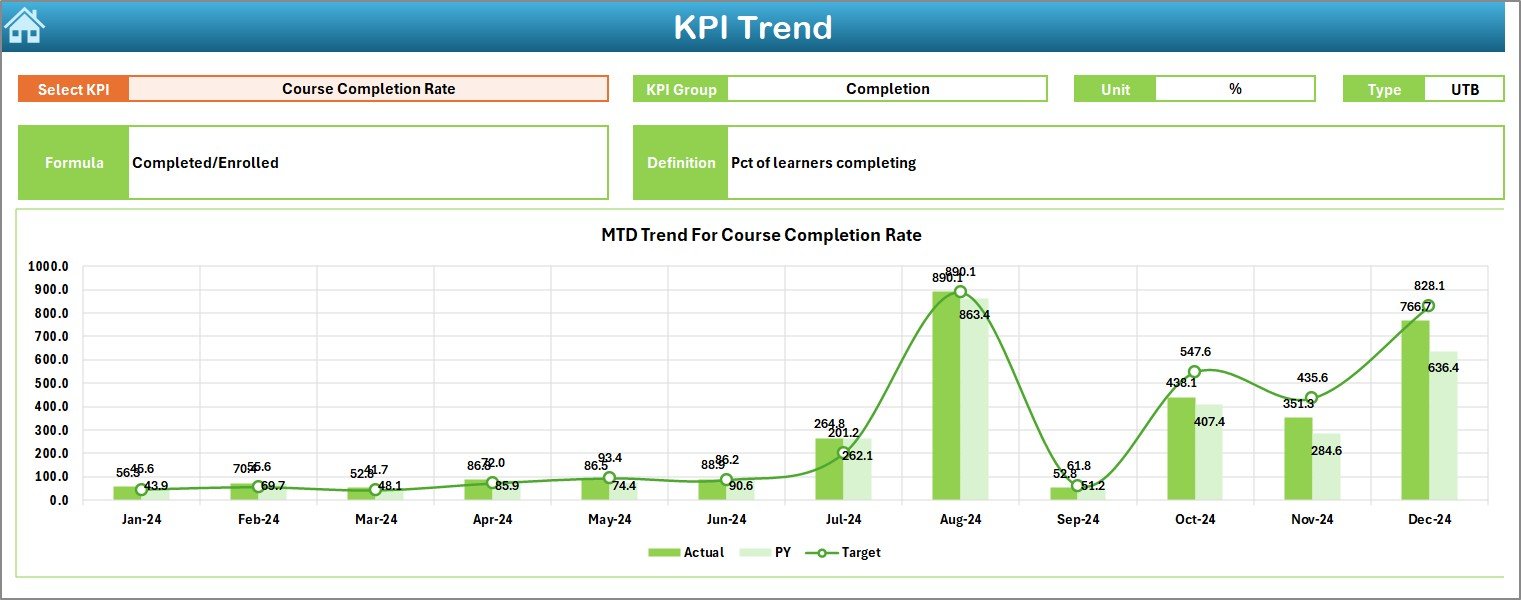
- A drop-down (cell C3) lets you choose any KPI.
- You view grouping, unit, formula, and definition for clarity.
- Line charts plot MTD and YTD trends for Actual, Target, and PY with color distinction.
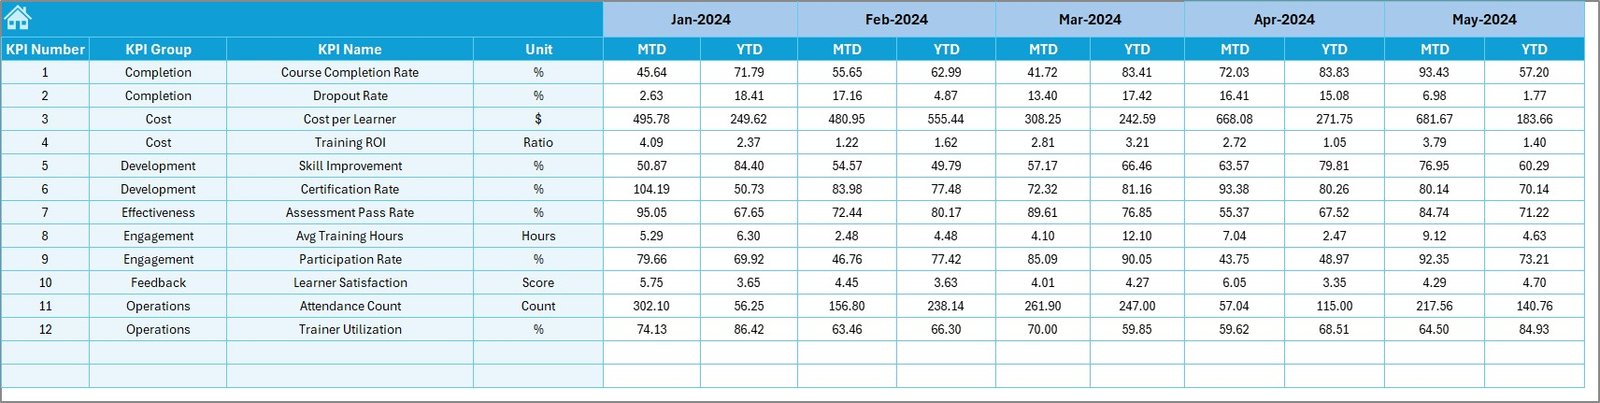
Actual Numbers Input sheet
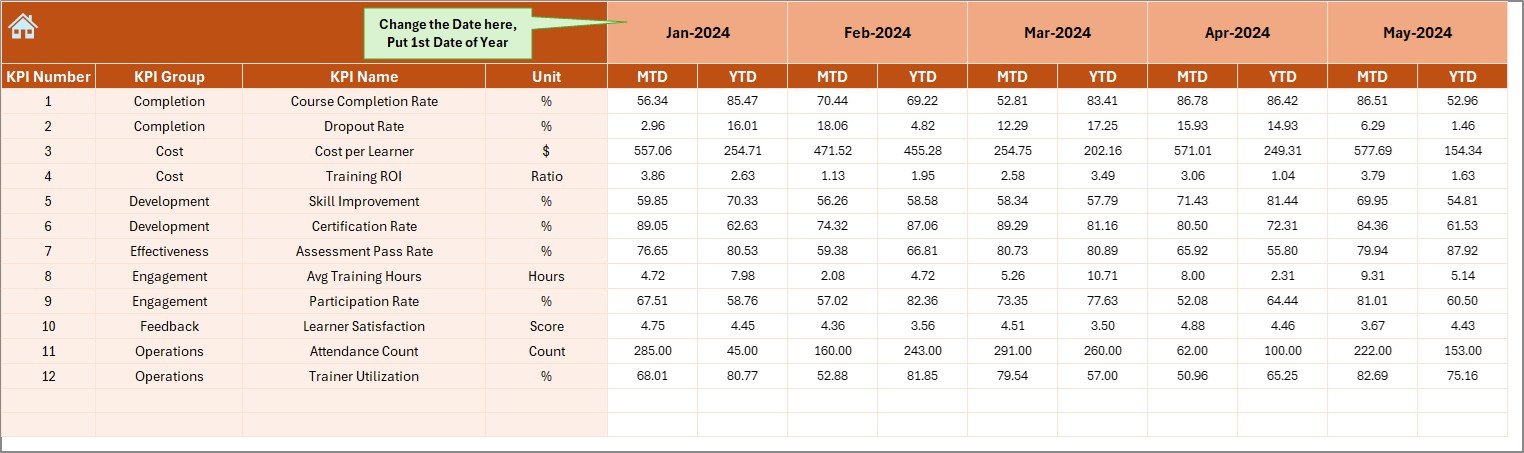
- You enter first-month date in cell E1, then plug in each month’s MTD and YTD Actual values.
- You automate cascading date changes for streamlined data entry.
Target sheet
- You input each KPI’s MTD and YTD Target figures by month.
- In addition, monthly targets automatically roll up to YTD totals.
Previous Year Number sheet
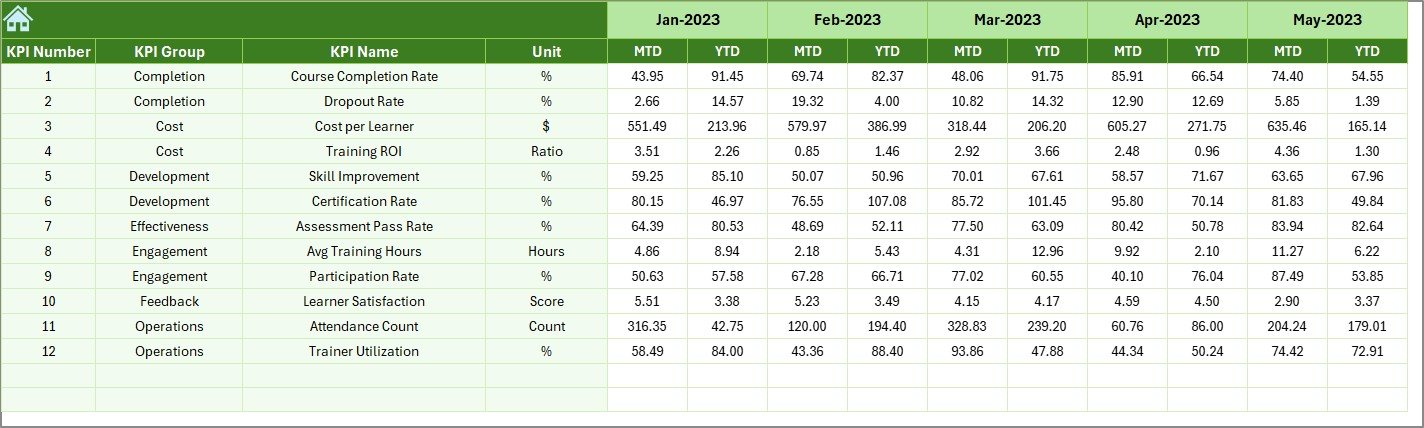
- You enter last year’s monthly MTD and YTD Actual values.
- Therefore, the dashboard provides apples-to-apples yearly comparisons.
KPI Definition sheet
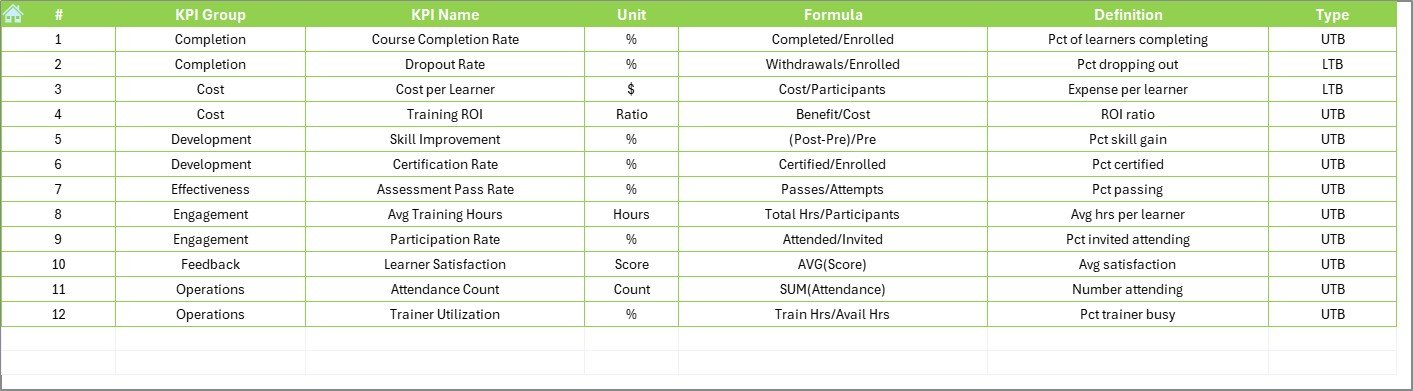
- You define each KPI’s name, group, unit, formula, and concise description.
- This reference ensures uniform understanding across teams.
Throughout this workbook, we leverage Excel’s built-in drop-down lists, conditional formatting, and pivot-like formulas to maintain simplicity yet deliver robust analysis.
Key Features at a Glance
-
Interactive Navigation
You move seamlessly between sheets using macros or hyperlinks. -
Dynamic Monthly Selection
Changing one cell refreshes the entire Dashboard view for any month. -
Variance Analysis
MTD vs. Target, PY vs. Actual, and YTD vs. Target variances appear with clear up/down arrows. -
Trend Visualization
Line charts update automatically based on your selections—no manual chart edits needed. -
Self-documenting Definitions
KPI names, formulas, and definitions live alongside your data for full transparency. -
Scalable Structure
You can add new KPIs by extending the KPI Definition sheet; all downstream reports adapt accordingly. -
Error-proof Data Entry
Drop-downs and input validation prevent typos and ensure data consistency.
Why This Dashboard Matters
-
Accelerate Decision-Making
You eliminate time spent gathering disparate reports. Instead, you focus on interpreting results. -
Align Training Efforts
With clear KPI definitions, trainers and managers operate on the same page. -
Drive Accountability
Stakeholders see real-time progress toward targets, motivating timely interventions. -
Improve ROI on Training
By linking training metrics to performance, you pinpoint high-impact programs and reallocate resources effectively. -
Foster Continuous Learning
Trend charts highlight recurring gaps and success stories, guiding future curriculum development.
Advantages of the Retail and E-commerce Training and Development KPI Dashboard
1. Consolidated Insights
You keep all metrics—Actuals, Targets, and historical data—within one Excel file. Consequently, you no longer juggle multiple spreadsheets or manual PowerPoint updates.
2. Customizable Structure
You tweak formulas, add new KPIs, or modify thresholds without coding. Therefore, this dashboard adapts to evolving business needs.
3. Instant Visual Feedback
Conditional formatting and drop-down-driven charts update immediately. Thus, you identify trends and risks in seconds.
4. User-Friendly Interface
Non-technical users navigate via buttons and drop-downs. Accordingly, training, HR, and operations teams adopt it quickly.
5. Cost-Effective Solution
You leverage existing Excel licenses without investing in expensive BI platforms. As a result, small to mid-sized businesses gain enterprise-grade insights on a budget.
6. Improved Data Accuracy
Input controls and clear definitions reduce errors. Hence, you trust the numbers you see.
7. Scalable Over Time
Start with core KPIs, then add advanced metrics—such as Training Cost per Employee or Certification Completion Rate—as your program matures.
How to Use the Dashboard Step-by-Step
Click to Purchases Retail and E-commerce Training and Development KPI Dashboard in Excel
-
Set Up Date Parameters
-
In the Actual Numbers Input sheet, enter the first month of your fiscal year in cell E1 (e.g., “Jan-2025”).
-
Excel auto-fills subsequent months throughout all input sheets.
-
-
Populate KPI Definitions
-
Go to KPI Definition.
-
For each KPI, enter:
-
KPI Name (e.g., “New Hire Completion Rate”)
-
KPI Group (e.g., “Onboarding”)
-
Unit (e.g., “%”)
-
Formula (e.g.,
Completed Trainings / Total New Hires) -
Definition (short, clear explanation)
-
-
-
Enter Actual Numbers
-
Switch to Actual Numbers Input.
-
Fill in monthly MTD and YTD actuals for each KPI.
-
-
Define Targets
-
In the Target sheet, specify MTD and YTD targets by month.
-
Ensure target values align with your business goals and training budgets.
-
-
Add Previous Year Data
-
Populate the Previous Year Number sheet.
-
This step guarantees meaningful year-over-year comparisons.
-
-
Explore the Dashboard
-
Click Home → Dashboard.
-
Use the drop-down in cell D3 to select any month.
-
Review:
-
MTD Actual vs. Target and PY comparisons.
-
YTD Actual vs. Target and PY comparisons.
-
Variance arrows highlight areas needing attention.
-
-
-
Analyze Trends
-
Go to KPI Trend.
-
Choose any KPI from the drop-down in cell C3.
-
Read off the MTD and YTD line charts, observing fluctuations over time.
-
-
Act on Insights
-
Identify underperforming KPIs.
-
Collaborate with training teams to adjust programs, content, or delivery methods.
-
Revisit targets or definitions if necessary.
-
Best Practices for the KPI Dashboard
-
Keep Definitions Concise
Write definitions in no more than 20 words. This brevity guarantees clarity and consistency. -
Review Targets Quarterly
Market conditions evolve rapidly. Therefore, adjust your MTD and YTD targets at least every quarter. -
Validate Inputs Regularly
Conduct monthly spot checks on raw data. Thus, you maintain high data integrity. -
Engage Stakeholders
Share dashboard insights in brief weekly calls or email summaries. Consequently, you foster transparency and buy-in. -
Limit KPI Count Initially
Begin with no more than 8–10 core KPIs. After your team masters the process, expand to advanced metrics. -
Document Change Log
Maintain a hidden “Change Log” sheet that tracks any formula updates or structural changes. This record keeps everyone informed. -
Automate Backups
Save monthly snapshots of your workbook. As a result, you protect historical data and audit trails. -
Train Users
Offer a 30-minute walkthrough for new users. Instructors should highlight navigation, input rules, and interpretation guidelines. -
Leverage Conditional Formatting Wisely
Avoid over-coloring. Use red/green arrows or traffic lights for the most critical variances.
Frequently Asked Questions (FAQs)
1. What training KPIs does this dashboard track?
We include foundational metrics such as Completion Rate, Average Training Hours per Employee, Certification Rate, and Training Cost per Head. You can customize any additional KPIs in the KPI Definition sheet.
2. Can I add or remove KPIs from the dashboard?
Yes. Simply update the KPI Definition sheet by adding a new row (for additions) or deleting an existing one (for removals). All downstream calculations and charts adjust automatically.
3. Do I need any special Excel version to use this template?
You require Microsoft Excel 2016 or later. The dashboard uses standard functions—no Power Query or VBA macros beyond simple navigation links.
4. How does the YTD calculation work?
The template sums MTD values from the start of your fiscal year (defined in cell E1 of the Actual Numbers Input sheet) through the selected month. Thus, YTD reflects cumulative performance.
5. Can I change the fiscal year start date?
Absolutely. Modify the date in cell E1 of the Actual Numbers Input sheet. Excel automatically updates month labels and calculations across all input sheets.
6. How do I interpret the conditional formatting arrows?
-
Up arrow (green) indicates the Actual value meets or exceeds the Target (or beats last year).
-
Down arrow (red) signals underperformance.
7. Will this dashboard slow down with many KPIs or months?
Click to Purchases Retail and E-commerce Training and Development KPI Dashboard in Excel
No. Formulas use efficient references and Excel handles hundreds of rows without performance issues. However, avoid extremely large data (>5000 rows) in monthly input sheets.
8. Can I share this dashboard on SharePoint or OneDrive?
Yes. Save the workbook to your cloud storage and grant access. Users with Excel can open and interact with it simultaneously.
9. How often should I update the dashboard?
We recommend monthly updates for input sheets and quarterly strategy reviews. This cadence balances data freshness with workload.
10. Does the template support multiple currencies?
By default, the template uses generic number formats. To track costs in multiple currencies, add a “Currency” column in your input sheets and adjust formulas for currency conversion.
Conclusion
A robust Retail and E-commerce Training and Development KPI Dashboard in Excel transforms raw data into actionable insights. By consolidating Actuals, Targets, and historical figures within seven intuitive worksheets, you ensure smooth navigation, accurate reporting, and timely decisions. Moreover, the built-in trend analysis and variance signals accelerate your response to opportunities and challenges. Remember to follow best practices—keep definitions clear, validate inputs, and engage stakeholders—to maximize the dashboard’s impact. With this template at your fingertips, you’ll guide your training initiatives to new heights of effectiveness and ROI.
Visit our YouTube channel to learn step-by-step video tutorials