Managing road and highway construction projects demands clarity, accuracy, and quick decision-making. Teams track daily progress, material usage, machine performance, contractor productivity, safety compliance, inspection scores, and overall project timelines. Because construction sites deal with multiple data points, traditional reporting often becomes slow and unreliable.
A Road and Highway Construction KPI Dashboard in Power BI solves these challenges. It brings all important KPIs into one place and gives decision-makers a real-time understanding of project performance. Since Power BI offers clean visuals, drill-through insights, and interactive filters, project teams stay aligned, informed, and confident while making decisions.
In this detailed guide, you will learn everything about this dashboard—its purpose, structure, features, data inputs, advantages, best practices, and important FAQs.
Click to Purchases Road and Highway Construction KPI Dashboard in Power BI
What Is a Road and Highway Construction KPI Dashboard in Power BI?
A Road and Highway Construction KPI Dashboard in Power BI is a ready-to-use reporting solution that tracks all major performance indicators for road and highway projects. It shows your actual progress, targets, and year-to-year comparisons. You also get instant insights into delays, risks, productivity gaps, and priority KPIs.
Because the dashboard connects to an Excel data source, you can update it easily without technical knowledge. You simply enter the monthly actuals, targets, and KPI definitions, and Power BI updates everything automatically.
Why Do Road and Highway Projects Need a KPI Dashboard?
Construction projects involve multiple teams, contractors, deadlines, machines, materials, and compliance requirements. Even a small delay can affect budget, timeline, and safety targets. Therefore, project managers need a fast, simple, and structured visibility tool.
This dashboard helps you:
-
Track every KPI in one place
-
Compare Actuals vs Targets
-
Identify delays quickly
-
Monitor year-on-year performance
-
Evaluate progress using charts and trend lines
-
Get data-driven insights for faster decisions
-
Improve productivity and reduce risks
With a proper KPI dashboard, road and highway construction teams spend less time on manual reporting and more time on execution.
Click to Purchases Road and Highway Construction KPI Dashboard in Power BI
Complete Structure of the Road and Highway Construction KPI Dashboard
The dashboard includes three main pages:
-
Summary Page
-
KPI Trend Page
-
KPI Definition Page (Drill-through)
Each page works together to give you full control over your construction KPIs.
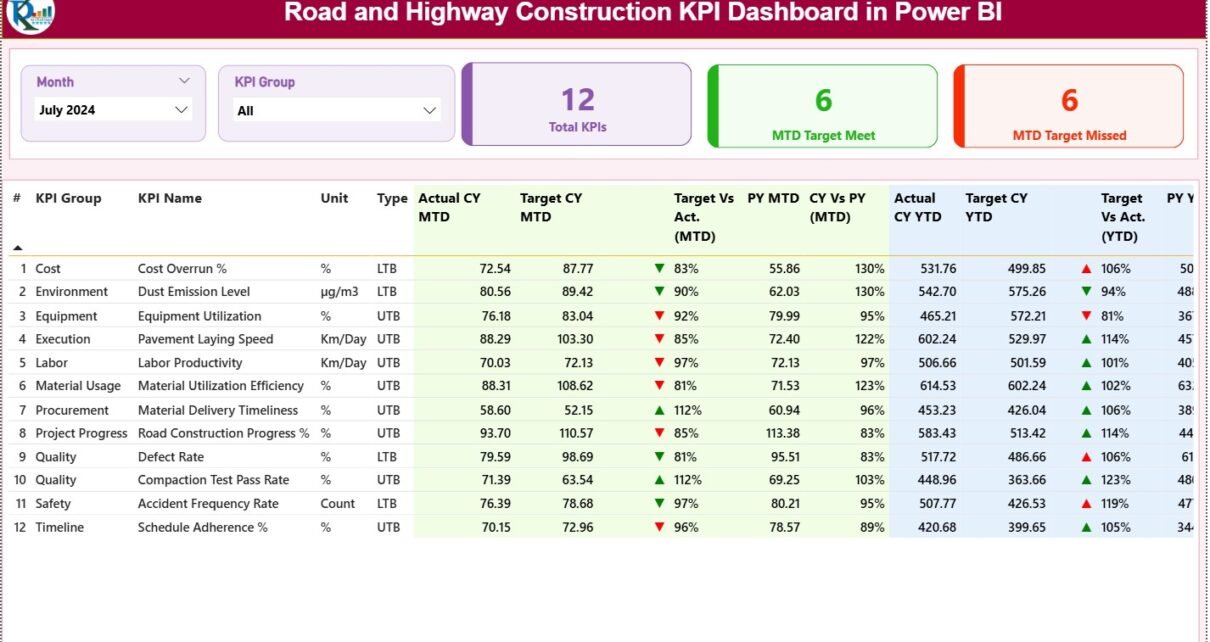
1. Summary Page – The Main Dashboard View
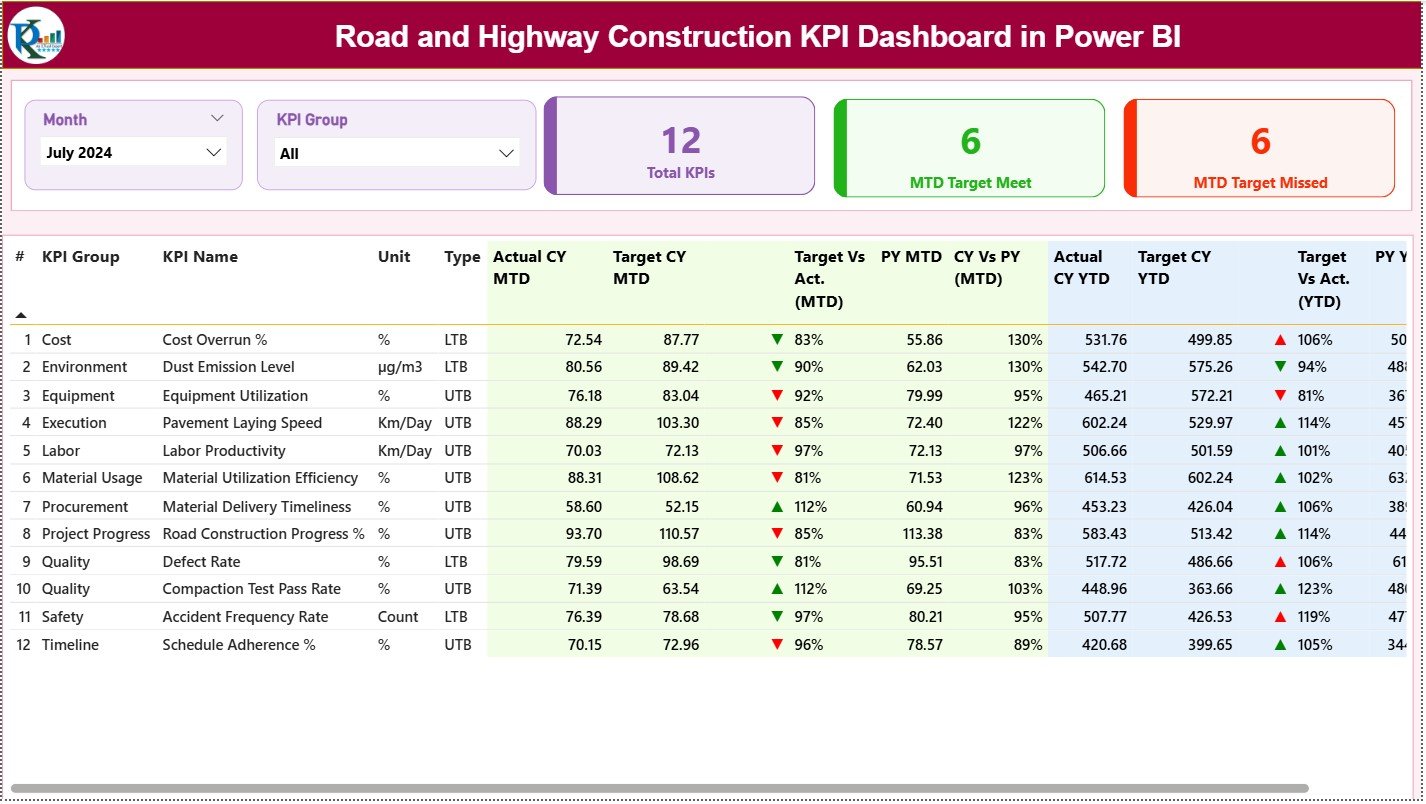
The Summary Page is the most important part of this Power BI file. It gives a clear and complete snapshot of your entire performance.
Top Section – Slicers and Cards
At the top, you get two slicers:
-
Month Slicer: Select the month you want to review.
-
KPI Group Slicer: Filter KPIs based on categories like Productivity, Quality, Safety, Contractors, Progress, or Budget.
Power BI instantly updates the full dashboard once you select your month and group.
You also get three important KPI cards:
-
Total KPIs Count
-
MTD Target Met Count
-
MTD Target Missed Count
These cards show your high-level status and indicate whether you need attention on specific areas.
Detailed KPI Table – Full Performance Breakdown
Below the cards, you get a complete table showing every KPI with the following fields:
● KPI Number
A simple sequence number for easy identification.
● KPI Group
The category or group of the KPI (example: Progress, Safety, Quality, Cost).
● KPI Name
The name of the KPI (example: Road Excavation Progress, Pothole Repair Rate).
● Unit
The unit of measurement (example: km, %, hours, tons).
● Type (UTB or LTB)
-
UTB (Upper the Better) – Higher value means better performance
-
LTB (Lower the Better) – Lower value means better performance
● Actual CY MTD
The current month’s actual performance value.
● Target CY MTD
The monthly target you want to achieve.
● MTD Icon
A ▲ or ▼ icon shows whether the KPI meets or misses the target.
-
▲ Green = Target Achieved
-
▼ Red = Target Not Achieved
● Target vs Actual % (MTD)
Formula:
Actual MTD / Target MTD
This percentage shows how close or far you are from achieving the monthly target.
● PY MTD
The previous year’s performance for the same month.
● CY vs PY % (MTD)
Formula:
Current Year MTD / Previous Year MTD
You can quickly see if performance improves compared to last year.
Year-to-Date (YTD) Section
The dashboard also shows YTD performance:
-
Actual CY YTD
-
Target CY YTD
-
YTD Icon (▲ or ▼)
-
Target vs Actual % (YTD)
-
PY YTD
-
CY vs PY % (YTD)
This YTD analysis helps you track long-term performance and identify delays early.
Click to Purchases Road and Highway Construction KPI Dashboard in Power BI
2. KPI Trend Page – Visual Insights for Decision-Making
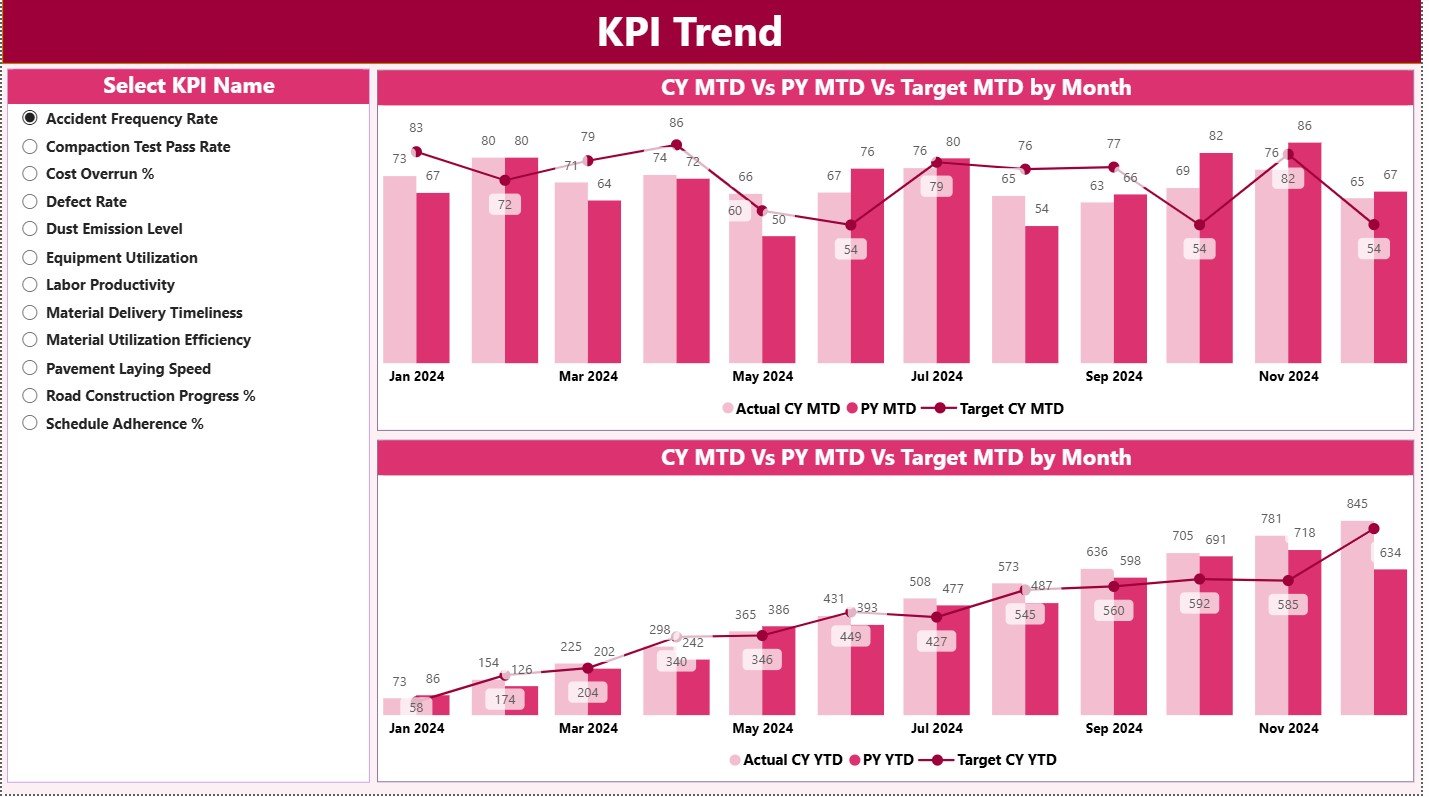
The KPI Trend page helps you understand how each KPI performs month wise. You get two powerful combo charts:
● MTD Chart
Shows Actual vs Target vs Previous Year monthly performance.
● YTD Chart
Shows cumulative performance through the year.
On the left, you get a slicer to choose a KPI name. Once you pick a KPI, both charts update instantly. This quick visualization helps construction managers:
-
Compare monthly results
-
Identify seasonal patterns
-
Track long-term improvement
-
Review previous year performance
-
Take quick action when performance drops
This page is extremely useful during review meetings.
3. KPI Definition Page – Drill-Through Explanation of Each KPI
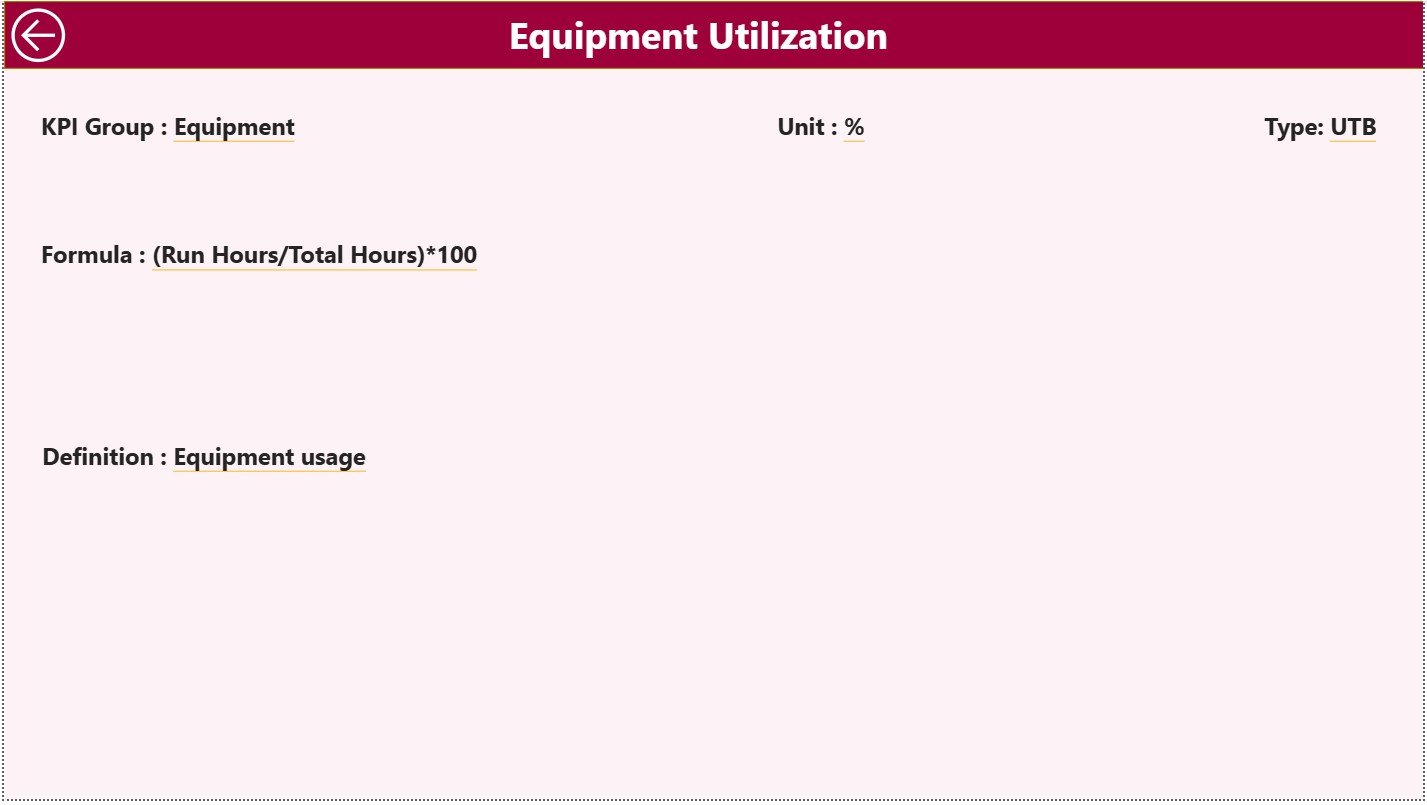
This page stays hidden by default and appears only when you drill through from the Summary Page.
It shows:
-
KPI Number
-
KPI Group
-
KPI Name
-
Unit
-
Formula
-
Definition
-
Type (UTB/LTB)
This feature helps new team members, contractors, and auditors understand the meaning and calculation of each KPI.
A Back Button lets you return to the Summary Page easily.
Click to Purchases Road and Highway Construction KPI Dashboard in Power BI
Excel Data Source – The Backbone of the Dashboard
This Power BI dashboard uses a simple Excel file as the data source. You need to update three sheets:
1. Input_Actual Sheet
Fill in the actual KPI numbers here.
Columns include:
-
KPI Name
-
Month (use first day of the month, e.g., 01-Jan-2024)
-
MTD Value
-
YTD Value
2. Input_Target Sheet
Fill in the target values here.
Columns include:
-
KPI Name
-
Month
-
MTD Target
-
YTD Target
3. KPI Definition Sheet
Enter all KPI details:
-
KPI Number
-
KPI Group
-
KPI Name
-
Unit
-
Formula
-
Definition
-
Type (LTB/UTB)
Once you update these sheets, Power BI refreshes all visuals automatically.
Advantages of Road and Highway Construction KPI Dashboard in Power BI
Using this KPI dashboard offers many major benefits. Let’s look at the key advantages:
1. Real-Time Visibility
You see all performance indicators instantly. Project managers do not wait for weekly or monthly reports.
2. Faster Decision-Making
Since the dashboard updates in real time, teams act quickly to fix delays, improve productivity, or manage risk.
3. Clear Performance Tracking
You get clear insights for:
-
MTD
-
YTD
-
Target vs Actual
-
Current vs Previous Year
This helps project teams understand trends better.
4. Easy to Maintain
Since the dashboard uses Excel as the data source, anyone can update it. No coding or technical knowledge required.
5. Better Collaboration
Teams like Planning, Execution, Quality, Safety, and Finance stay aligned because everyone views the same dashboard.
6. Reduces Manual Errors
Manual reporting often leads to mistakes. With an automated dashboard, accuracy improves.
7. Strong Monitoring of Contractors
Performance of contractors becomes transparent through data-driven insights.
8. Supports All Types of Construction KPIs
You can track:
-
Excavation
-
Earthwork
-
RCC progress
-
Machinery usage
-
Material consumption
-
Surface preparation
-
Road laying progress
-
Asphalt production
-
Quality and safety indicators
Best Practices for Using the Road and Highway Construction KPI Dashboard
To get the most out of your Power BI dashboard, follow these best practices:
1. Update Data Regularly
Enter Actual and Target numbers at the right time. This keeps your dashboard accurate.
2. Keep KPI Definitions Clear
Write short and simple definitions. Clear KPIs help new users understand the dashboard easily.
3. Use Slicers Smartly
Use the Month and KPI Group slicer to filter the dashboard during meetings. This saves time and improves clarity.
4. Review Trends Frequently
Use the KPI Trend page often. It helps you catch performance drops early.
5. Standardize Colors and Icons
Use:
-
Green ▲ for good performance
-
Red ▼ for poor performance
This improves readability.
6. Refresh Power BI File Weekly
Refreshing regularly helps teams see the latest numbers without confusion.
7. Maintain Clean Excel Sheets
Avoid formatting or merged cells. Keep sheets clean for smooth Power BI refresh.
Conclusion
A Road and Highway Construction KPI Dashboard in Power BI gives complete visibility into construction performance. It simplifies reporting, reduces manual effort, and brings clarity to monthly and yearly trends. Since the dashboard includes summary insights, trend charts, and KPI definitions, construction teams can take fast, confident, and data-driven decisions.
This dashboard is perfect for contractors, government authorities, EPC companies, project management consultants, and any team handling road and highway projects. With simple Excel inputs and powerful Power BI visuals, you get a smart and efficient performance monitoring system.
Click to Purchases Road and Highway Construction KPI Dashboard in Power BI
Frequently Asked Questions (FAQs)
1. What is the main purpose of a Road & Highway Construction KPI Dashboard?
The dashboard helps track progress, performance, delays, and targets in real time.
2. Can beginners use this dashboard?
Yes. It uses simple visuals, slicers, and Excel inputs, so beginners can use it easily.
3. How often should I update the Excel data?
You should update Actuals and Targets every month or every week depending on your project need.
4. Does it track both MTD and YTD performance?
Yes. It shows MTD, YTD, Target vs Actual, and CY vs PY comparisons.
5. Can I add more KPIs in the future?
Yes. You can add more KPIs in the KPI Definition sheet and refresh Power BI.
6. What skills do I need to maintain this dashboard?
You only need basic Excel and basic Power BI refresh knowledge.
7. Does it support drill-through for KPI details?
Yes. You can drill through from the Summary Page to the KPI Definition Page.
8. Can I use this dashboard for multiple road projects?
Yes. You can customize the KPIs and use the dashboard for multiple sites.
Click to Purchases Road and Highway Construction KPI Dashboard in Power BI
Visit our YouTube channel to learn step-by-step video tutorials