In the fast-paced world of sports leagues, performance measurement and real-time data analysis are key to making informed decisions. Whether you are managing a professional sports organization, an amateur league, or a multi-team tournament, having an efficient reporting system can make the difference between strategic success and missed opportunities.
The Sports League KPI Dashboard in Power BI is a powerful, ready-to-use tool designed to track, analyze, and visualize Key Performance Indicators (KPIs) in an easy-to-understand format. It combines the flexibility of Excel data entry with the dynamic visualization power of Power BI, allowing league managers, coaches, and stakeholders to make quick and effective decisions.
In this article, we’ll explore everything about this dashboard — from its key features and page breakdown to advantages, best practices, and frequently asked questions.
Click to Purchases Sports League KPI Dashboard in Power BI
What is the Sports League KPI Dashboard in Power BI?
The Sports League KPI Dashboard in Power BI is a pre-built reporting solution that allows you to monitor multiple KPIs across different categories such as performance metrics, player statistics, team results, and operational targets.
It connects to an Excel-based data source, where actual and target values are entered, and then dynamically updates Power BI visualizations. This ensures that your dashboard is always up to date, interactive, and visually clear.
Key Features of the Dashboard
This dashboard comes with three main pages in the Power BI Desktop file, each serving a unique purpose.
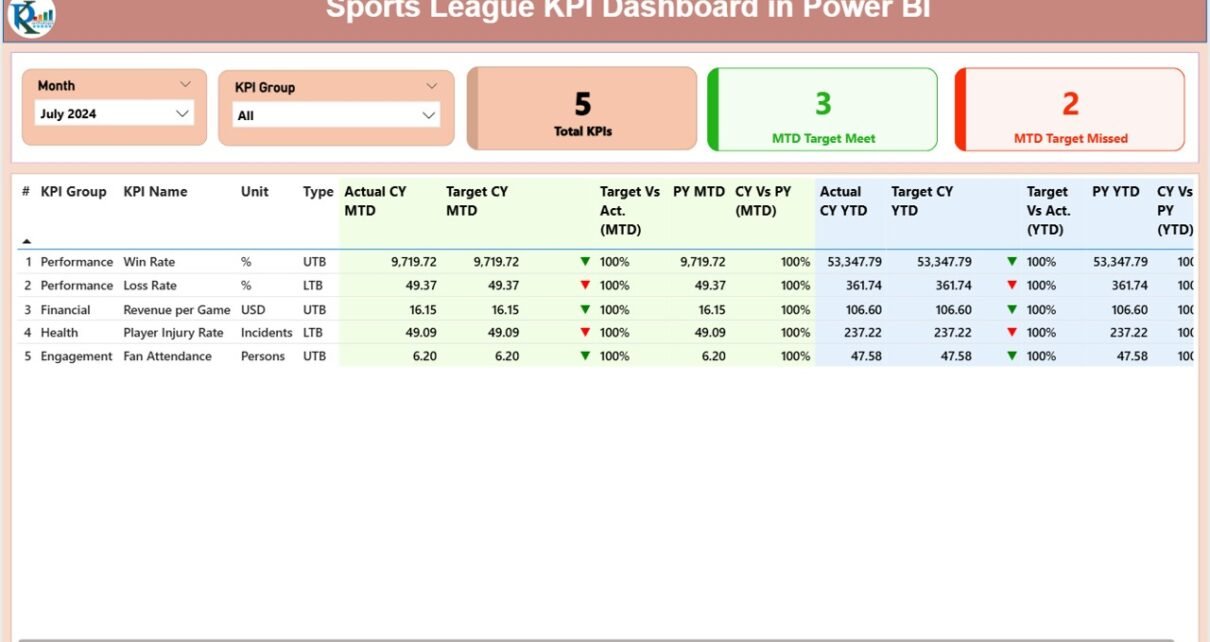
Summary Page – The Control Center
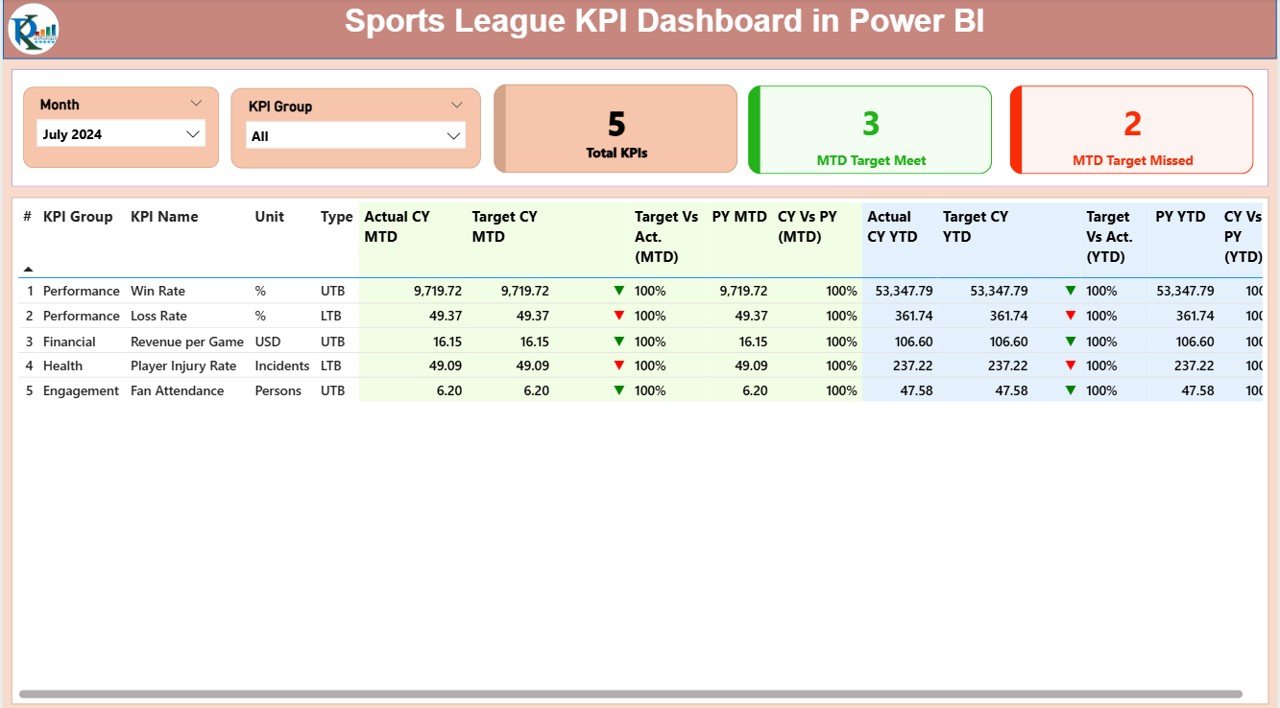
The Summary Page is the main hub of the dashboard. It gives a snapshot of overall KPI performance for the selected month and KPI group.
Key elements of the Summary Page include:
-
Slicers for Month and KPI Group
These allow users to filter the entire dashboard by a specific month or KPI category.
Performance Cards
- Total KPIs Count – The number of KPIs being tracked.
- MTD Target Met Count – How many KPIs met their Month-to-Date (MTD) target.
- MTD Target Missed Count – How many KPIs fell short of their MTD target.
Detailed KPI Table – Displays essential KPI details, including:
- KPI Number, KPI Group, KPI Name, Unit of Measurement
- Type (Lower the Better – LTB or Upper the Better – UTB)
- Actual CY MTD and Target CY MTD
- MTD Icon (▲ Green = On Target, ▼ Red = Below Target)
- Target vs Actual (MTD %)
- PY MTD and CY vs PY (MTD %)
- Actual CY YTD and Target CY YTD
- YTD Icon
- Target vs Actual (YTD %)
- PY YTD and CY vs PY (YTD %)
This structured table gives a complete performance picture for each KPI, allowing decision-makers to quickly identify areas of success and improvement.
KPI Trend Page – Performance Over Time
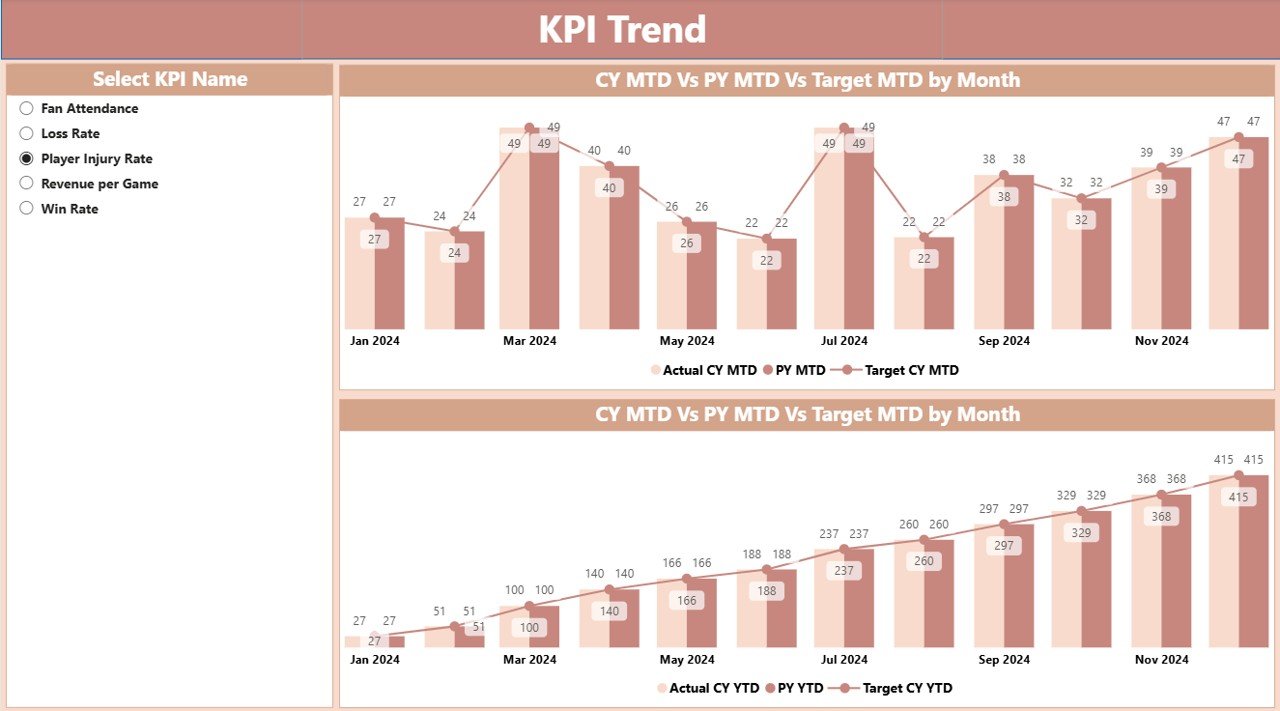
The KPI Trend Page focuses on visualizing the progress and changes in performance over time.
Features of the KPI Trend Page:
-
Two Combo Charts – Show the Actuals (Current Year and Previous Year) and Target values for both MTD and YTD.
-
KPI Selection Slicer – Allows users to choose a specific KPI and view its performance trend in detail.
This page is perfect for identifying patterns, spotting seasonal fluctuations, and forecasting future performance.
KPI Definition Page – Understanding the Metrics
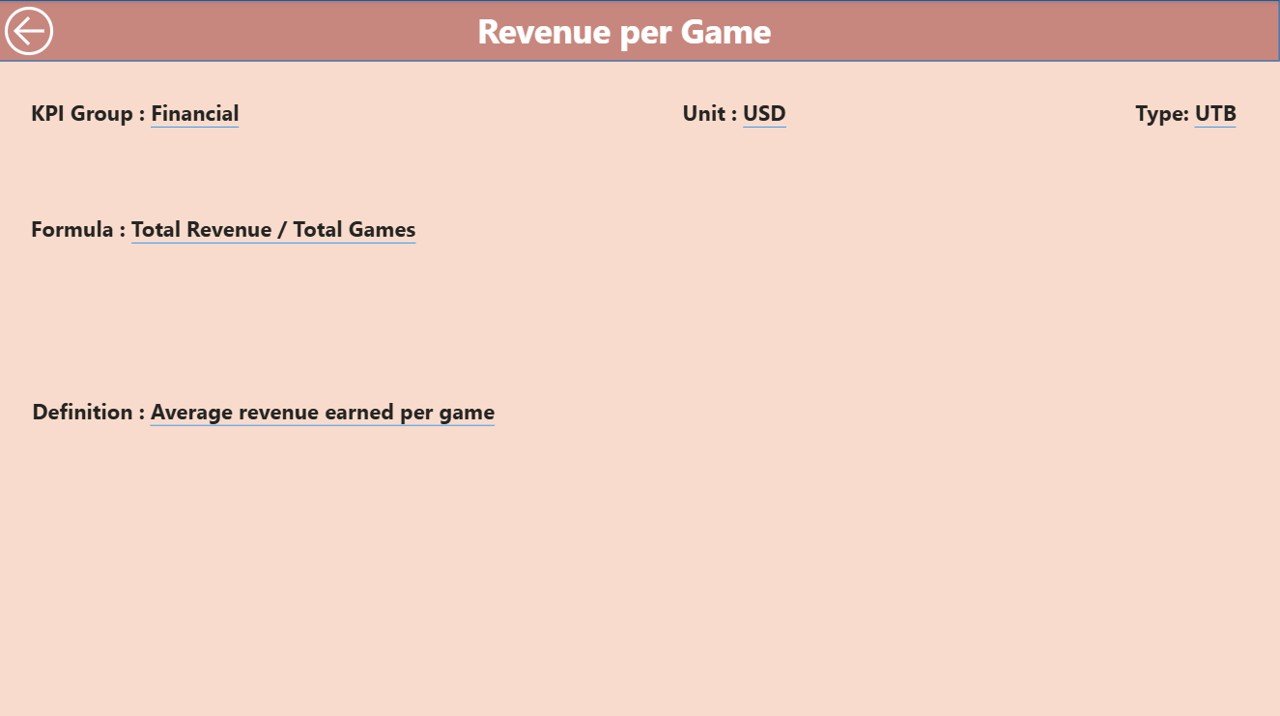
The KPI Definition Page provides clarity on how each KPI is calculated and what it represents.
-
It is a drill-through page (hidden by default).
-
Accessible directly from the Summary Page by right-clicking on a KPI.
Displays:
- Formula used to calculate the KPI
- KPI definition in simple terms
A Back Button is available in the top-left corner to return to the Summary Page.
Excel Data Structure for the Dashboard
The Sports League KPI Dashboard uses three worksheets in Excel as its data source.
1. Input_Actual Sheet
-
Fields: KPI Name, Month (use the first date of the month), MTD Number, YTD Number.
-
Enter the actual performance values here.
2. Input_Target Sheet
-
Fields: KPI Name, Month (use the first date of the month), MTD Number, YTD Number.
-
Enter the target values for each KPI.
3. KPI Definition Sheet
-
Fields: KPI Number, KPI Group, KPI Name, Unit, Formula, Definition, Type (LTB/UTB).
-
Clearly defines each KPI to ensure consistent understanding across teams.
Why Use a Sports League KPI Dashboard in Power BI?
Click to Purchases Sports League KPI Dashboard in Power BI
Sports leagues deal with multiple moving parts:
-
Team performance
-
Player statistics
-
Event attendance
-
Sponsorship commitments
-
Revenue generation
Tracking all these metrics manually is time-consuming and prone to errors. This dashboard centralizes all key data into one easy-to-navigate system.
Advantages of the Sports League KPI Dashboard
-
Real-Time Updates – Data changes in Excel are instantly reflected in Power BI.
-
Clear Visualization – Complex KPI data is presented through charts, tables, and icons.
-
Improved Decision-Making – Quick access to performance insights enables faster strategy adjustments.
-
Standardized Metrics – Ensures all teams and stakeholders evaluate performance using the same definitions.
-
Flexible Filtering – Month and KPI Group slicers make it easy to drill down into specific data sets.
-
Historical Comparison – Easily compare Current Year vs Previous Year performance.
Opportunities for Improvement
Even though the dashboard is powerful, there are always ways to make it better:
-
Mobile Optimization – Create a mobile-friendly version for on-the-go access.
-
Integration with Live Sports APIs – Automate data collection from sports statistics websites.
-
Advanced Predictive Analytics – Use AI forecasting models to predict future KPI trends.
-
Custom User Roles – Implement security levels for different stakeholders.
-
Enhanced Data Validation – Add Excel-based checks to prevent incorrect data entry.
Best Practices for the Sports League KPI Dashboard
To get the most out of this tool, follow these best practices:
-
Keep Data Entry Consistent – Always use the same unit of measurement for each KPI.
-
Update Regularly – Refresh the Excel data at consistent intervals (daily, weekly, or monthly).
-
Review KPI Definitions Periodically – Ensure that KPIs remain relevant to league objectives.
-
Use Conditional Formatting Wisely – Maintain clear and intuitive visual indicators for performance.
-
Train Stakeholders – Make sure everyone understands how to navigate and interpret the dashboard.
How to Implement the Sports League KPI Dashboard
Step 1: Prepare your Excel data file with Actual, Target, and KPI Definition sheets.
Step 2: Load the data into Power BI Desktop.
Step 3: Refresh the visuals and validate that slicers and drill-through functions work.
Step 4: Share the dashboard through Power BI Service for online access.
Step 5: Schedule automatic data refreshes if possible.
Conclusion
The Sports League KPI Dashboard in Power BI is more than just a reporting tool — it is a performance management solution. By integrating Excel’s flexibility with Power BI’s visualization capabilities, it gives sports managers the ability to track, compare, and improve their league’s performance efficiently.
When used effectively, this dashboard becomes a game-changer for managing KPIs, aligning strategies, and achieving competitive success.
Frequently Asked Questions (FAQs)
1. What is the main purpose of the Sports League KPI Dashboard?
It helps sports leagues track, visualize, and analyze KPIs to improve performance and decision-making.
2. Do I need Power BI Pro to use this dashboard?
For sharing with others online, Power BI Pro or Premium Per User (PPU) is recommended. For personal use, Power BI Desktop is sufficient.
3. Can I customize the KPIs in the dashboard?
Yes. You can edit the KPI Definition sheet in Excel to add or remove KPIs as per your needs.
4. How often should I update the data?
The update frequency depends on your reporting needs — it can be daily, weekly, or monthly.
5. Can I connect this dashboard to live sports data feeds?
Yes, with some Power BI and API integration work, you can automate data updates from live sports feeds.
Visit our YouTube channel to learn step-by-step video tutorials