Home>Blogs>Charts and Visualization>Spotlight Visualization in Excel (Part-1)>Spotlight Visualization
Spotlight Visualization
18
Jun 2019
226Comments Off on Spotlight Visualization
PK
Meet PK, the founder of PK-AnExcelExpert.com! With over 15 years of experience in Data Visualization, Excel Automation, and dashboard creation. PK is a Microsoft Certified Professional who has a passion for all things in Excel. PK loves to explore new and innovative ways to use Excel and is always eager to share his knowledge with others. With an eye for detail and a commitment to excellence, PK has become a go-to expert in the world of Excel. Whether you're looking to create stunning visualizations or streamline your workflow with automation, PK has the skills and expertise to help you succeed. Join the many satisfied clients who have benefited from PK's services and see how he can take your Excel skills to the next level!
https://www.pk-anexcelexpert.com
Related Articles
Online Education KPI Dashboard in Excel
In the rapidly evolving world of online education, staying ahead of the curve is crucial for success. The Online Online
SUBTOTAL Function in Excel with Examples
Excel can do amazing things with your data, and the SUBTOTAL Function in Excel is one of the most useful
Human Resources Service Delivery KPI Dashboard in Excel
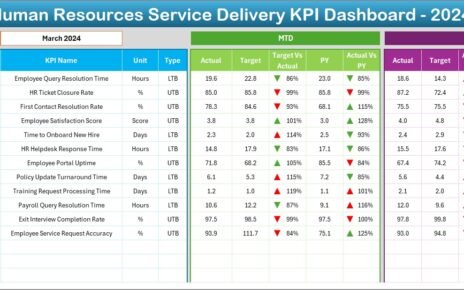
Managing human resources efficiently has become more important than ever. In today’s fast-paced work environment, HR departments must not only