Think tanks play a critical role in shaping public policy, influencing debates, and generating high-quality research. However, even the most respected think tanks struggle when they fail to track performance in a structured way. That is exactly why a Think Tanks KPI Dashboard in Excel becomes essential.
A Think Tanks KPI Dashboard in Excel helps organizations monitor research output, policy influence, funding efficiency, outreach impact, and operational performance in one centralized, easy-to-use system. Moreover, because the dashboard runs in Excel, teams do not need expensive BI tools or complex systems.
In this detailed guide, you will learn what a Think Tanks KPI Dashboard in Excel is, why it matters, how it works, its worksheet structure, key advantages, best practices, and frequently asked questions. The article uses clear language, smooth transitions, and practical examples to ensure clarity and SEO effectiveness.
Click to buy Think Tanks KPI Dashboard in Excel
What Is a Think Tanks KPI Dashboard in Excel?
A Think Tanks KPI Dashboard in Excel is a ready-to-use performance monitoring template designed to track key performance indicators related to research, policy impact, funding, publications, outreach, and internal operations.
Instead of managing multiple disconnected spreadsheets, this dashboard consolidates all KPI data into a single Excel file. As a result, leadership teams gain instant visibility into both monthly and yearly performance.
Furthermore, because Excel remains widely used and easy to customize, this dashboard works well for small, mid-sized, and large think tanks.
Why Do Think Tanks Need a KPI Dashboard?
Think tanks operate in a results-driven environment. Funders, policymakers, and partners expect transparency, accountability, and measurable outcomes. Therefore, tracking KPIs becomes non-negotiable.
Here is why a KPI dashboard matters:
- It aligns research goals with organizational strategy
- It measures policy influence and outreach effectiveness
- It improves funding utilization and reporting
- It supports data-driven decision-making
- It increases accountability across departments
Moreover, when teams track KPIs regularly, they identify gaps early and take corrective action quickly.
How Does a Think Tanks KPI Dashboard in Excel Work?
The dashboard works by collecting KPI data across multiple sheets and presenting insights visually on the Dashboard sheet.
First, users define KPIs such as publications published, policy citations, media mentions, funding utilization, and stakeholder engagement. Next, users enter Actual, Target, and Previous Year numbers. Finally, Excel formulas calculate variances and display performance using charts and conditional formatting.
Because everything connects dynamically, changing the selected month instantly updates the entire dashboard.
Overview of the Think Tanks KPI Dashboard Structure
The Think Tanks KPI Dashboard in Excel contains 7 well-structured worksheets, each designed for a specific purpose. Together, they create a complete performance monitoring system.
Let us explore each worksheet in detail.
Summary Page – How Does the Index Page Work?
The Summary Page acts as the navigation hub of the dashboard.
On this page:
- You get 6 interactive buttons
- Each button links to a specific worksheet
- Users move across sheets with a single click
As a result, navigation becomes smooth and user-friendly, even for non-technical users.

Click to buy Think Tanks KPI Dashboard in Excel
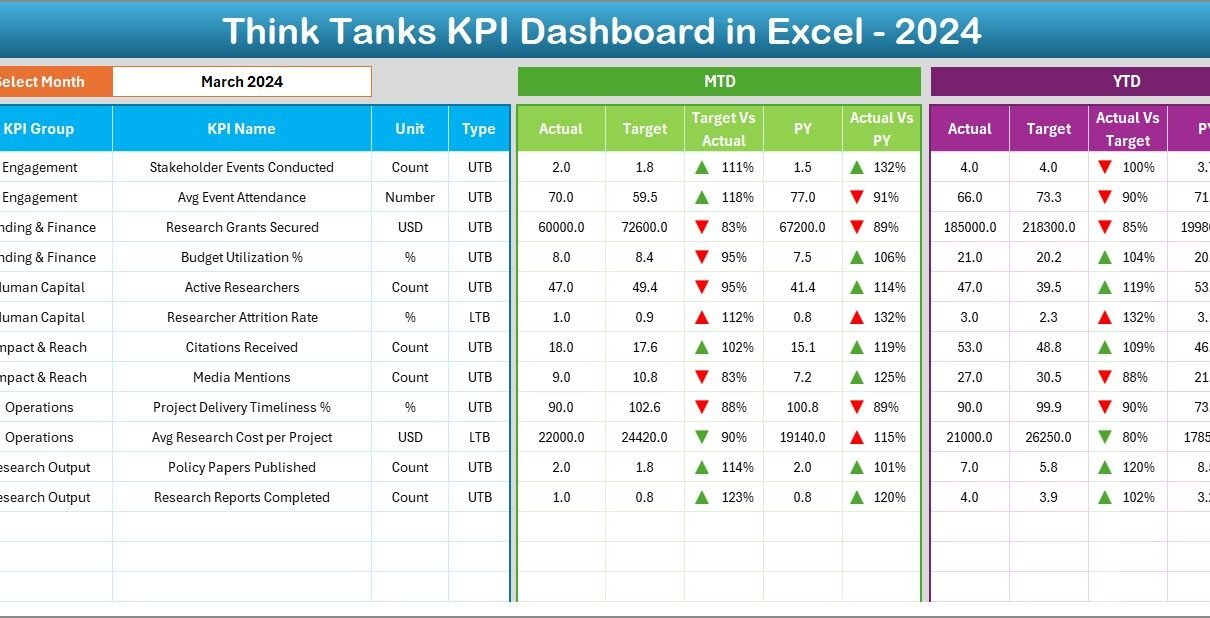
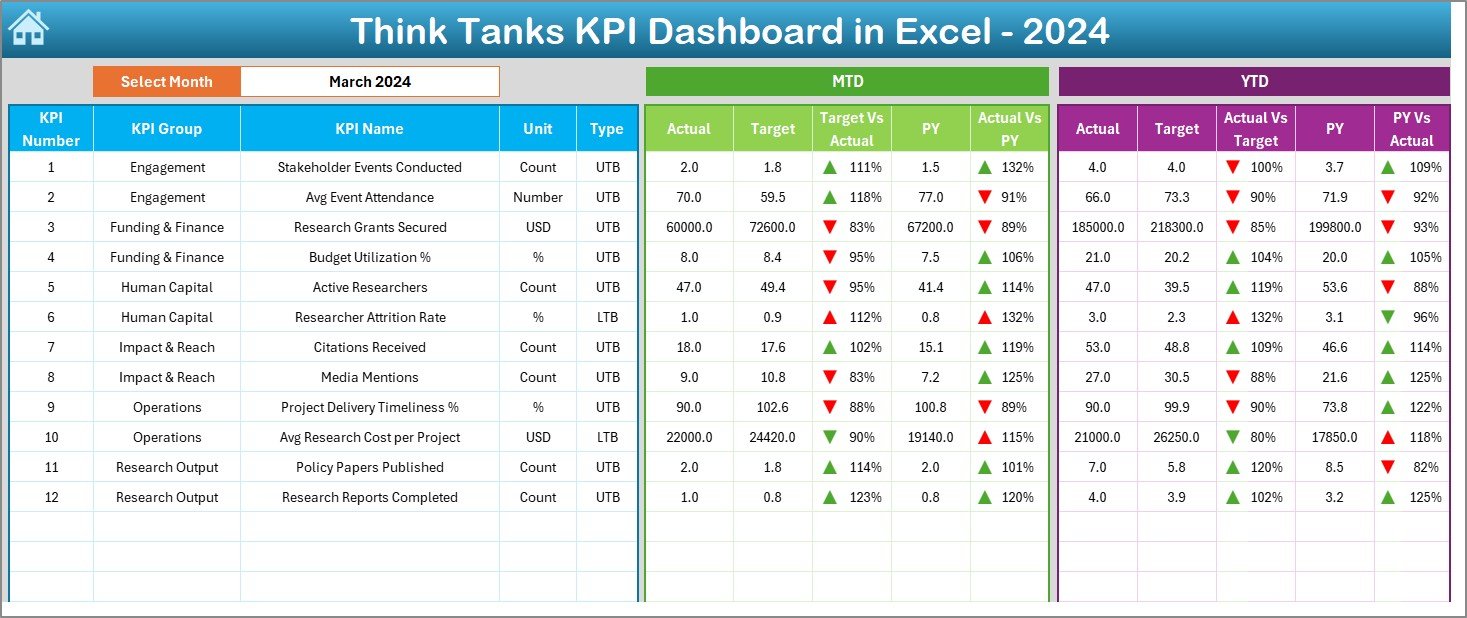
Dashboard Sheet – What Insights Does the Main Dashboard Provide?
The Dashboard sheet serves as the heart of the KPI Dashboard.
Key Features of the Dashboard Sheet
- Month Selector (Cell D3):
Users select the month from a drop-down. Immediately, all KPIs update for that month. - MTD Performance Section:
- MTD Actual
- MTD Target
- MTD Previous Year
- Target vs Actual (with up/down arrows)
- PY vs Actual (with up/down arrows)
- YTD Performance Section:
- YTD Actual
- YTD Target
- YTD Previous Year
- Target vs Actual
- PY vs Actual
Moreover, conditional formatting highlights good and poor performance instantly.
Because of this setup, decision-makers understand performance trends at a glance.
Click to buy Think Tanks KPI Dashboard in Excel
Trend Sheet – How Can You Analyze KPI Trends?
The Trend Sheet helps users analyze performance over time.
Key Functions of the Trend Sheet
KPI selection drop-down in Cell C3
Displays:
KPI Group
KPI Unit
KPI Type (Lower the Better or Upper the Better)
KPI Formula
KPI Definition
Visual Analysis
- MTD trend chart for Actual, Target, and PY
- YTD trend chart for Actual, Target, and PY
As a result, teams identify patterns, seasonality, and performance gaps easily.

Click to buy Think Tanks KPI Dashboard in Excel
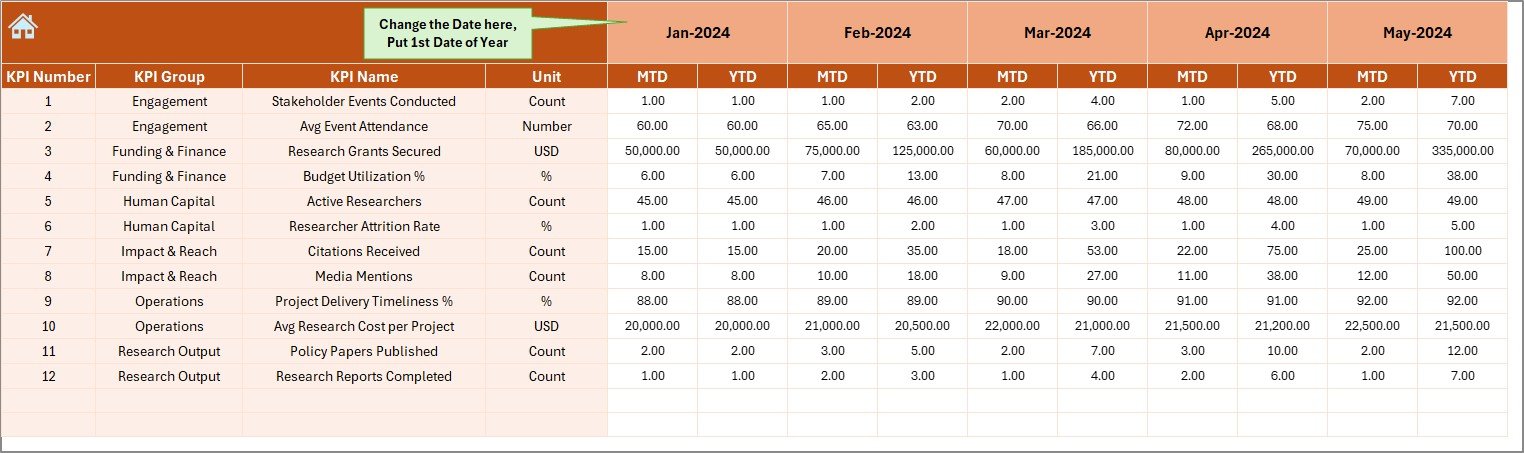
Actual Numbers Input Sheet – Where Do You Enter Actual Data?
The Actual Numbers Input Sheet captures real performance data.
How This Sheet Works
- Users enter MTD and YTD actual numbers
- Month selection available in Cell E1
- Users input the first month of the year in Cell E1
- The dashboard automatically calculates cumulative values
This structure ensures accuracy and consistency in reporting.
Click to buy Think Tanks KPI Dashboard in Excel
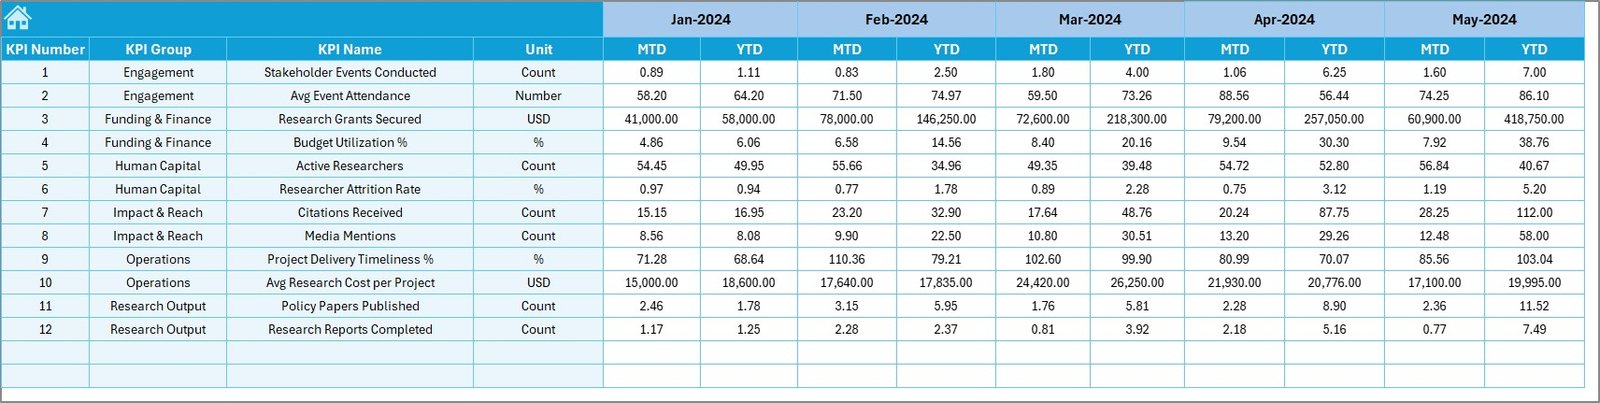
Target Sheet – How Are Targets Managed?
The Target Sheet stores planned performance values.
What You Enter Here
- Monthly MTD targets for each KPI
- Year-to-date targets for each KPI
Because targets drive performance evaluation, this sheet plays a critical role in variance analysis.
Click to buy Think Tanks KPI Dashboard in Excel
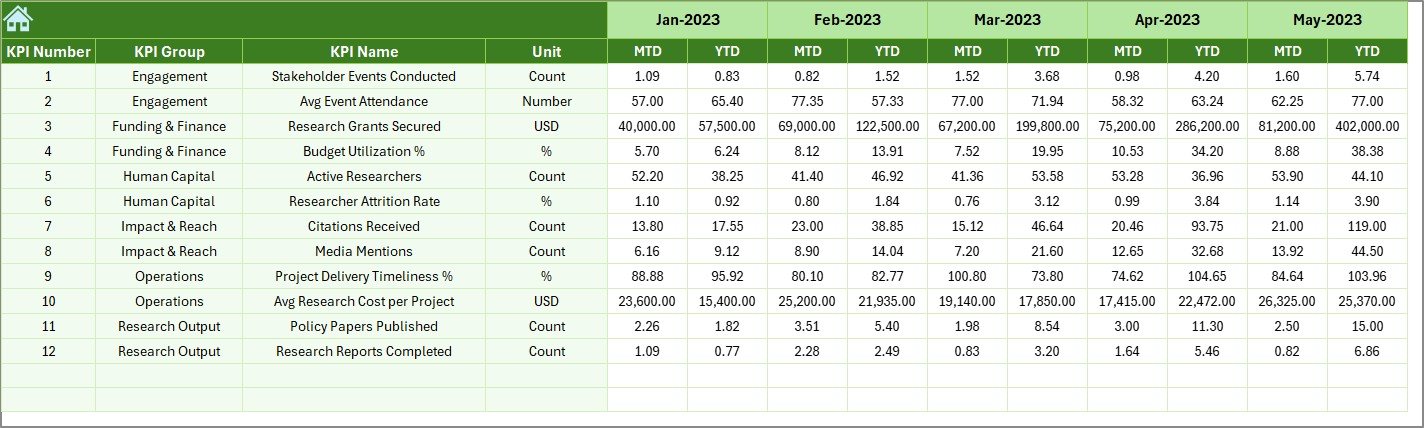
Previous Year Numbers Sheet – Why Compare with Last Year?
The Previous Year Numbers Sheet captures historical performance.
Purpose of This Sheet
- Enables year-over-year comparison
- Highlights growth, decline, or stagnation
- Supports funding and impact reporting
When combined with current year data, this sheet strengthens trend analysis.
Click to buy Think Tanks KPI Dashboard in Excel
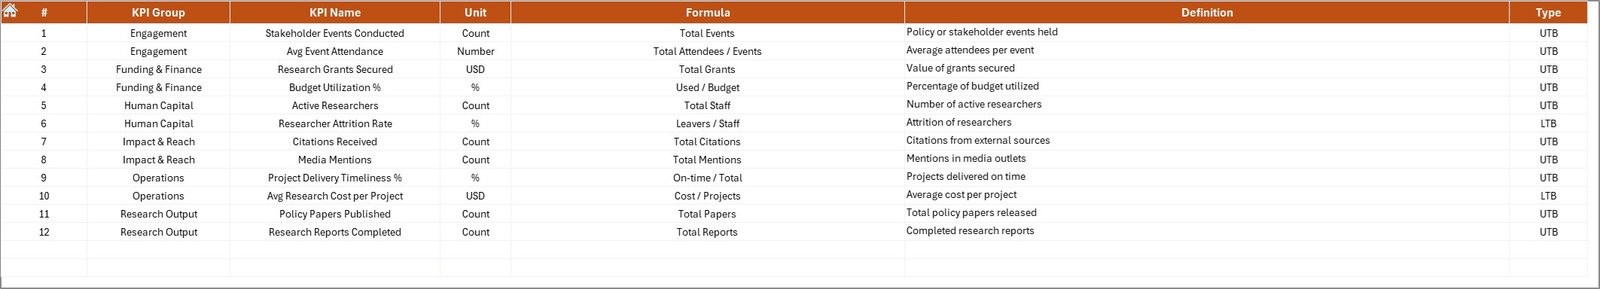
KPI Definition Sheet – How Are KPIs Standardized?
The KPI Definition Sheet acts as the foundation of the entire dashboard.
Fields Included
- KPI Name
- KPI Group
- Unit of Measurement
- Formula
- KPI Definition
Because every KPI remains clearly defined, misinterpretation disappears.
Click to buy Think Tanks KPI Dashboard in Excel
What Types of KPIs Can Think Tanks Track?
A Think Tanks KPI Dashboard in Excel supports multiple KPI categories, such as:
- Research Output KPIs
- Policy Impact KPIs
- Outreach & Media KPIs
- Funding & Finance KPIs
- Operational Efficiency KPIs
Examples include:
- Number of policy papers published
- Policy citations by government bodies
- Media mentions
- Event participation rate
- Budget utilization percentage
Advantages of Think Tanks KPI Dashboard in Excel
- Centralized Performance Monitoring
Instead of scattered files, all KPIs stay in one dashboard. As a result, teams save time and avoid errors.
- Improved Transparency and Accountability
When performance remains visible, accountability increases across teams and departments.
- Easy Customization
Because the dashboard uses Excel, users customize KPIs, layouts, and formulas easily.
- Cost-Effective Solution
Unlike BI tools, Excel dashboards do not require licenses or IT support.
- Faster Decision-Making
With real-time insights, leadership makes informed decisions quickly.
How Does This Dashboard Support Strategic Decision-Making?
The dashboard connects strategy with execution.
For example:
- Leadership tracks whether research output aligns with funding goals
- Communication teams measure outreach impact
- Finance teams monitor budget efficiency
- Directors evaluate year-over-year growth
Therefore, decisions rely on facts, not assumptions.
Best Practices for the Think Tanks KPI Dashboard in Excel
- Define Clear KPIs Before Data Entry
Always define KPIs clearly in the KPI Definition sheet before entering numbers.
- Update Data Regularly
Monthly updates ensure accuracy and relevance.
- Use Consistent Units
Consistency avoids confusion and reporting errors.
- Review Trends, Not Just Numbers
Trends reveal long-term performance better than isolated values.
- Align KPIs with Organizational Goals
Each KPI should support a strategic objective.
Common Challenges and How to Overcome Them
Challenge 1: Too Many KPIs
Solution: Focus only on KPIs that drive impact.
Challenge 2: Inconsistent Data Entry
Solution: Standardize formats and validation rules.
Challenge 3: Lack of Ownership
Solution: Assign KPI owners responsible for updates.
Who Can Benefit from a Think Tanks KPI Dashboard in Excel?
- Think tank directors
- Research managers
- Policy analysts
- Communication teams
- Finance and operations teams
- Donors and funding partners
Because the dashboard provides clarity, every stakeholder benefits.
How to Get Started with the Dashboard?
To get started:
- Define your KPI list
- Populate the KPI Definition sheet
- Enter target values
- Input actual and previous year data
- Review dashboard insights monthly
With this approach, implementation stays simple and effective.
Conclusion
A Think Tanks KPI Dashboard in Excel transforms how organizations measure impact, efficiency, and growth. Instead of relying on fragmented data, think tanks gain a structured, transparent, and data-driven performance system.
Because the dashboard integrates actuals, targets, and historical data, it supports smarter decisions, stronger accountability, and better reporting. Moreover, Excel’s flexibility ensures easy adoption without technical barriers.
If think tanks want to improve visibility, credibility, and strategic alignment, this KPI Dashboard becomes an essential tool.
Frequently Asked Questions (FAQs)
What is the main purpose of a Think Tanks KPI Dashboard in Excel?
The dashboard helps track research performance, policy impact, funding efficiency, and outreach effectiveness in one place.
Can small think tanks use this dashboard?
Yes, because Excel works well for organizations of all sizes.
Do I need advanced Excel skills to use it?
No, basic Excel knowledge is enough.
How often should KPIs be updated?
Monthly updates deliver the best insights.
Can I add new KPIs later?
Yes, the dashboard supports easy customization.
Does this dashboard support year-over-year comparison?
Yes, it includes Previous Year data for comparison.
Can this dashboard support donor reporting?
Yes, it improves transparency and accountability.
Is Excel better than BI tools for think tanks?
Excel works better for cost-effective and flexible reporting needs.
Watch the step-by-step video tutorial:
Visit our YouTube channel to learn step-by-step video tutorials
Click to buy Think Tanks KPI Dashboard in Excel