In today’s fast-paced engineering world, managing multiple projects, departments, and budgets can quickly become overwhelming. Whether it’s tracking project completion, monitoring costs, or identifying risk areas, decision-makers need a clear and interactive way to understand what’s happening across the organization.
That’s where the Engineering Dashboard in Power BI comes in. This ready-to-use business intelligence solution transforms complex engineering data into visual insights. Built with Power BI, it helps project managers, engineers, and executives monitor progress, detect bottlenecks, and make informed decisions — all in real time.
Click to Purchases Engineering Dashboard in Power BI
What Is an Engineering Dashboard in Power BI?
An Engineering Dashboard in Power BI is an interactive visual tool that consolidates engineering-related performance data from multiple sources into one unified platform. It allows users to analyze project health, department performance, issue resolution rates, and cost efficiency at a glance.
Instead of spending hours compiling spreadsheets or reports, this dashboard enables teams to visualize every key metric — such as project completion %, budget utilization, and issue tracking — in real time. The result? Faster insights, smarter actions, and better project outcomes.
Key Features of the Engineering Dashboard in Power BI
This dashboard file contains five comprehensive pages, each focusing on a specific area of engineering performance. Together, they deliver a 360-degree analytical view that empowers teams to act proactively.
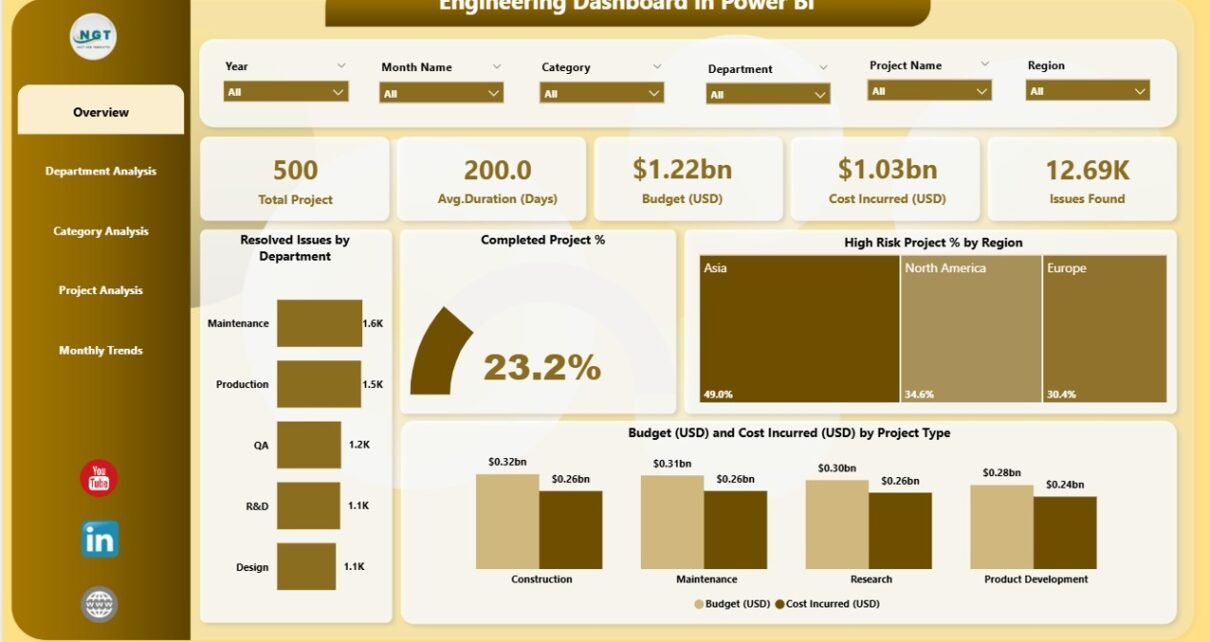
1. Overview Page
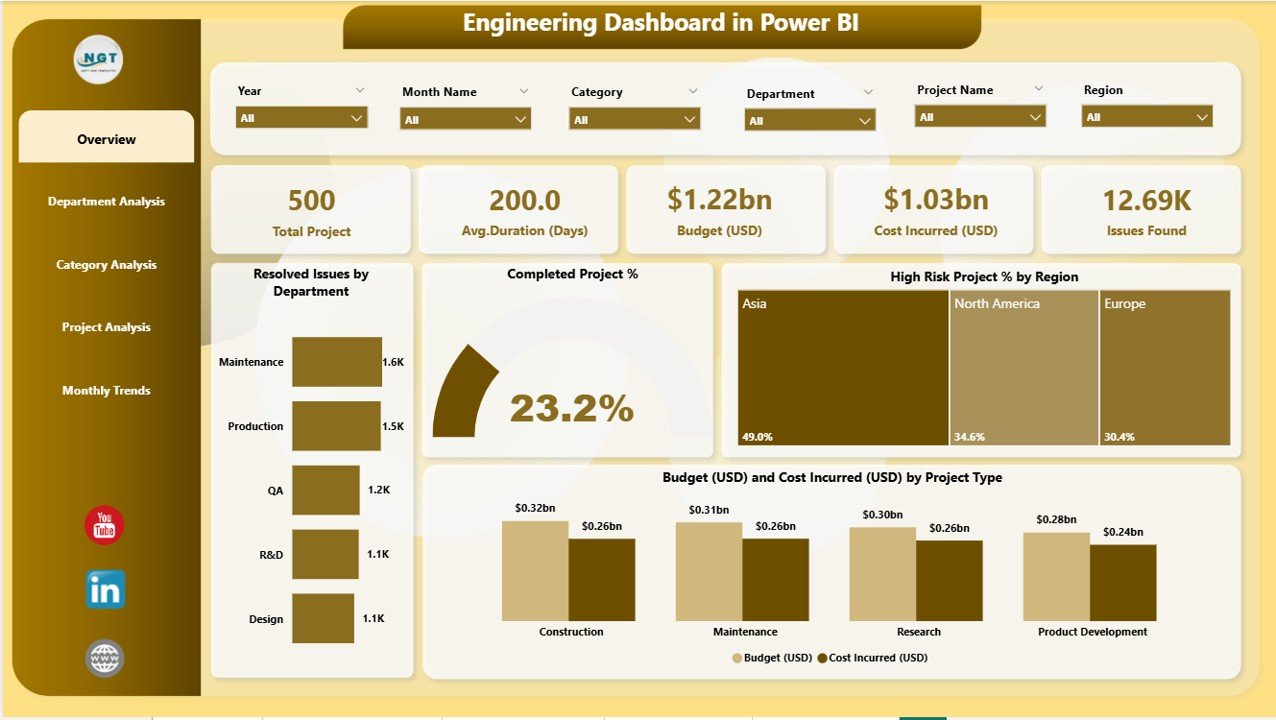
The Overview Page serves as the command center for the dashboard. It gives a summarized picture of overall engineering performance using visual cards and charts.
What You’ll Find on the Overview Page:
-
KPI Cards: Display quick stats such as Total Projects, Resolved Issues, Completed Project %, High-Risk Project %, and Budget Utilization.
-
Interactive Slicers: Filter data by month, department, project type, or region to focus on the metrics that matter most.
-
Visual Charts:
-
Resolved Issues by Department — Quickly identify departments that resolve issues efficiently.
-
Completed Project % — Track how many projects reach completion on time.
-
High-Risk Project % by Region — Understand where risk levels are highest.
-
Budget (USD) vs Cost Incurred (USD) by Project Type — Compare budget allocation with actual spending.
-
The Overview Page allows top-level management to see the big picture while maintaining flexibility for deep-dive analysis.
2. Department Analysis Page
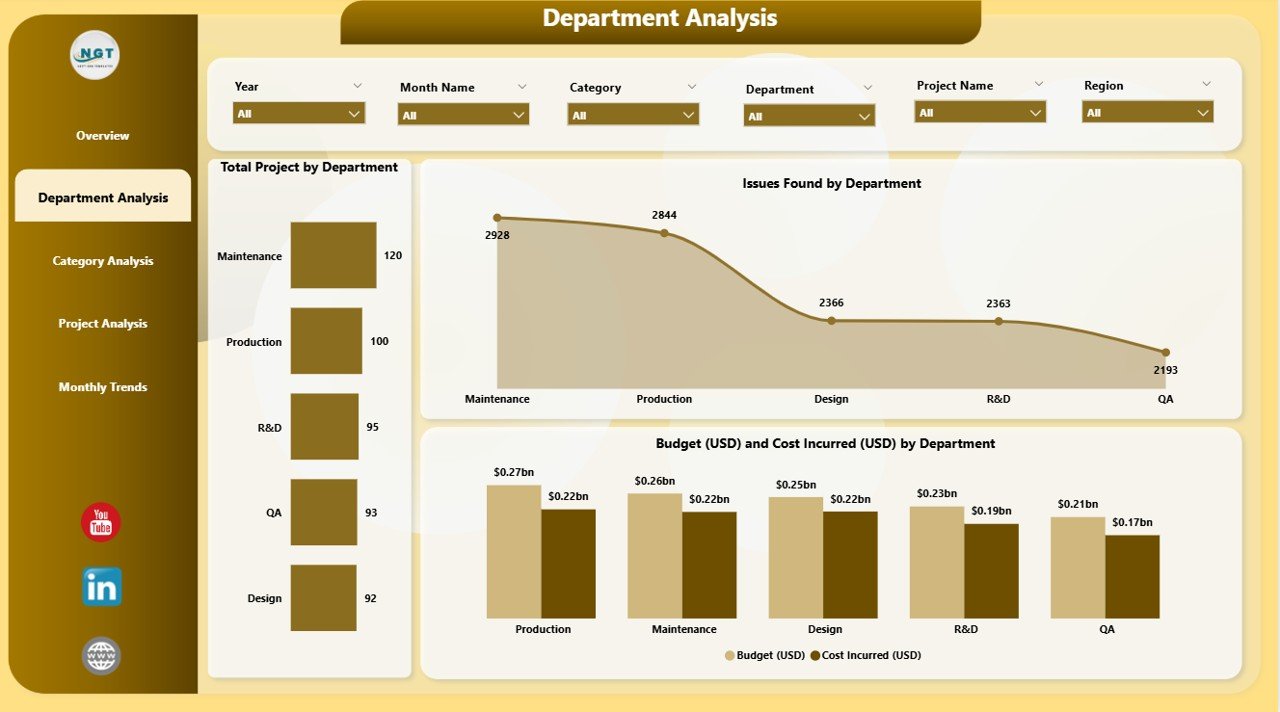
The Department Analysis Page provides a focused view of performance at the departmental level. Every engineering department can have unique challenges, resource demands, and project complexities — and this page captures all of it.
Key Visuals:
-
Total Projects by Department — Shows how workload is distributed among departments.
-
Issues Found by Department — Helps identify recurring problem areas or process inefficiencies.
-
Budget vs Cost Incurred by Department — Tracks how each department is performing against its financial targets.
By visualizing this data, engineering managers can allocate resources better, balance workloads, and improve overall departmental efficiency.
3. Category Analysis Page
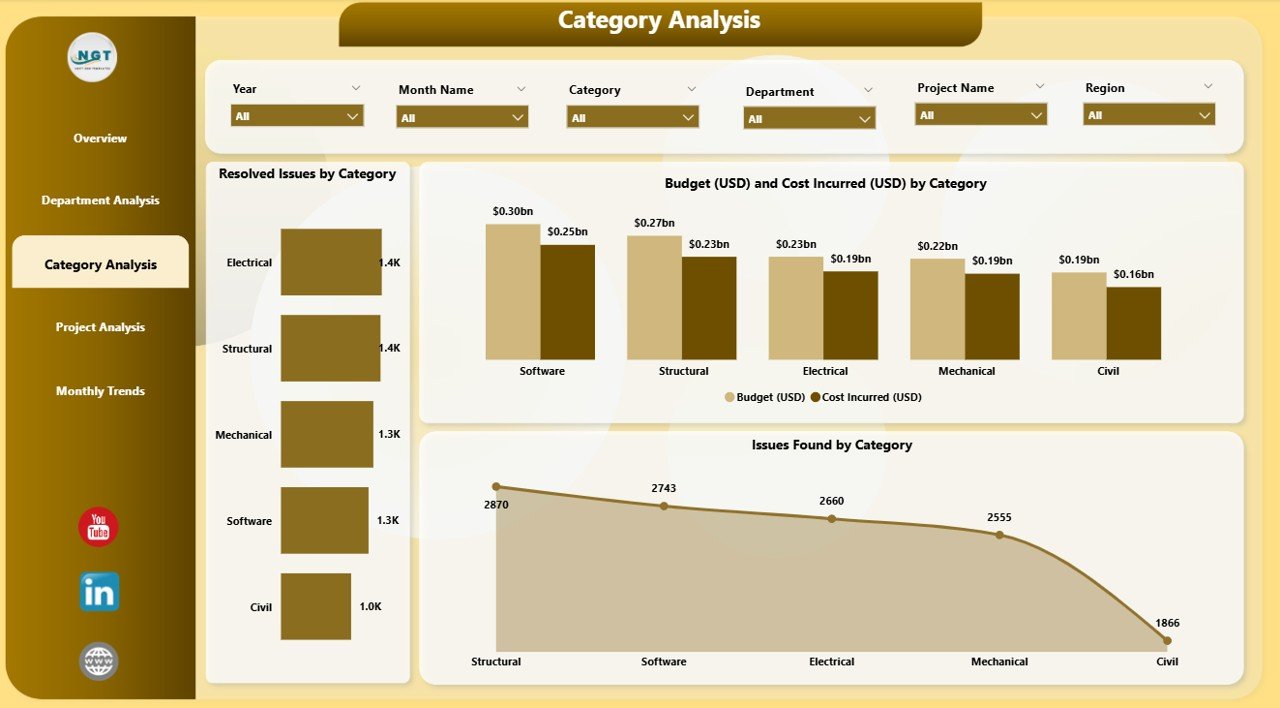
The Category Analysis Page breaks down data by project or issue category, enabling better understanding of which areas contribute most to overall performance.
Highlights:
-
Resolved Issues by Category — Understand which issue types get resolved quickly and which require more attention.
-
Budget (USD) and Cost Incurred (USD) by Category — Monitor spending trends across various project categories.
-
Issues Found by Category — Detect recurring patterns that may signal underlying process weaknesses.
This page is particularly valuable for quality engineers and process improvement teams who need to pinpoint where to focus corrective actions.
4. Project Analysis Page
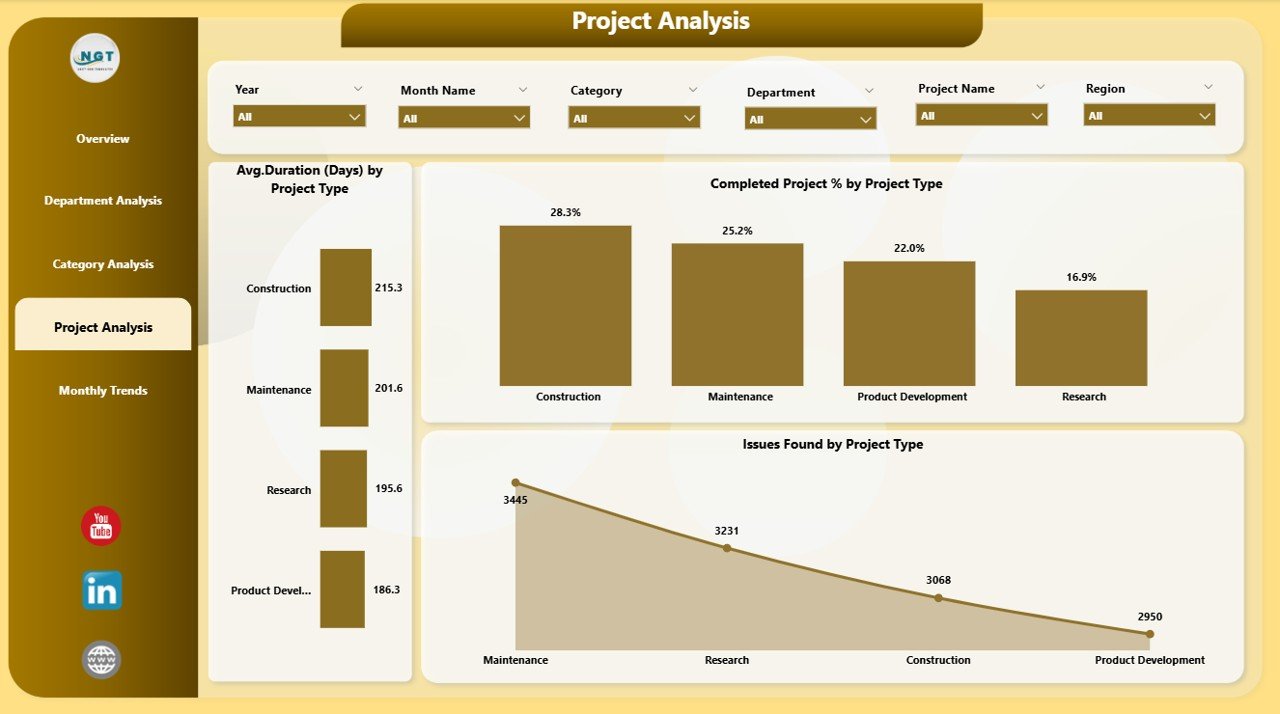
Every engineering organization juggles multiple projects with different timelines, budgets, and risk profiles. The Project Analysis Page provides insights that help teams ensure projects stay on track.
Click to Purchases Engineering Dashboard in Power BI
Visual Components:
-
Average Duration (Days) by Project Type — Measures how long different project types typically take.
-
Completed Project % by Project Type — Tracks completion performance across multiple categories.
-
Issues Found by Project Type — Identifies which project types encounter the most issues.
This page is ideal for project managers who want to compare performance across project types, adjust resource planning, or optimize execution strategies.
5. Monthly Trends Page
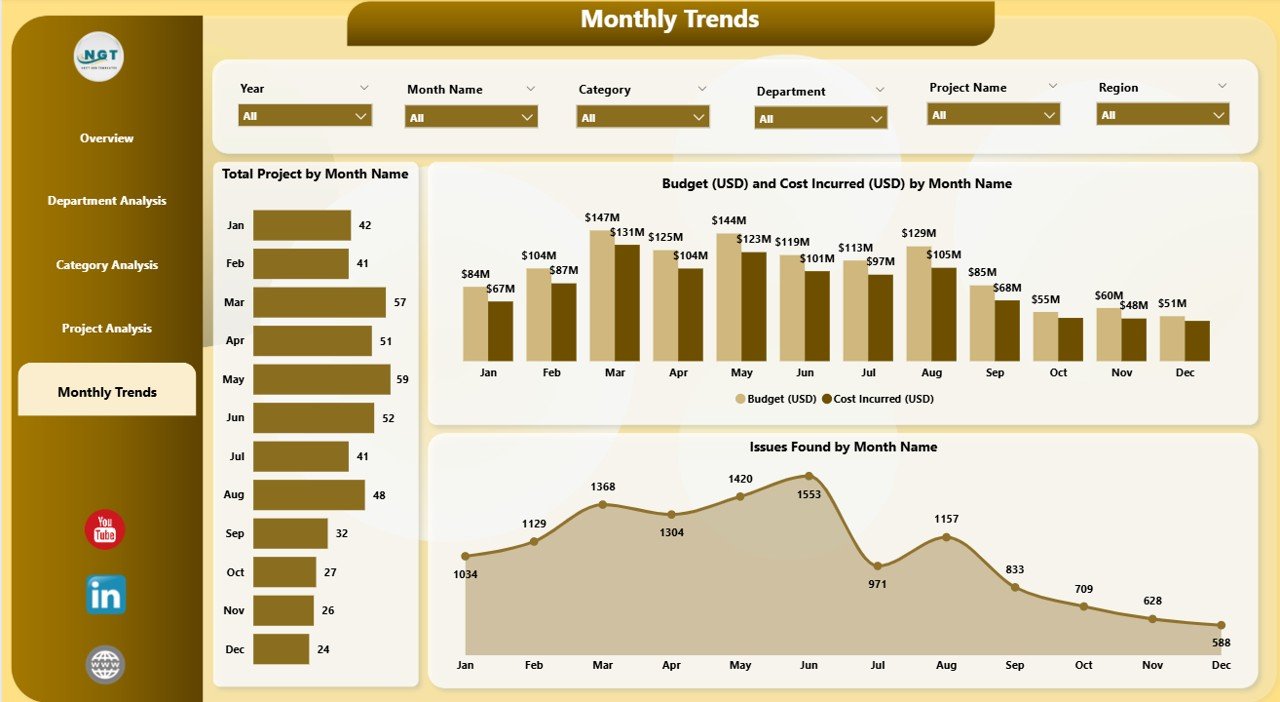
Consistency is key in engineering performance, and that’s where the Monthly Trends Page shines. It provides a temporal view of how performance metrics evolve month by month.
Charts Include:
-
Total Projects by Month — Reveals seasonality or monthly workload distribution.
-
Budget (USD) and Cost Incurred (USD) by Month — Tracks spending trends over time to prevent cost overruns.
-
Issues Found by Month — Helps monitor process stability and identify peak issue periods.
This page makes trend analysis simple — allowing organizations to plan better, forecast accurately, and identify long-term improvement opportunities.
Why Do Engineers and Managers Need a Power BI Dashboard?
Modern engineering teams handle vast amounts of data — from project budgets and timelines to risk assessments and defect logs. However, without proper visualization, data alone cannot drive meaningful decisions.
A Power BI dashboard brings clarity, automation, and interactivity to this process. By integrating with Excel files, project databases, or cloud data sources, it automatically updates visuals and metrics as new data becomes available.
Benefits include:
-
Eliminating manual reporting effort
-
Improving collaboration between engineering, finance, and project teams
-
Enabling real-time insights for quicker decisions
-
Simplifying complex data for all stakeholders
Click to Purchases Engineering Dashboard in Power BI
Advantages of Engineering Dashboard in Power BI
Let’s explore the major benefits that make this dashboard an essential tool for every engineering organization.
1. Real-Time Visibility
With automatic data refresh and interactive visuals, stakeholders always see up-to-date information. This ensures immediate awareness of performance changes.
2. Centralized Performance Tracking
The dashboard consolidates multiple KPIs — from cost tracking to project timelines — into one visual platform, eliminating the need to switch between tools.
3. Enhanced Decision-Making
By visualizing data through graphs, charts, and cards, decision-makers can identify trends and anomalies quickly. Power BI’s drill-through and filtering options add even more depth to analysis.
4. Cost and Budget Control
Comparing Budget vs Actuals allows organizations to detect overruns early and take corrective measures, improving financial discipline.
5. Improved Resource Allocation
Department- and project-level insights help managers allocate manpower, tools, and funds more effectively — leading to optimal use of resources.
6. Reduced Operational Risks
Monitoring High-Risk Project % by region or type ensures risk mitigation before problems escalate.
7. Boosted Accountability and Transparency
Clear visibility across departments fosters a culture of accountability and continuous improvement.
How Power BI Enhances Engineering Analytics
Microsoft Power BI is one of the most powerful business intelligence tools available today. Its capabilities perfectly complement engineering data analysis needs.
Seamless Integration
Power BI connects easily with Excel, SQL databases, and project management tools, pulling all data into a single model.
Customizable Visuals
From KPI cards to complex trend lines, Power BI offers dozens of visuals that make engineering data intuitive and actionable.
AI-Driven Insights
With built-in AI features, users can detect anomalies, forecast future performance, and identify correlations automatically.
User-Friendly Design
Even non-technical users can interact with slicers, filters, and buttons to explore data in their own way.
Scalability
Whether for a small engineering team or a global enterprise, Power BI dashboards scale effortlessly with your data.
Best Practices for the Engineering Dashboard in Power BI
Creating an effective engineering dashboard goes beyond just adding visuals. It requires thoughtful design, data accuracy, and usability. Here are the top best practices to follow:
1. Define Clear Objectives
Start by defining what questions the dashboard should answer. Whether you need to monitor budget usage or issue trends, clear goals keep your design focused.
2. Use Consistent KPIs
Ensure all departments use standardized metrics — such as Project Completion %, Issue Resolution Rate, and Budget Utilization — for accurate comparisons.
3. Keep Visuals Simple
Avoid overcrowding pages with too many visuals. Each chart should communicate one key insight clearly.
4. Maintain Data Quality
Regularly validate data sources to ensure accuracy. Erroneous or outdated data can lead to wrong conclusions.
5. Design for Interactivity
Leverage Power BI features like slicers, drill-throughs, and filters so users can explore data dynamically.
6. Highlight Key Metrics
Use KPI cards and conditional formatting (green/red arrows or traffic-light icons) to draw attention to critical results.
7. Ensure Accessibility
Use intuitive color schemes and legible fonts. Accessibility enhances user adoption across teams.
8. Automate Data Refresh
Schedule automatic refreshes to keep dashboards updated without manual intervention.
9. Optimize for Performance
Reduce unnecessary calculations, simplify queries, and use summarized data to enhance dashboard speed.
10. Collect Feedback
Continuously gather input from users and iterate on design for better usability and relevance.
How to Use the Engineering Dashboard in Power BI
Using this dashboard is straightforward — even for users who are new to Power BI.
-
Open the Dashboard File in Power BI Desktop or Power BI Service.
-
Connect Your Data Source — such as Excel or SQL — to automatically populate visuals.
-
Use Slicers and Filters to explore specific timeframes, departments, or project types.
-
Navigate Between Pages using the page navigator on the left side for an intuitive experience.
-
Export Reports or Snapshots for presentations or management meetings.
This structure ensures that anyone — from engineers to senior management — can gain actionable insights without technical complexity.
Applications of Engineering Dashboards Across Industries
An Engineering Dashboard in Power BI is not limited to one sector. Its versatility makes it useful in various industries:
-
Manufacturing: Track machine downtime, defect rates, and maintenance costs.
-
Construction: Monitor project milestones, safety incidents, and cost deviations.
-
Automotive: Evaluate supplier performance and product development timelines.
-
Energy & Utilities: Analyze project health, budget, and workforce utilization.
-
IT & Software Engineering: Measure sprint velocity, issue backlog, and bug resolution rate.
The adaptability of Power BI makes it a perfect tool for all engineering domains that rely on performance tracking and data-driven decision-making.
Conclusion
The Engineering Dashboard in Power BI is more than just a reporting tool — it’s a powerful strategic asset. By transforming raw data into meaningful insights, it enables engineers, managers, and executives to make informed decisions faster and with greater confidence.
With its five interactive pages — Overview, Department Analysis, Category Analysis, Project Analysis, and Monthly Trends — this dashboard provides a comprehensive view of engineering performance. Whether you want to monitor budgets, detect issues early, or track project timelines, Power BI offers everything you need to streamline engineering operations efficiently.
Investing in a Power BI dashboard today means building a smarter, more agile engineering team tomorrow.
Frequently Asked Questions (FAQs)
1. What is the purpose of an Engineering Dashboard in Power BI?
It helps organizations visualize and monitor key performance indicators such as project completion %, budget utilization, and issue resolution in real time.
2. Can I connect this dashboard to my existing Excel or SQL data?
Yes, Power BI supports seamless integration with Excel, SQL databases, SharePoint, and other data sources for automatic data refresh.
3. Who should use this dashboard?
Engineering managers, project leads, quality teams, and executives who want data-driven insights into engineering performance should use this dashboard.
4. How often should the data be updated?
You can schedule automatic data refresh daily, weekly, or monthly depending on the organization’s reporting needs.
5. Can the visuals be customized?
Absolutely. You can modify chart types, colors, and filters to align with your organization’s reporting preferences.
6. Is Power BI suitable for small engineering firms?
Yes, Power BI is highly scalable. Even small teams can use it to analyze performance efficiently without needing a complex IT setup.
7. What skills are required to use the Engineering Dashboard?
Basic familiarity with Power BI navigation is enough. The dashboard is pre-built and user-friendly, requiring no advanced coding skills.
8. How does this dashboard help reduce project risks?
It highlights High-Risk Project % by region and project type, allowing early identification and mitigation of potential issues.
9. Can I share the dashboard with other team members?
Yes. You can publish it on Power BI Service and share access securely with colleagues.
10. How does it support cost management?
By comparing Budget vs Cost Incurred, it helps organizations monitor spending patterns, prevent overruns, and maintain profitability.
Visit our YouTube channel to learn step-by-step video tutorials


