Running an online business becomes tougher every year because customers expect faster service, better order accuracy, and transparent delivery. Sellers work across multiple online marketplaces such as Amazon, eBay, Walmart, Flipkart, Etsy, and others. Because of this, they struggle to track orders, returns, costs, revenue, ratings, and category performance in one place.
However, you can solve this problem easily with the Online Marketplaces Dashboard in Excel. This dashboard packs all marketplace KPIs into one visual and interactive Excel file. Therefore, teams save time, reduce confusion, and take smarter decisions every day.
In this detailed guide, you will explore everything about the dashboard—its pages, features, benefits, structure, and best practices. You will also understand why every online seller must use this Excel dashboard to stay competitive, profitable, and organized.
Click to Purchases Online Marketplaces Dashboard in Excel
What Is an Online Marketplaces Dashboard in Excel?
An Online Marketplaces Dashboard in Excel is a ready-to-use Excel template that tracks all major KPIs from e-commerce marketplaces. It converts raw order data into easy-to-read charts, insights, and summaries. You can monitor orders, revenue, category performance, ratings, returns, fulfilment types, and monthly trends in one file.
Because this dashboard runs in Excel, you do not need any extra software. You can simply paste your raw data into the Data Sheet and refresh the file. The dashboard updates instantly.
Why Do You Need an Online Marketplaces Dashboard?
Online business performance changes daily. You handle hundreds of transactions, multiple platforms, numerous product categories, and different fulfilment types. Therefore, you need a single system that gives you full visibility.
This dashboard helps you:
-
Compare marketplace performance
-
Identify profitable categories
-
Track returned order %
-
Monitor customer ratings
-
Control rising costs
-
Analyze region-wise performance
-
Understand month-wise growth
-
Improve pricing and sourcing decisions
When you use this dashboard, you grow faster and make more confident decisions.
Key Features of the Online Marketplaces Dashboard in Excel
The dashboard offers powerful analytics across five main pages. Each page includes slicers, charts, KPI cards, and visual insights. Let’s understand each one.
1. Overview Page: Your Main Performance Snapshot
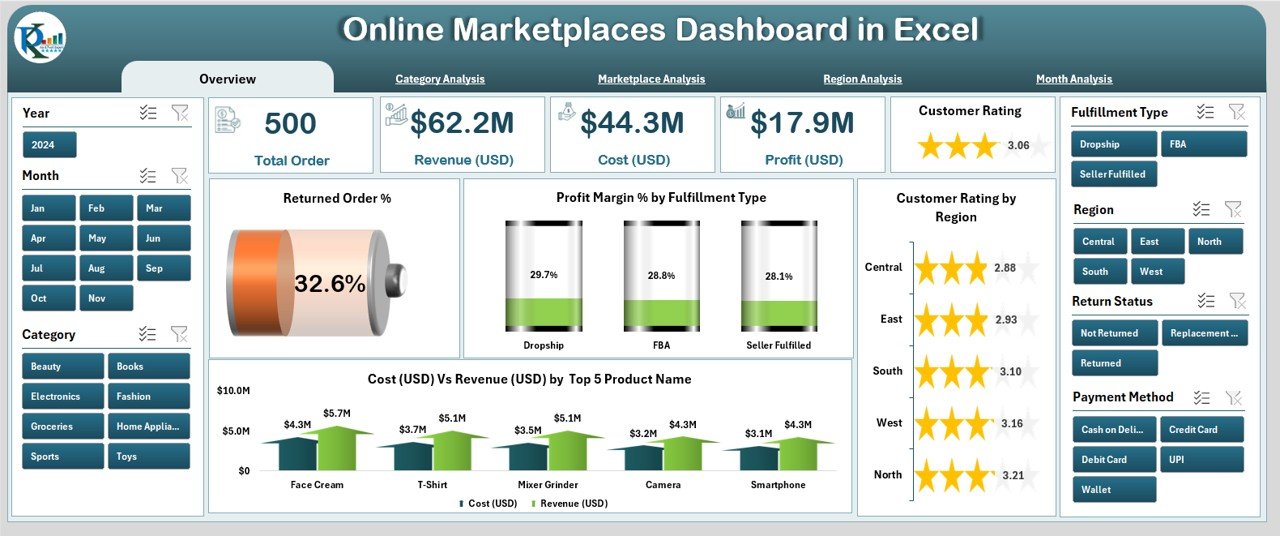
The Overview Page acts as the main control center of the dashboard. It displays the essential KPIs that help you understand your overall business health. You can use the slicer on the right side to filter the entire view.
This page includes five key KPI cards that summarize your performance. These cards display numbers such as Total Orders, Total Revenue, Total Cost, Profit, and Profit Margin %.
You also get four important charts:
✔ Returned Order %
This chart highlights the percentage of orders customers return. A rising return rate signals poor product quality, wrong orders, or shipping problems.
✔ Profit Margin % by Fulfilment Type
You see which fulfilment method—FBA, FBM, third-party logistics, or in-house shipping—gives you the best profits.
✔ Customer Rating by Region
You understand how customers rate your products across different regions. This insight helps you improve delivery speed and service quality.
✔ Cost (USD) vs Revenue (USD) by Top Product Names
This chart shows your top-selling products and compares their cost and revenue. As a result, you identify which products give high profit and which ones drain your margin.
2. Category Analysis: Understand Category-Wise Growth
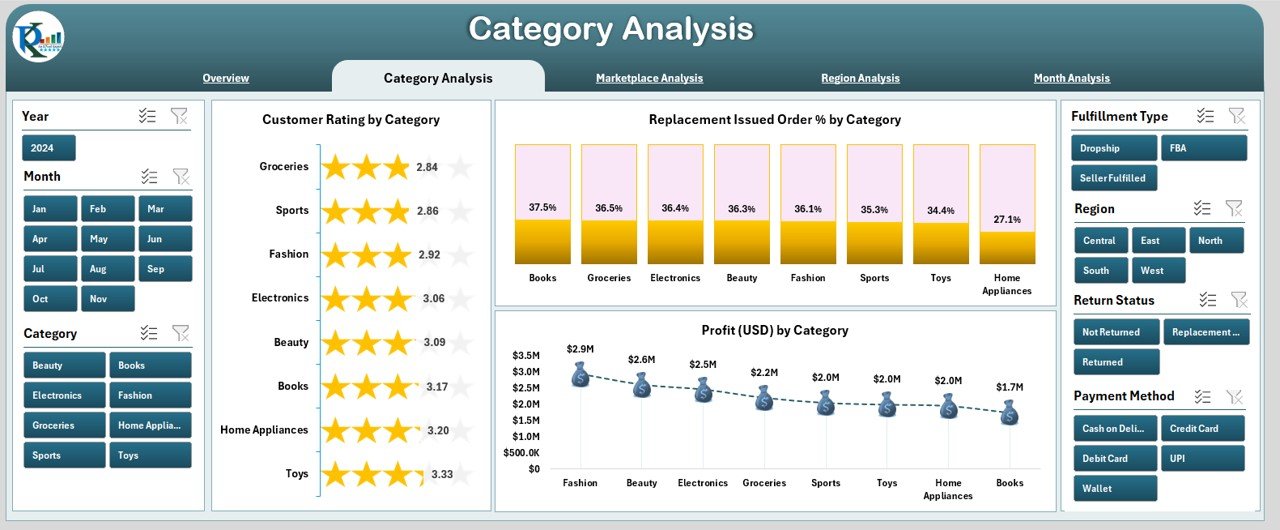
This page shows insights based on product categories. It includes a slicer on the right side for quick filtering.
You get three detailed charts in this section:
Click to Purchases Online Marketplaces Dashboard in Excel
✔ Customer Rating by Category
You understand product satisfaction across all categories. You adjust product quality or descriptions based on this trend.
✔ Replacement Issued Order % by Category
This chart shows categories with high replacement requests. It helps you find and fix issues before they become costly.
✔ Profit (USD) by Category
This chart reveals your most profitable categories. You can use this insight to adjust inventory, marketing, and pricing.
3. Marketplace Analysis: Compare Performance Across Platforms
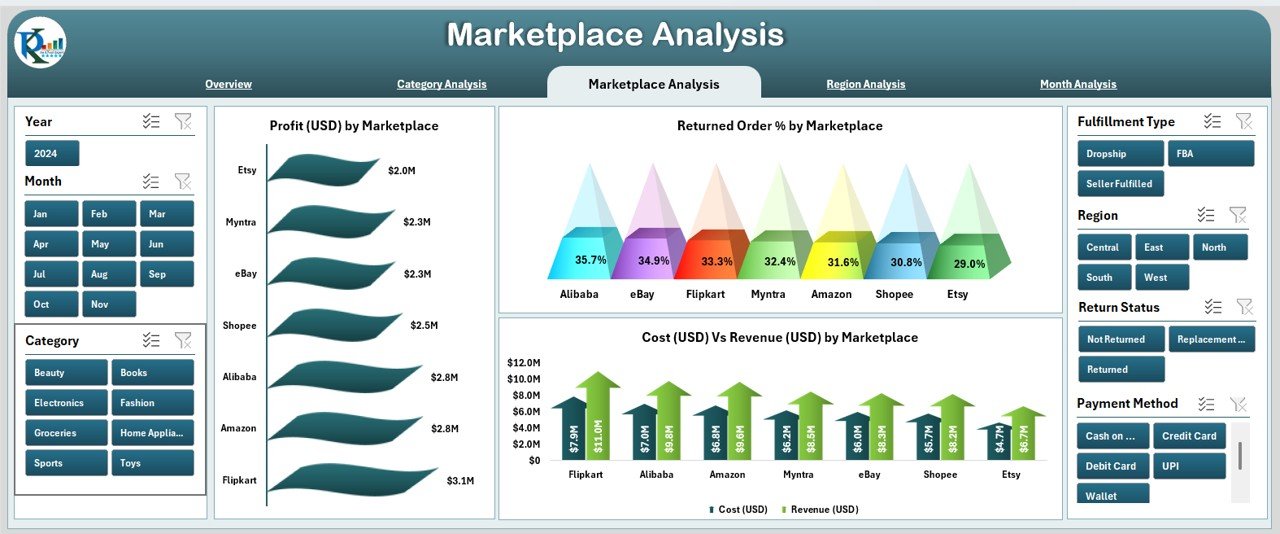
Most sellers operate on multiple online platforms. Therefore, the dashboard includes a complete Marketplace Analysis Page.
You get three insightful charts:
✔ Profit (USD) by Marketplace
You instantly see which marketplace performs best.
✔ Returned Order % by Marketplace
You identify platforms where returns cause losses.
✔ Cost (USD) vs Revenue (USD) by Marketplace
You compare cost and revenue platform-wise for better budgeting and pricing decisions.
This page helps you see which marketplace contributes the most to your bottom line.
4. Region Analysis: Track Territory-Wise Performance
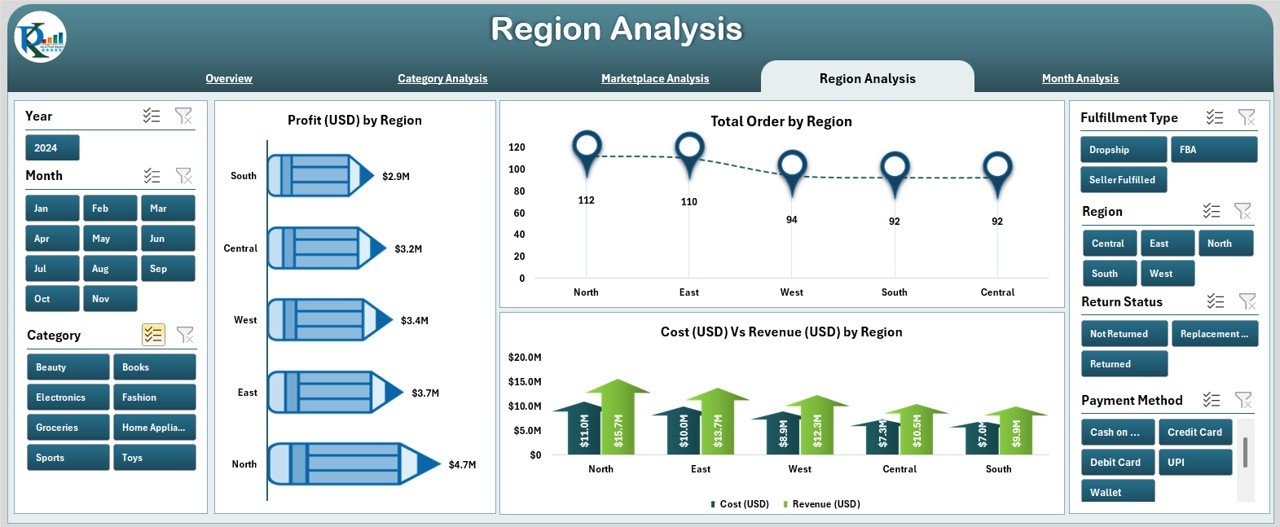
Growth across regions varies. Some regions deliver high sales and great ratings while others struggle with returns or delays. The Region Analysis Page helps you analyze all these metrics.
You get three charts:
✔ Profit (USD) by Region
This chart helps you understand which region drives maximum profit.
✔ Total Orders by Region
You see order volume distribution across different geographic locations.
✔ Cost (USD) vs Revenue (USD) by Region
You identify regions where costs increase and margins shrink. Therefore, you improve logistics and sourcing strategies.
5. Month Analysis: Track Growth Month-by-Month
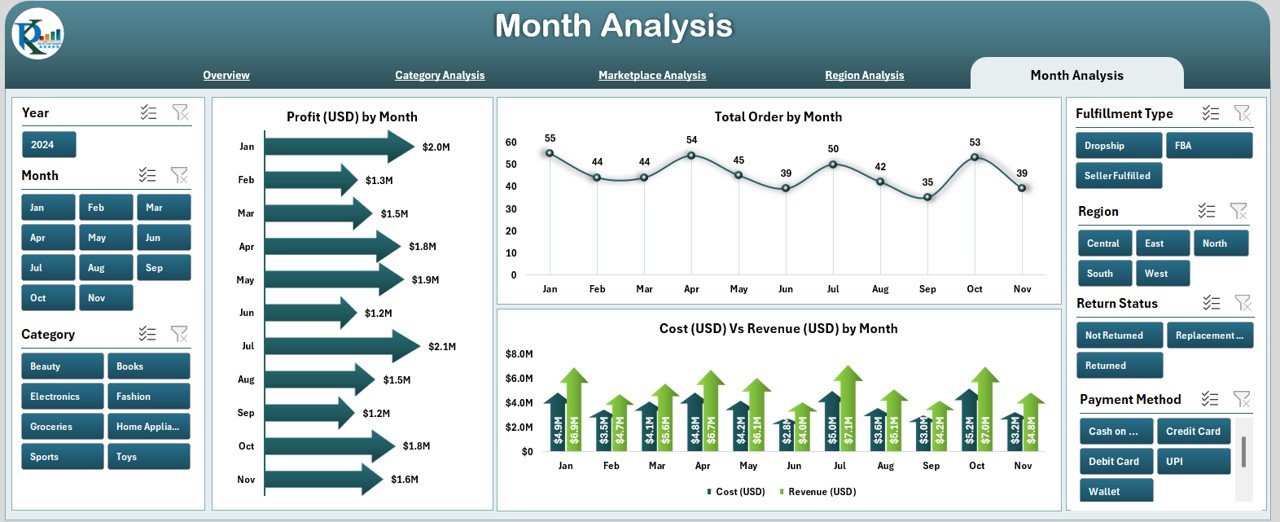
The Month Analysis Page helps you compare monthly performance trends. A slicer is available for deeper filtering.
This page includes three major charts:
✔ Profit (USD) by Month
You understand seasonal changes and monthly profitability patterns.
✔ Total Orders by Month
This chart highlights sales trends throughout the year.
✔ Cost (USD) vs Revenue (USD) by Month
You track how your spending and earnings shift every month.
This page supports forecasting and planning for upcoming seasons.
Support Sheet and Data Sheet
Click to Purchases Online Marketplaces Dashboard in Excel
✔ Support Sheet
This sheet includes color codes, drop-down values, theme settings, and backend support elements that keep the dashboard running smoothly.
✔ Data Sheet
This sheet stores all raw order data. You simply paste your data here, refresh the pivot tables, and the dashboard updates instantly.
How Does This Online Marketplaces Dashboard Help Your Team?
Your team gets everything in one place—performance trends, customer behavior, category insights, and marketplace comparison. You reduce manual reporting hours and rely on real-time numbers. Every team member sees the same data; therefore, decisions become faster and more aligned.
What Are the Advantages of an Online Marketplaces Dashboard in Excel?
This dashboard offers several strong advantages:
⭐ 1. Full Visibility Across All Marketplaces
You see all metrics from Amazon, eBay, Etsy, Walmart, and other platforms in a single file.
⭐ 2. Better Control Over Returns and Replacements
You understand return reasons category-wise, marketplace-wise, and region-wise.
⭐ 3. Improved Profitability Decisions
Charts highlight profit margin % clearly. This helps you identify high-profit products instantly.
⭐ 4. Faster Decision-Making
You do not waste time preparing reports. You focus more on growing the business.
⭐ 5. Easy to Use for Any Team Member
The dashboard runs in Excel, so anyone can use it without special training.
⭐ 6. Better Forecasting
The Month Analysis section shows seasonal trends. You plan stock levels and marketing activities.
⭐ 7. Clear Category and Region Insights
You understand which categories and regions drive revenue and which require improvement.
Best Practices for Using the Online Marketplaces Dashboard in Excel
To get the best results, follow these proven practices:
✔ 1. Keep Your Data Sheet Clean
Use consistent date formats, product names, and marketplace codes. This makes analytics accurate.
✔ 2. Refresh the Dashboard Daily or Weekly
Regular updates help you track freshness of data and make fast decisions.
✔ 3. Use Slicers for Deep Insights
Try different slicers such as category, region, or marketplace to find hidden patterns.
✔ 4. Compare Profit vs Cost Regularly
Regular checks help you identify low-margin products.
✔ 5. Review Customer Ratings Frequently
Ratings affect marketplace rankings. Use insights to improve product quality.
✔ 6. Track Monthly Trends for Planning
Seasonal spikes and drops help you plan stock and promotions.
✔ 7. Highlight Problem Areas
Use conditional formatting to highlight categories or regions that struggle.
✔ 8. Keep Backup Copies of Your Data Sheet
A clean data history supports long-term trend analysis.
Conclusion
The Online Marketplaces Dashboard in Excel gives online sellers a complete view of their business. You see category-wise performance, marketplace comparison, monthly profit, customer ratings, returned order %, and more. Every chart helps you understand your business better and take smarter decisions.
Since the dashboard runs in Excel, you get complete control, full customization, and zero dependency on expensive software. You save time, reduce errors, and improve profitability continuously.
When you use this dashboard regularly, you run your online marketplace business with more confidence, more clarity, and more speed.
Frequently Asked Questions (FAQs)
1. What data do I need to use this dashboard?
You only need order-level details such as product name, category, marketplace, region, revenue, cost, rating, and return status.
2. Can beginners use this dashboard easily?
Yes. Anyone with basic Excel knowledge can use the dashboard because the interface is simple and visual.
3. Can I customize the charts?
Yes. You can modify chart colors, add new KPIs, or insert new visual elements based on your needs.
4. How often should I update the Data Sheet?
You can update it daily, weekly, or monthly depending on your business size and reporting needs.
5. Does the dashboard support multiple marketplaces?
Yes. It supports any marketplace—Amazon, Etsy, eBay, Walmart, Flipkart, Shopify, and more.
6. Can I use this dashboard for forecasting?
Yes. The Month Analysis page helps you spot seasonal trends and plan stock levels.
7. Will this dashboard help reduce returns?
Yes. You can track return % category-wise, region-wise, and marketplace-wise and fix those issues.
Visit our YouTube channel to learn step-by-step video tutorials