The cleaning industry grows fast, and service providers deal with daily challenges such as managing teams, tracking client satisfaction, monitoring service performance, maintaining profit margins, and keeping up with costs. Because of these demands, cleaning companies need a smart and simple way to analyze their operations. A Cleaning Services Dashboard in Power BI offers this solution.
This guide explains what this dashboard does, how each page works, why every cleaning business needs it, and how you can use it to improve decision-making. Since the dashboard runs in Power BI, you get real-time insights, automated visuals, interactive filters, and mobile-friendly reporting.
Let’s explore everything step-by-step.
Click to Purchases Cleaning Services Dashboard in Power BI
What Is a Cleaning Services Dashboard in Power BI?
A Cleaning Services Dashboard in Power BI is an advanced analytics tool designed for commercial cleaning companies, residential cleaning services, facility maintenance firms, janitorial agencies, deep cleaning teams, and on-demand cleaning platforms.
The dashboard brings all data into one place. It analyzes service performance, customer satisfaction, team performance, costs, revenue, profitability, service type trends, regional variations, and client segments. Users gain complete visibility and make smart decisions faster.
Since Power BI supports slicers, filters, charts, KPIs, and automated calculations, businesses get a dynamic and real-time view of operations.
Why Do Cleaning Companies Need a Power BI Dashboard?
Cleaning companies handle multiple tasks daily. They must track service quality, manage different teams, monitor costs, and ensure high client retention. However, manual reports take time and often lead to mistakes.
A Power BI dashboard solves this issue, and it offers many benefits:
-
It centralizes all service data.
-
It provides real-time performance insights.
-
It tracks profit and cost trends clearly.
-
It improves team monitoring and resource planning.
-
It helps cleaning managers spot issues before they grow.
Because of these advantages, cleaning companies use Power BI dashboards as their core reporting tool.
Key Features of the Cleaning Services Dashboard in Power BI
This dashboard contains five interactive pages, and each page gives a unique perspective on the cleaning operations.
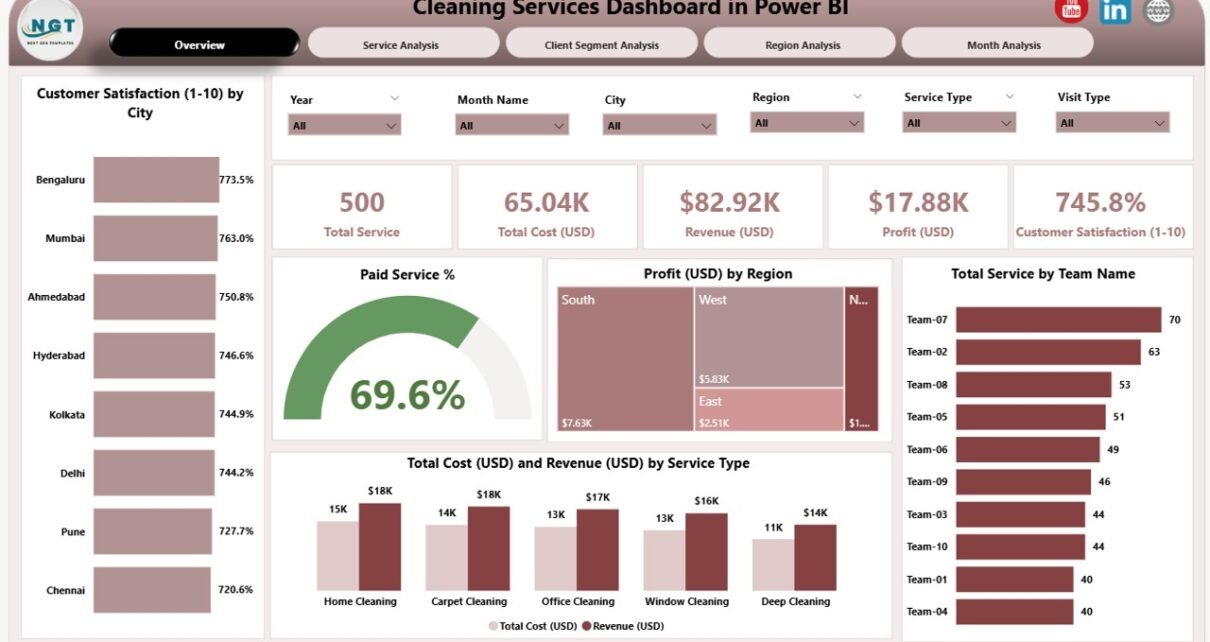
1. Overview Page – Complete Business Summary
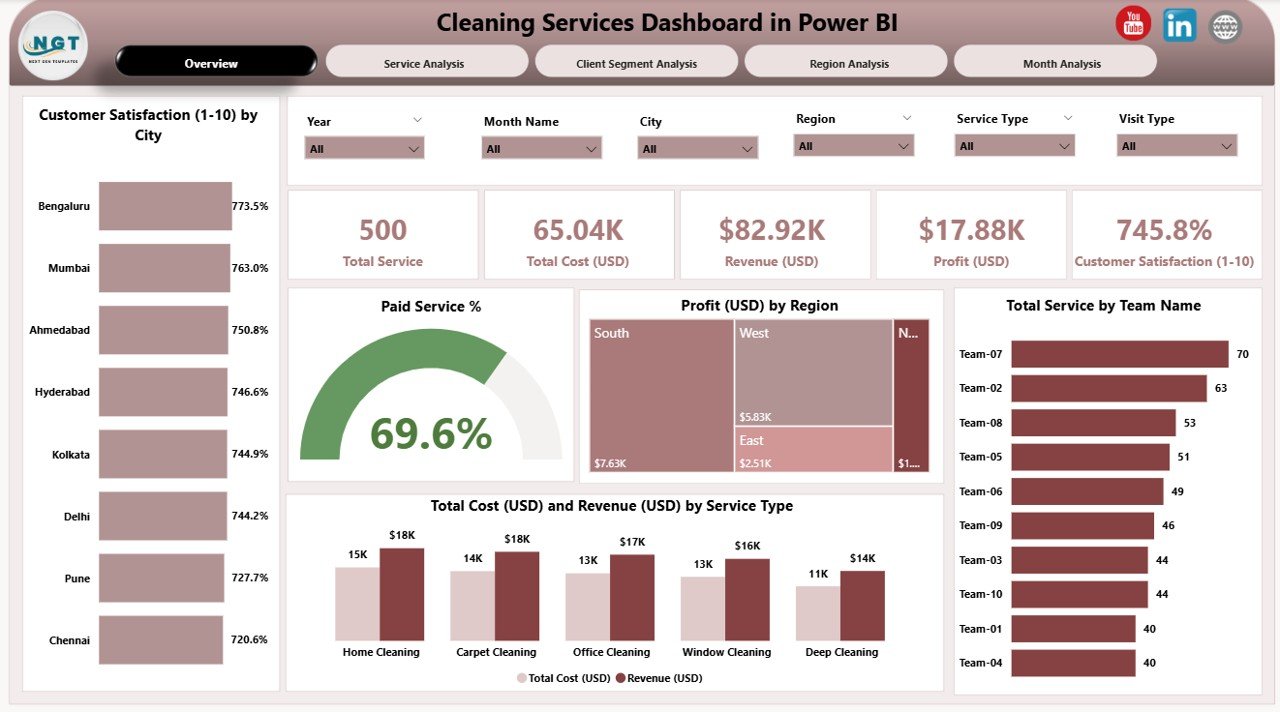
The Overview Page acts as the master screen of the dashboard. It gives decision-makers a fast and clear summary of the most important KPIs.
What you see on the Overview Page
-
Four KPI cards
-
Multiple slicers for analysis
-
Five high-impact charts
The four KPI cards show:
-
Total Customer Satisfaction Score
-
Paid Service Percentage
-
Profit (USD)
-
Total Service Volume
The five charts include:
-
Customer Satisfaction by City
-
Paid Service %
-
Profit (USD) by Region
-
Total Service by Team Name
-
Total Cost (USD) and Revenue (USD) by Service Type
This page answers questions like:
-
Which city has the highest satisfaction score?
-
Which service type generates more revenue?
-
Which team delivers the most services?
-
Where does the company earn the highest profit?
The slicers allow users to filter by month, city, service type, region, or team name. Because of this flexibility, managers understand performance at a glance.
2. Service Analysis Page – Understanding Service-Level Performance
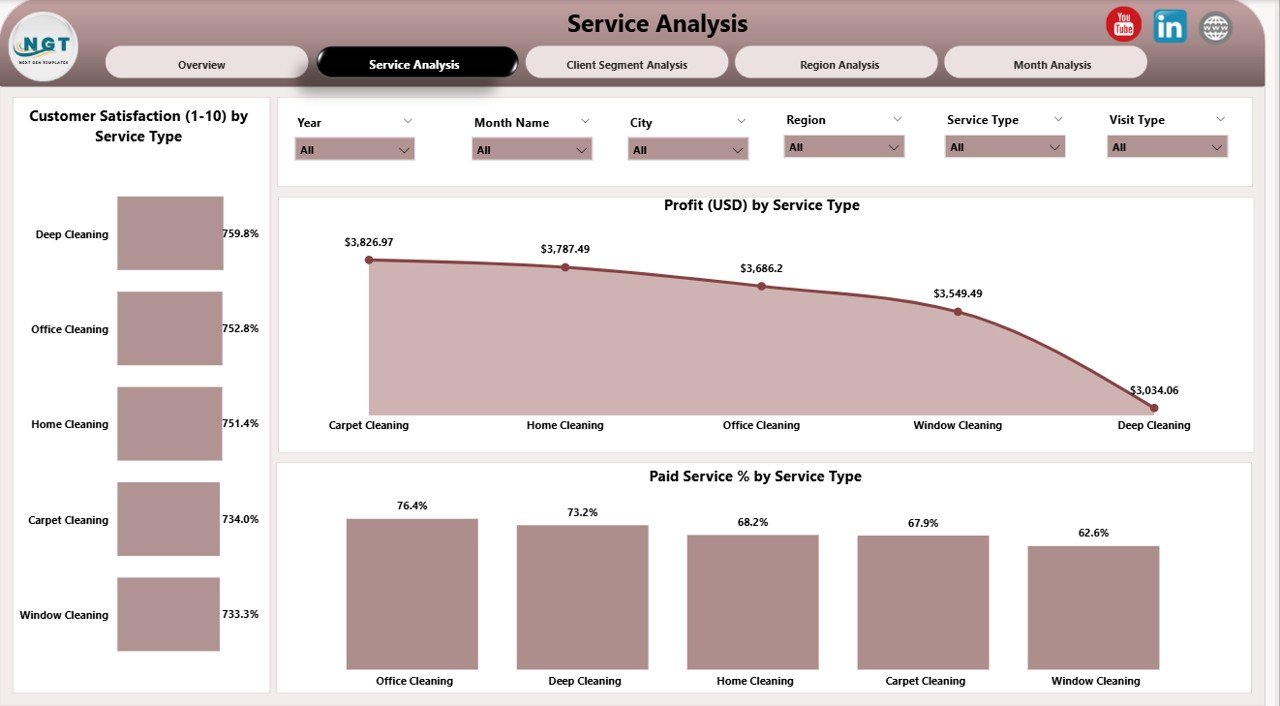
The Service Analysis Page focuses on performance by service type. Cleaning companies offer multiple services such as window cleaning, deep cleaning, carpet shampooing, disinfection, housekeeping, and post-construction cleaning. Each category behaves differently.
The Service Analysis Page includes three main charts:
-
Customer Satisfaction by Service Type
-
Paid Service % by Service Type
-
Profit (USD) by Service Type
This page answers questions like:
-
Which service type gives the highest satisfaction?
-
Which service type generates the highest profit?
-
Which services receive more paid service conversions?
Because this page highlights performance gaps instantly, managers can adjust pricing, improve specific services, or invest more in profitable categories.
Click to Purchases Cleaning Services Dashboard in Power BI
3. Client Segment Analysis – Tracking Client Behavior
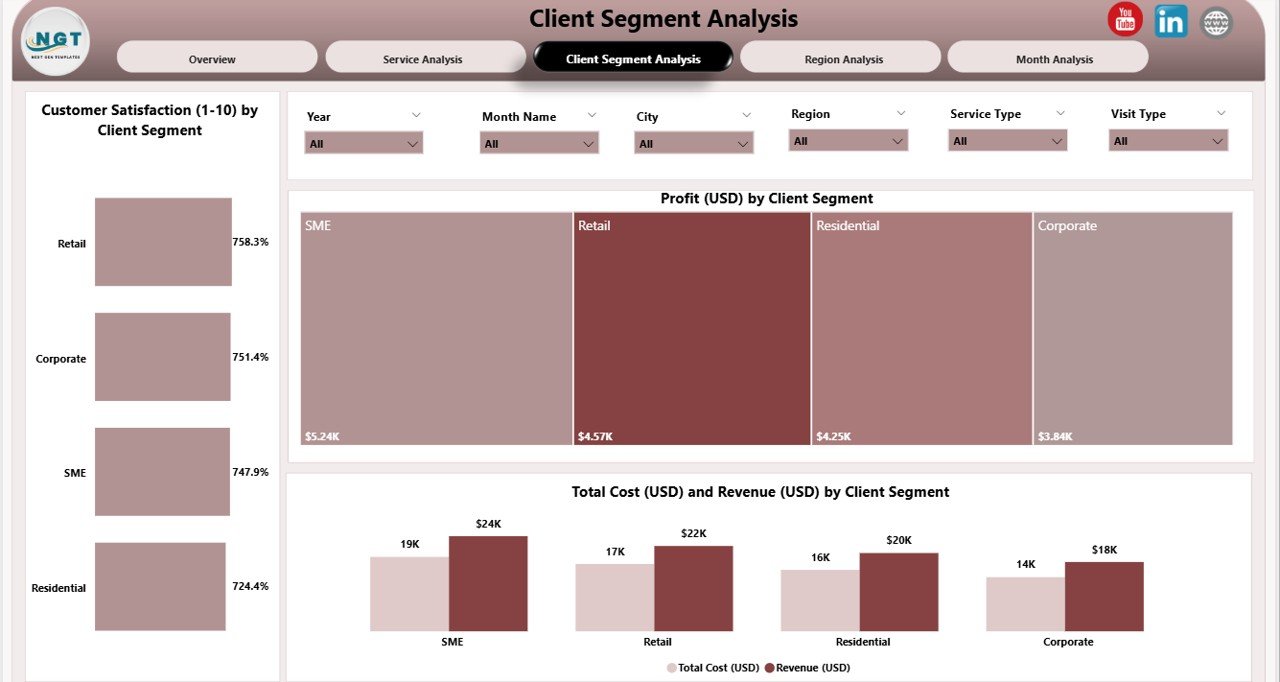
Cleaning companies serve different client segments:
-
Residential customers
-
Corporate offices
-
Hotels
-
Hospitals
-
Retail stores
-
Industrial clients
Each segment behaves differently in terms of satisfaction, revenue, and service usage.
Charts available on this page:
-
Customer Satisfaction by Client Segment
-
Profit (USD) by Client Segment
-
Paid Service % by Client Segment
This page answers important questions like:
-
Which segment delivers the highest profit?
-
Which client group has low satisfaction and needs quality improvement?
-
Which segment books more paid services?
Because client segmentation drives strategy, this page helps you plan marketing, team allocation, and service improvement.
4. Region Analysis – Comparing Regions and Locations
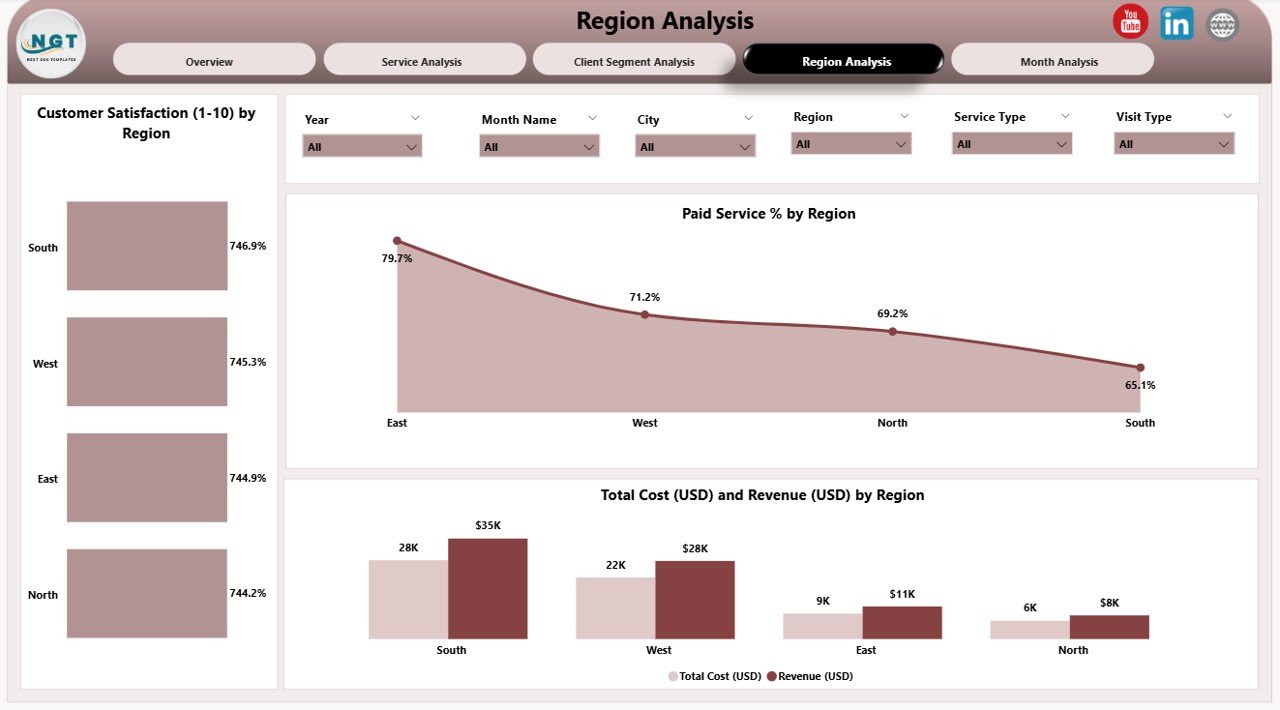
Cleaning service companies often operate across multiple locations or regions. Performance varies based on customer demand, competition, and economic conditions.
The Region Analysis Page contains three powerful charts:
-
Customer Satisfaction by Region
-
Total Cost (USD) and Revenue (USD) by Region
-
Paid Service % by Region
This page answers:
-
Which region has high revenue but high cost?
-
Which region performs better in satisfaction?
-
Which region needs more sales support?
Since Power BI dashboards allow dynamic region filtering, you understand the strengths and weaknesses of each location instantly.
5. Monthly Trends Page – Tracking Performance Over Time
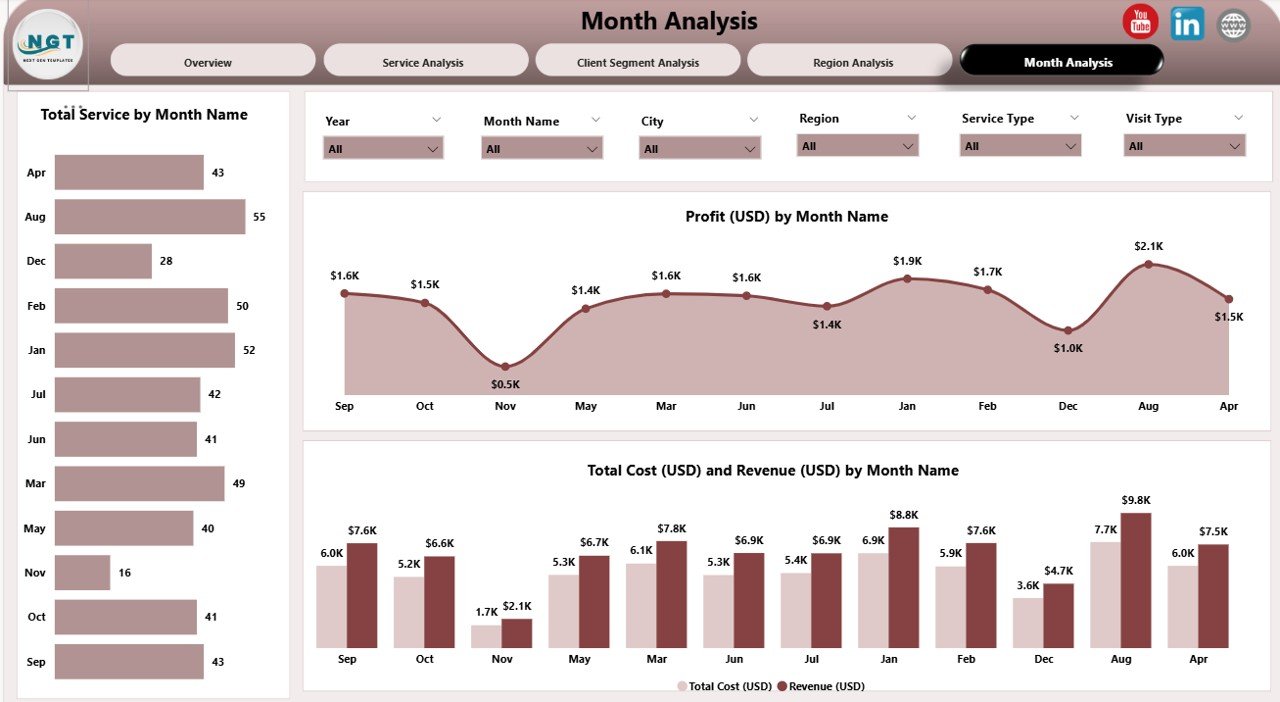
The Monthly Trends Page focuses on time-based analysis. It shows how the business performs month by month.
Charts available:
-
Total Service by Month
-
Total Cost (USD) by Month
-
Revenue (USD) by Month
-
Paid Service (USD) by Month
This page answers:
-
When does service demand increase or decrease?
-
Which month brings more profit?
-
Are costs rising faster than revenue?
-
How does seasonal demand impact cleaning services?
Because it provides trend analysis, this page helps managers plan resources and budgets better.
Advantages of Cleaning Services Dashboard in Power BI
The dashboard offers several strong benefits for cleaning companies. Let’s explore them.
1. Real-Time Decision-Making
Managers get live updates on services, costs, satisfaction, and profits. They make decisions quickly and confidently.
2. Improved Client Satisfaction
Because companies track feedback across cities, service types, and segments, they improve weak areas faster.
3. Smart Resource Allocation
Team performance data helps managers allocate teams based on demand and skill.
4. Better Profitability Management
Users track profit by service type, region, and client segment. This helps them shift focus to more profitable areas.
5. Accurate Trend Forecasting
Monthly data helps identify seasonal peaks and dips, making forecasting easier.
6. Reduced Operational Costs
Managers spot high-cost regions or services. This helps them plan better and reduce unnecessary expenses.
7. Increased Transparency Across Departments
Everyone sees the same data, which improves teamwork and accountability.
8. Faster Reporting
This dashboard eliminates manual reporting. It saves hours of repetitive tasks each week.
How the Cleaning Services Dashboard Supports Business Growth
This dashboard does more than show numbers. It guides cleaning companies toward growth and efficiency.
1. Enhances Service Quality
Managers improve low-performing areas quickly by tracking satisfaction.
2. Boosts Customer Retention
Satisfied customers stay longer and purchase more services.
3. Strengthens Employee Performance
Team performance insights encourage healthy competition and training.
4. Helps in Strategic Planning
Leaders make long-term decisions using clear data trends.
5. Supports Marketing Campaigns
Segment-level insights help create targeted marketing strategies.
Because every insight contributes to business growth, the dashboard becomes a core tool for cleaning companies.
Best Practices for Using the Cleaning Services Dashboard in Power BI
Follow these best practices to get the maximum value from your dashboard.
1. Refresh Your Data Daily
Daily updates ensure that the dashboard always shows accurate and updated insights.
2. Use Slicers for Deep Analysis
Slicers help filter data by region, month, service type, or segment. This makes your analysis faster.
3. Track Leading and Lagging KPIs
Leading KPIs: Customer satisfaction, paid service %, active clients
Lagging KPIs: Revenue, cost, profit
Both types help you adjust your strategy.
4. Compare Year-over-Year Trends
YoY comparisons show long-term performance improvement.
5. Share Dashboards with Teams
Team leaders, supervisors, and managers should use the dashboard to stay aligned.
6. Customize the Dashboard as Your Business Grows
Add new visuals, KPIs, or pages whenever your business expands.
7. Ensure Data Accuracy
Clean data forms the foundation of accurate reporting. Remove duplicates or errors regularly.
8. Review Monthly Trends Carefully
Seasonal trends impact cleaning demand. Use these insights for planning manpower.
9. Use Mobile View for Field Teams
Power BI mobile view allows supervisors to monitor data on the move.
10. Automate Alerts for Critical Metrics
Set alerts for low satisfaction, rising costs, or dropping profits.
How to Implement the Cleaning Services Dashboard Successfully
Follow these steps for smooth implementation:
1. Collect All Service Data
Ensure you include service type, region, cost, revenue, satisfaction, and segment data.
2. Clean and Organize Data
Arrange data in Excel, SQL server, or another source before loading it into Power BI.
3. Build Data Models
Create relationships between service, cost, client, and team tables.
4. Design Visuals
Choose correct charts like bar graphs, line charts, donut charts, KPI cards, and area charts.
5. Apply Slicers
Add filters for city, region, team, service type, month, or client segment.
6. Test the Dashboard
Ensure accuracy before sharing with the team.
7. Publish and Share
Share the dashboard through Power BI Service and set automatic refresh.
Conclusion
A Cleaning Services Dashboard in Power BI gives cleaning companies the power to analyze performance, improve service quality, track profitability, and build strong client relationships. Because the dashboard offers real-time insights across five analytical pages—Overview, Service Analysis, Client Segment Analysis, Region Analysis, and Monthly Trends—decision-makers understand every part of the business clearly.
When cleaning companies use this dashboard regularly, they plan smarter, reduce costs, improve satisfaction, and grow faster. This dashboard becomes the heart of data-driven cleaning service management.
Frequently Asked Questions (FAQs)
Click to Purchases Cleaning Services Dashboard in Power BI
1. What is a Cleaning Services Dashboard in Power BI?
It is an analytical tool that tracks service performance, client satisfaction, profits, costs, and trends for cleaning companies using interactive charts and data models.
2. Who can use this dashboard?
Commercial cleaning services, home cleaning providers, facility management firms, janitorial agencies, and on-demand cleaning platforms can use it.
3. Why is Power BI useful for cleaning companies?
Power BI offers automated visuals, real-time insights, mobile access, and easy filtering. This helps managers take quick data-driven decisions.
4. What KPIs does the dashboard track?
It tracks customer satisfaction, service volume, paid service %, cost, revenue, and profit.
5. Can I customize the dashboard?
Yes. Power BI allows full customization. You can add new pages, visuals, KPIs, or segments anytime.
6. Does this dashboard reduce manual work?
Yes. It eliminates the need for manual Excel reports and provides automated real-time dashboards.
7. Can field teams use this dashboard?
Yes. Power BI supports mobile view, which makes it easy for field supervisors to access data anywhere.
Visit our YouTube channel to learn step-by-step video tutorials