Investor services teams handle high-value clients, manage complex data, and deliver timely reports. They track investor onboarding, transaction processing, compliance activities, reporting timelines, and overall service efficiency. Because of this, they require accurate, structured, and real-time information.
However, many teams still depend on scattered spreadsheets. This slows down reporting, increases confusion, and limits performance visibility.
A Investor Services KPI Dashboard in Excel solves these challenges. It brings every KPI into one easy-to-use dashboard. You track MTD, YTD, target achievements, previous year comparisons, and trends in a clear and structured way. You also update the dashboard by entering numbers in simple input sheets.
This guide explains everything about this dashboard—its structure, worksheets, benefits, best practices, and more.
Click to Purchases Investor Services KPI Dashboard in Excel
What Is an Investor Services KPI Dashboard in Excel?
An Investor Services KPI Dashboard in Excel is a ready-to-use performance management tool. It transforms raw operational data into meaningful insights. You select a month, and the dashboard instantly updates all numbers for:
-
MTD Actual
-
MTD Target
-
MTD Previous Year
-
YTD Actual
-
YTD Target
-
YTD Previous Year
You also get trend charts, KPI definitions, and user-friendly navigation buttons.
This dashboard helps:
-
Asset management firms
-
Investor relations teams
-
Fund administration departments
-
Investment operations teams
-
Portfolio service units
-
Back-office operations
Because the dashboard runs in Excel, teams use it easily without technical training.
Click to Purchases Investor Services KPI Dashboard in Excel
Key Features of the Investor Services KPI Dashboard in Excel
This dashboard includes seven well-structured worksheets, each designed to support reporting and monitoring.
1. Home Sheet
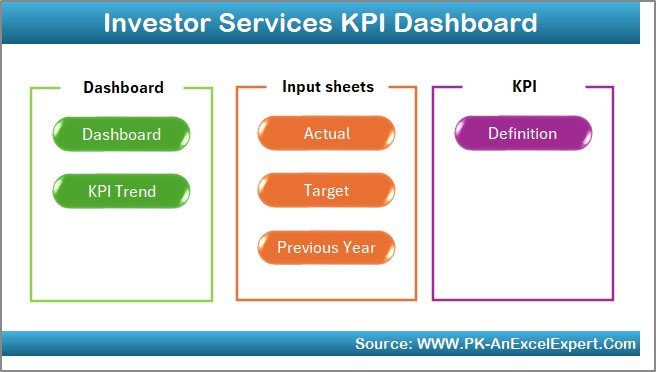
The Home sheet acts as the index page. You get six buttons that allow smooth navigation to all important sheets. This makes the dashboard user-friendly and ideal for teams that manage multiple KPIs.
You jump to:
-
Dashboard
-
KPI Trend
-
Actual Numbers Input
-
Target Sheet
-
Previous Year Sheet
-
KPI Definition
This structure keeps the file clean and organized.
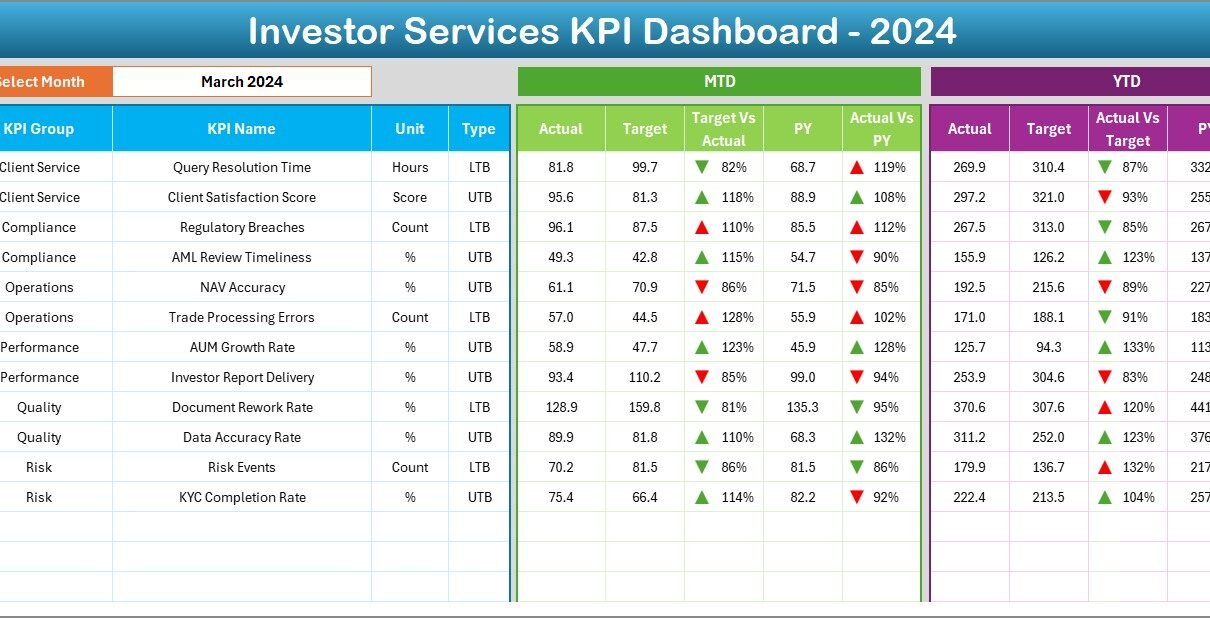
2. Dashboard Sheet – Main KPI Performance View
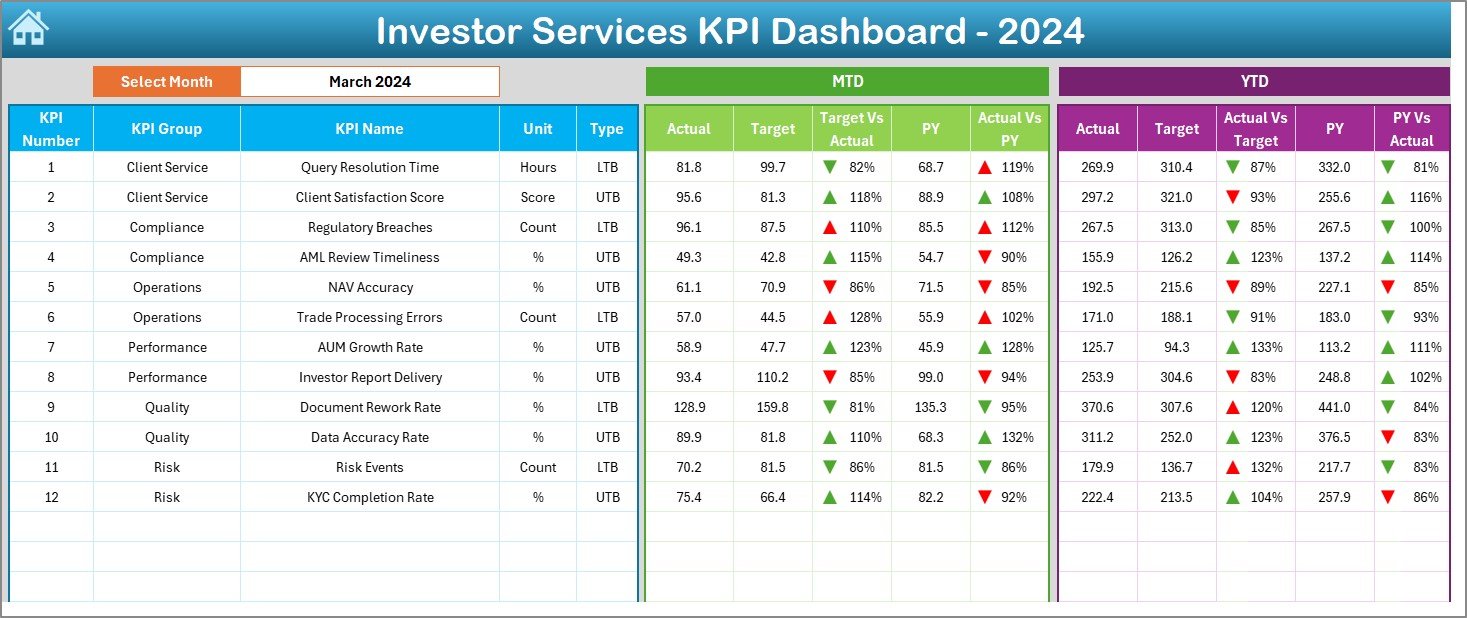
The Dashboard sheet works as the central hub of analysis. All KPI numbers and visuals appear here.
Month Drop-Down Filter
You select the reporting month from cell D3. The dashboard refreshes instantly.
MTD Performance View
The dashboard shows:
-
Actual
-
Target
-
Previous Year
-
Target vs Actual (%)
-
PY vs Actual (%)
Conditional formatting uses up and down arrows to mark good or poor performance.
YTD Performance View
You see:
-
YTD Actual
-
YTD Target
-
YTD Previous Year
-
Target vs Actual (%)
-
PY vs Actual (%)
The dashboard shows both sections side by side, which helps you understand the full performance picture.
Click to Purchases Investor Services KPI Dashboard in Excel
3. KPI Trend Sheet
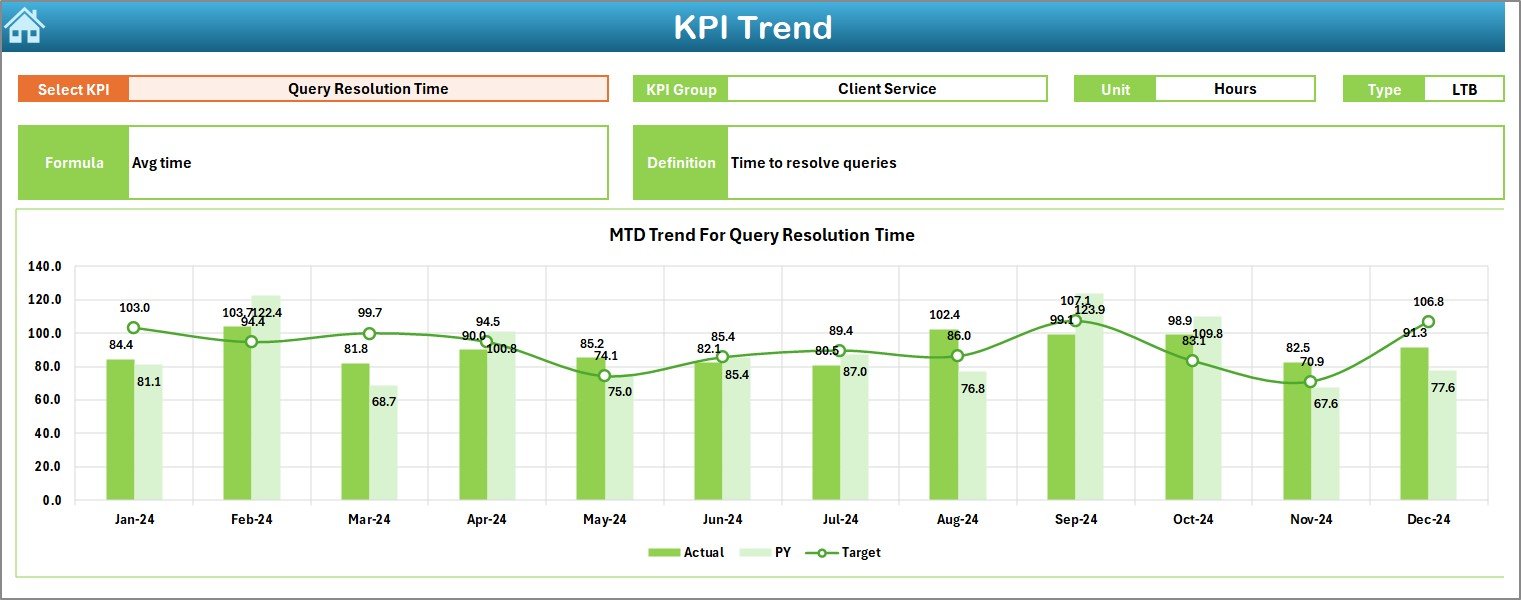
The KPI Trend sheet gives a deeper look into every KPI.
KPI Selection Drop-Down
You select a KPI from cell C3. The sheet then displays:
-
KPI Group
-
KPI Unit
-
KPI Type (LTB or UTB)
-
KPI Formula
-
KPI Definition
Trend Charts
You see two charts:
-
MTD Trend (Actual, Target, PY)
-
YTD Trend (Actual, Target, PY)
These charts reveal improvement patterns, seasonal behaviour, and performance gaps.
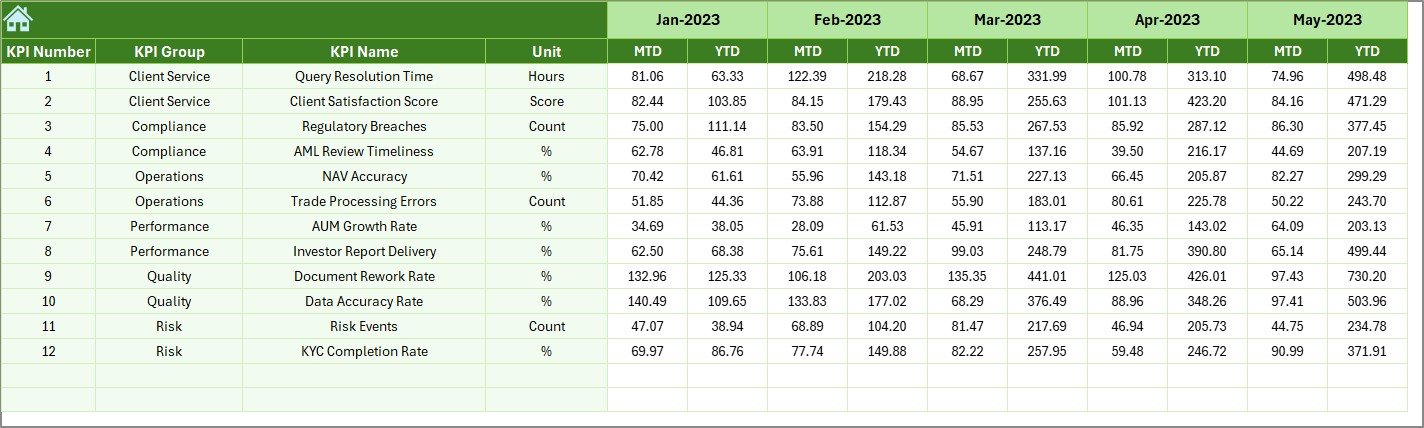
4. Actual Numbers Input Sheet
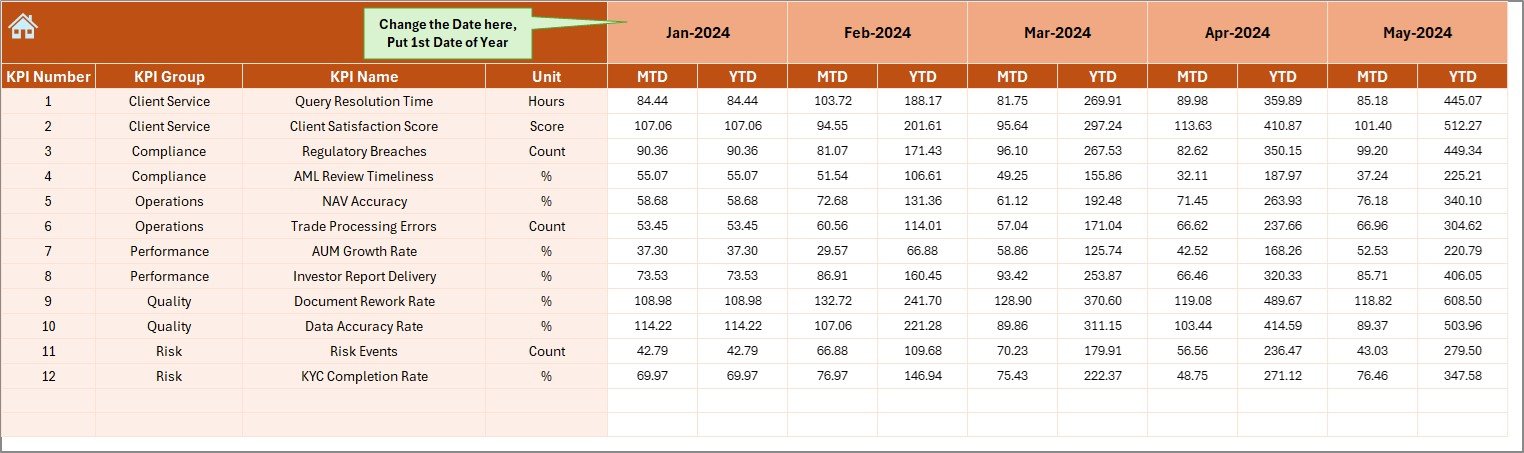
This sheet stores the actual KPI numbers.
You enter:
-
MTD Actual
-
YTD Actual
-
Month
You also set the first month of the year in cell E1. This feature improves flexibility.
5. Target Sheet
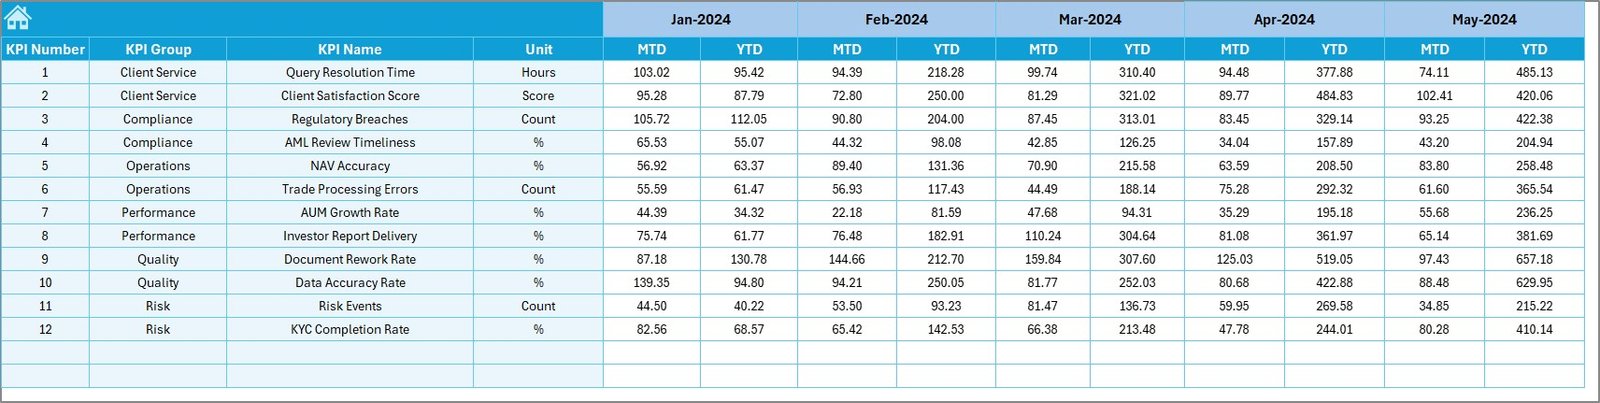
You enter:
-
MTD Target
-
YTD Target
-
Monthly target numbers
Accurate targets help users compare planned vs actual performance.
6. Previous Year Numbers Sheet
You enter the previous year’s MTD and YTD numbers in the same format as the current year. This allows the dashboard to compare CY vs PY instantly.
7. KPI Definition Sheet
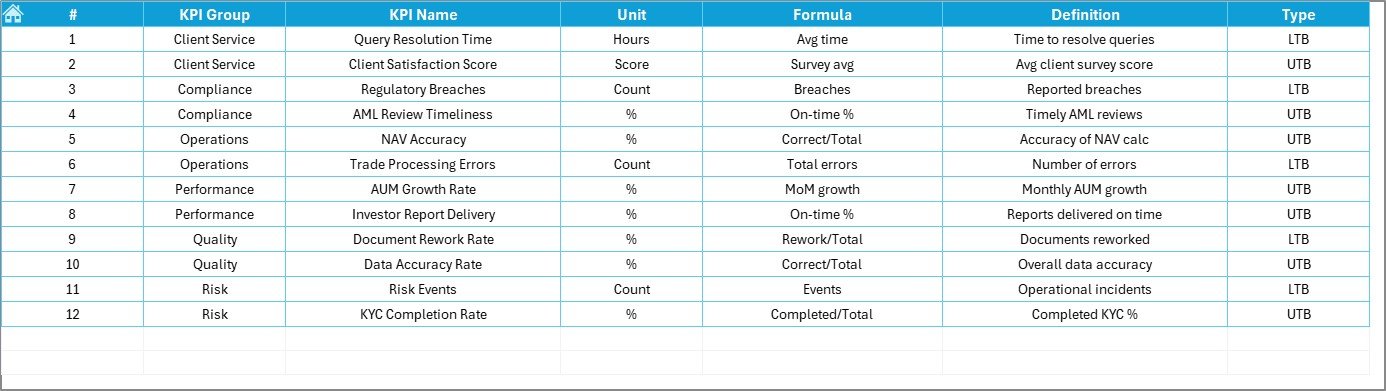
This sheet contains:
-
KPI Name
-
KPI Group
-
Unit
-
Formula
-
Definition
-
Type (LTB or UTB)
This page improves clarity and reduces confusion during monthly reviews.
Why Is This Dashboard Important for Investor Services Teams?
Investor Services teams manage important operational processes such as:
-
Client onboarding
-
Transaction processing
-
Data reconciliation
-
Reporting timelines
-
Service quality KPIs
-
Document processing
-
Turnaround times
-
Error rates
-
Client satisfaction metrics
Because these activities affect investors, fund managers, and regulators, teams must track performance accurately. This dashboard offers a simple, structured approach.
Click to Purchases Investor Services KPI Dashboard in Excel
How the Dashboard Improves Investor Services Performance
The dashboard improves performance by giving clear insights into:
-
Workload distribution
-
Target achievements
-
Efficiency improvement
-
Error reduction
-
Team performance
-
Process adherence
-
Yearly comparisons
-
Long-term trend behaviour
This creates stronger decision-making at every level.
Advantages of the Investor Services KPI Dashboard in Excel
1. Complete Visibility of KPIs
Teams see all MTD and YTD numbers in one place.
2. Real-Time Performance Tracking
The dashboard updates instantly after entering numbers.
3. Easy Trend Analysis
Trend charts reveal improvements and gaps month by month.
4. Improved Accuracy
The structured input sheets reduce errors.
5. No Technical Skills Needed
Any Excel user can operate this dashboard smoothly.
6. Time Savings
Teams avoid creating manual reports every month.
7. Better Decision Making
Managers see performance clearly and take faster actions.
8. Strong Comparison
CY vs PY comparisons highlight process improvement or decline.
Click to Purchases Investor Services KPI Dashboard in Excel
Best Practices for Using the Investor Services KPI Dashboard in Excel
1. Enter Accurate Monthly Data
Clean input ensures accurate visuals.
2. Update Targets at the Start of Each Year
Clear targets improve alignment across teams.
3. Use the Trend Sheet for Monthly Reviews
Patterns help identify operational challenges early.
4. Standardize KPI Definitions
Consistent definitions eliminate confusion.
5. Keep Historical Data Organized
This helps with yearly performance analysis.
6. Train Your Team to Use Navigation Buttons
This improves user experience.
7. Review Target vs Actual Before Meetings
Always walk into review meetings fully prepared.
How Investor Services Teams Benefit From This Dashboard
Investor services teams gain:
-
Higher transparency
-
Reduced reporting time
-
Better workload visibility
-
Improved client service standards
-
Stronger compliance
-
Better operational control
This dashboard becomes a foundation for monthly reporting, audits, and client communication.
Conclusion
An Investor Services KPI Dashboard in Excel helps teams track performance, measure efficiency, and maintain service standards. It organizes KPI data into structured input sheets and a clean dashboard view. You monitor MTD and YTD values, compare with targets, analyze trends, and assess improvement against previous years.
Because it is simple, clear, and interactive, the dashboard becomes an essential reporting tool for investor service units. When used consistently, it improves decision-making and creates stronger operational discipline across the organization.
Frequently Asked Questions (FAQs)
1. Who can use this dashboard?
Investor relations teams, fund administrators, operations teams, asset managers, and client service teams.
2. Do I need Excel expertise?
Basic Excel knowledge is enough to use this dashboard.
3. Can I add more KPIs?
Yes, you can add more KPIs by updating the KPI Definition, Actuals, Targets, and Previous Year sheets.
4. How often should I update the dashboard?
You can update it monthly or weekly based on operational needs.
5. Does it track both MTD and YTD?
Yes, the dashboard shows MTD and YTD numbers with targets and previous year comparisons.
6. Can I customize the charts?
Yes, you can modify colors, titles, and chart formats as required.
7. Does this dashboard help with audits?
Yes, the structured data format supports compliance and audit review.
Click to Purchases Investor Services KPI Dashboard in Excel
Visit our YouTube channel to learn step-by-step video tutorials