Managing employee workload becomes tougher as teams grow, projects expand, and deadlines arrive faster. When tasks move across different departments and priorities shift every day, leaders need a clear way to see who is working on what, how much time tasks take, and where bottlenecks appear. Because of this, more companies now use an Employee Workload Dashboard in Excel to simplify their reporting and improve decision-making.
This dashboard works as a smart and ready-to-use solution that brings all workload insights into one place. It helps managers understand task distribution, estimate work hours, monitor progress, and track employee performance. As a result, teams work smoothly, deadlines remain on track, and productivity rises.
In this detailed guide, you will learn everything about an Employee Workload Dashboard in Excel, including its structure, key features, advantages, best practices, and real-world usage. You will also discover how Excel helps you monitor employee workload without depending on expensive software.
Click to buy Employee Workload Dashboard in Excel
What Is an Employee Workload Dashboard in Excel?
An Employee Workload Dashboard in Excel is a visual reporting tool that shows the workload distribution, task progress, hours required, and employee performance metrics in a simple, interactive format. It uses your monthly data such as assigned tasks, estimated hours, task status, category, employee name, and department. After that, it converts the information into charts, cards, and tables.
Because of the built-in formulas and automated visuals, the dashboard updates instantly when you add new data. Therefore, HR teams, project managers, and department heads can track workload trends without manual work.
Why Do Companies Need an Employee Workload Dashboard?
Workload management affects the health of every team. When employees get too much work, they feel stressed and burnt out. When they get too little work, they lose motivation and productivity drops. Managers need real-time insights to strike the right balance.
The dashboard helps managers:
- Avoid employee overload
- Assign tasks fairly
- Track performance easily
- Improve team communication
- Monitor task progress
- Maintain transparency
- Reduce delays and errors
Because of Excel’s flexibility, companies can use this dashboard for any industry—IT, marketing, HR, finance, customer support, manufacturing, or healthcare.
Key Features of the Employee Workload Dashboard in Excel
This ready-to-use dashboard contains multiple sheet tabs, each designed to provide actionable insights. Below are the main sheets and their uses:
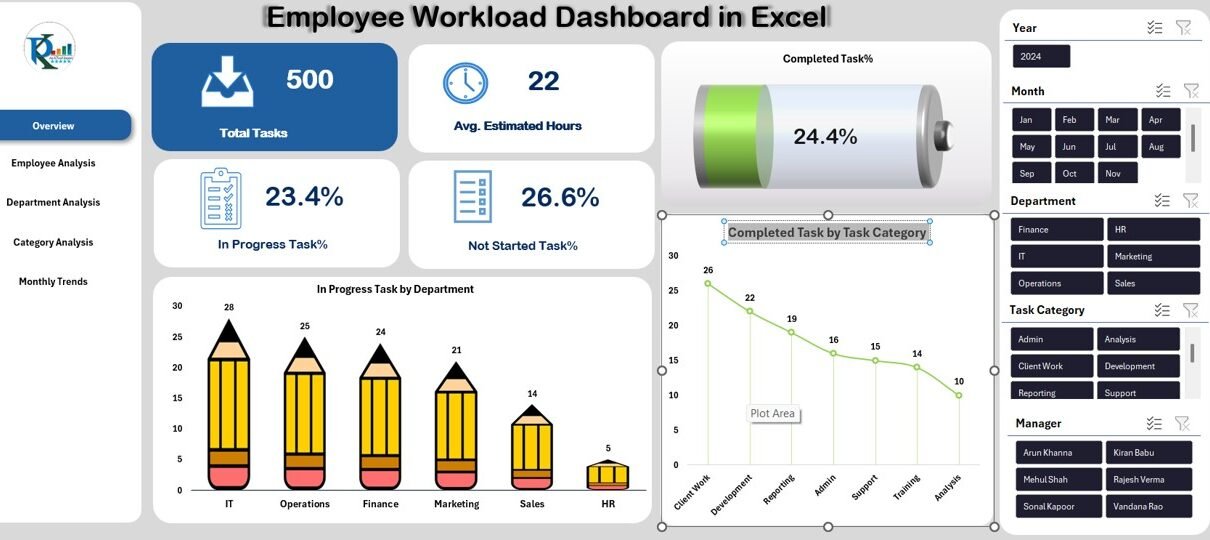
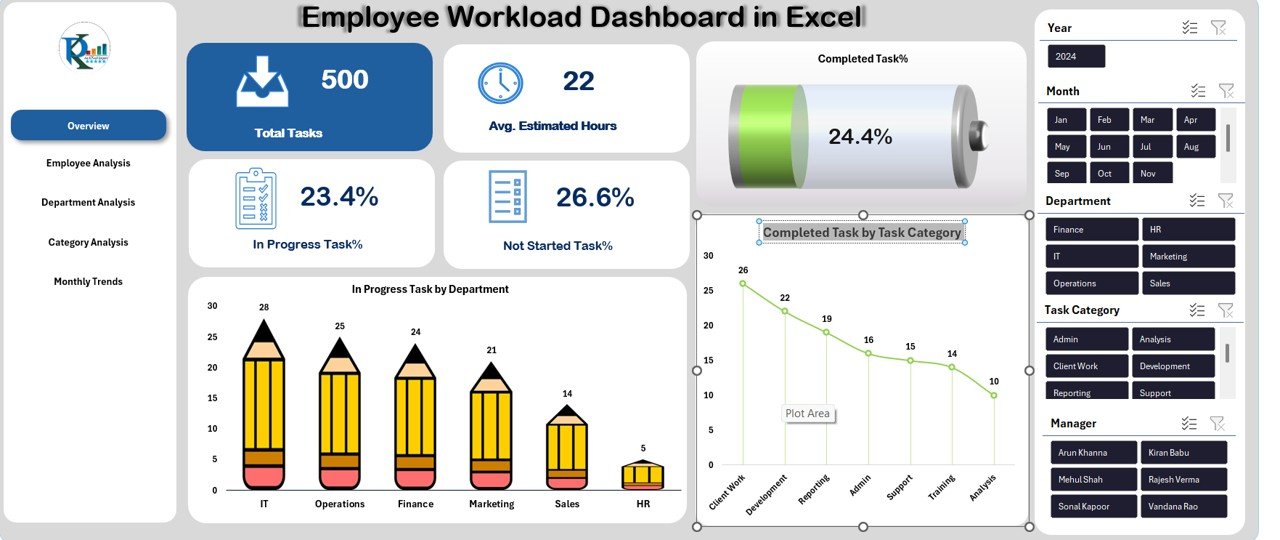
Overview Sheet Tab
This is the main sheet of the dashboard. It gives quick insights into task progress, workload distribution, and completion performance. The sheet includes:
Cards Section
These cards help you see summary insights instantly:
- Total Tasks
- Average Estimated Hours
- In Progress Task %
- Not Started Task %
- Completed Task %
Visuals on Overview Page
The Overview tab includes multiple charts such as:
- In Progress Task by Department
- Completed Task by Task Category
- In Progress Task % by Department
- Completed Task % by Department
These visuals help you understand the current work status of every team.
Click to buy Employee Workload Dashboard in Excel
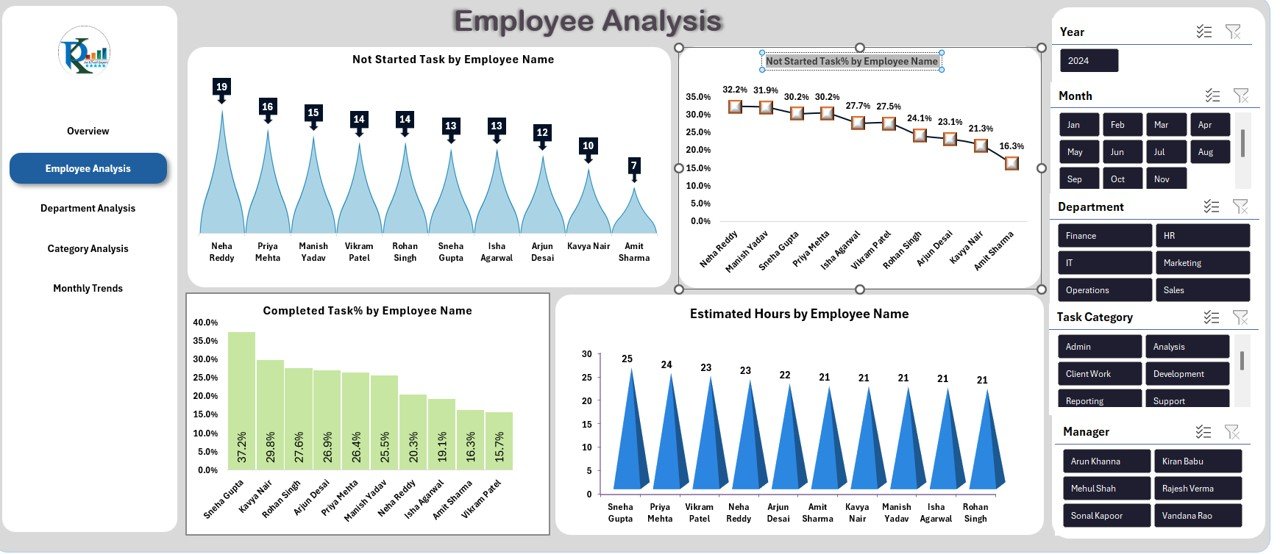
Employee Analysis Sheet
This sheet focuses on employee-level workload insights. It shows:
- Not Started Task % by Employee Name
- Completed Task % by Employee Name
- Estimated Hours by Employee Name
- In Progress Task % by Employee Name
Managers use this sheet to check overworked employees, underperforming employees, and overall productivity patterns.
Click to buy Employee Workload Dashboard in Excel
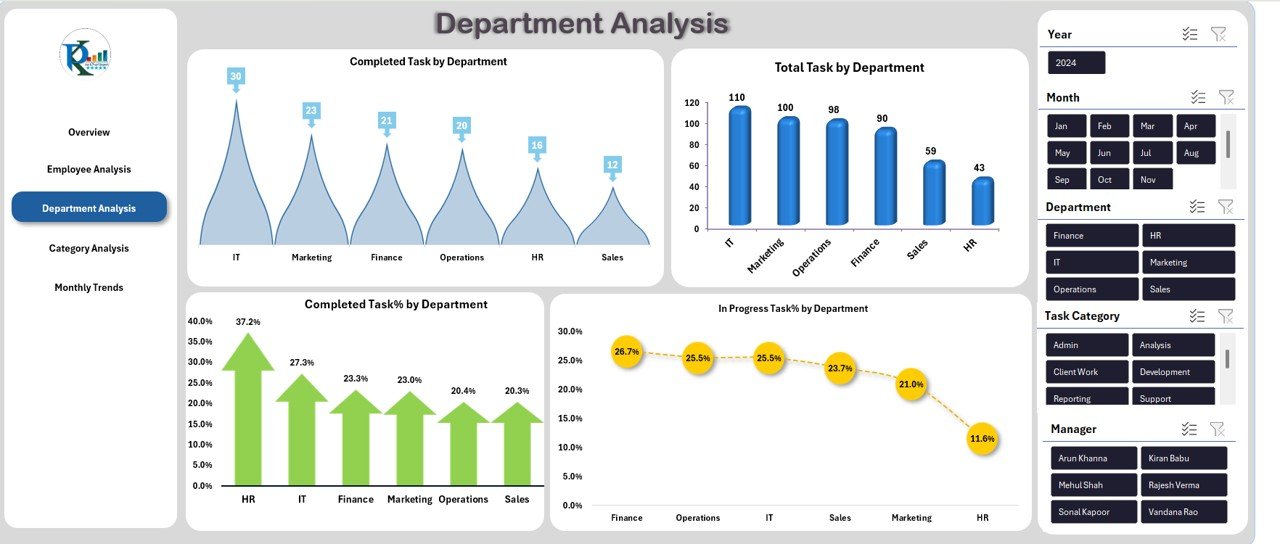
Department Analysis Sheet
This section gives a view of the workload across departments. It shows:
- Completed Task by Department
- Completed Task % by Department
- Total Task by Department
- In Progress Task % by Department
This helps leaders compare departments and identify where improvements are needed.
Click to buy Employee Workload Dashboard in Excel
Category Analysis Sheet
This sheet displays workload insights based on task categories. It includes:
- Estimated Hours by Task Category
- Completed Task % by Task Category
- In Progress Task % by Task Category
- In Progress Task by Task Category
This helps track how different project types consume time and effort.

Click to buy Employee Workload Dashboard in Excel
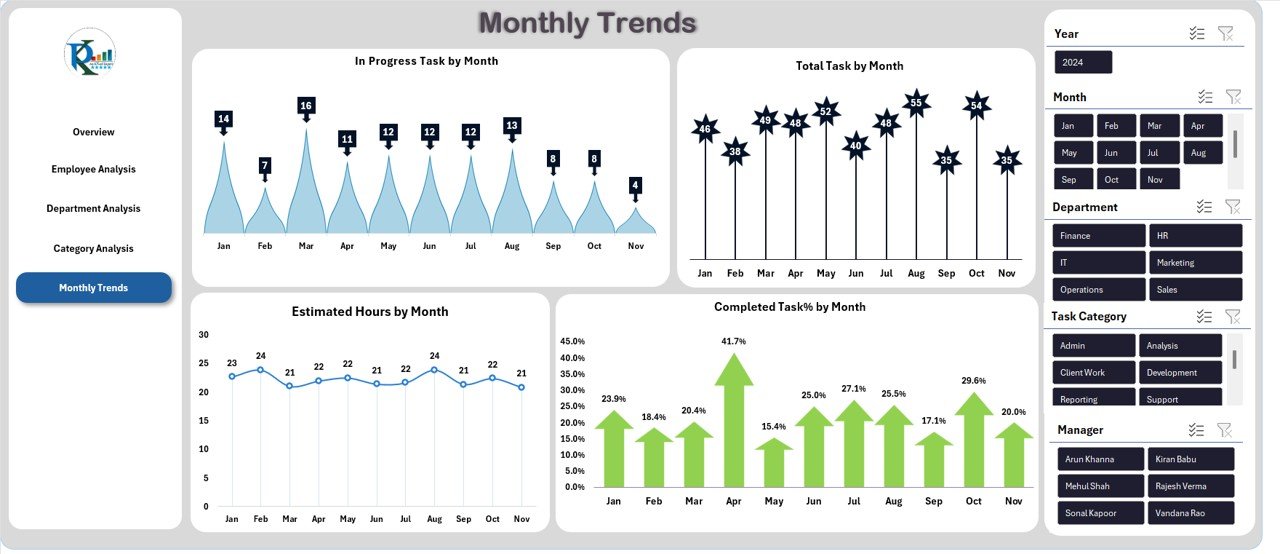
Monthly Trends Sheet
This sheet shows how workload changes month by month. It includes:
- In Progress Tasks by Month
- Estimated Hours by Month
- Total Tasks by Month
- Completed Task % by Month
These charts help track seasonal workload, peak periods, and long-term trends.
Click to buy Employee Workload Dashboard in Excel
Advantages of the Employee Workload Dashboard in Excel
- Clear Visibility of Task Progress
The dashboard shows every task in one place. Managers see what is completed, in progress, or not started. This improves transparency and reduces confusion.
- Helps Prevent Employee Burnout
Work overload leads to stress. The dashboard shows estimated hours for every employee. Managers then distribute work evenly.
- Improves Resource Allocation
You see how many tasks each department handles. As a result, you can move tasks to the right teams.
- Enhances Productivity
Since you track performance in real time, you take action quickly. This boosts productivity across the team.
- Supports Better Planning
Monthly trends show how workload changes throughout the year. Teams then plan better for busy months.
- Reduces Delays
Since managers see tasks that are pending or not started, they send reminders on time and avoid delays.
- Helps Evaluate Employee Efficiency
Charts like “Completed Task % by Employee Name” help identify top performers and employees who need support.
What KPIs Should You Track in an Employee Workload Dashboard?
Below are the key workload KPIs you should track:
- Total Tasks Assigned
- Completed Task %
- In Progress Task %
- Not Started Task %
- Estimated Hours
- Actual Hours (if available)
- Tasks by Department
- Tasks by Category
- Tasks by Employee
- Workload Efficiency Ratio
- Monthly Workload Trends
These KPIs help measure performance, work balance, and project progress.
How to Use the Employee Workload Dashboard Effectively?
You get the best results when you follow the right approach. Below are simple steps to use the dashboard effectively:
- Enter Your Task Data in the Data Sheet
Add the task name, category, department, employee name, status, and estimated hours.
- Refresh the Dashboard
Excel updates all charts automatically after refreshing the formulas.
- Check High-Level Insights on the Overview Page
Start by looking at cards like Total Tasks and Avg. Estimated Hours.
- Review Employee Productivity
Use the Employee Analysis sheet to see workload distribution and performance status.
- Compare Department Workload
Find bottlenecks and overloaded teams using department visuals.
- Track Category-Based Workload
See which project types take the most hours.
- Monitor Monthly Trends
Check how workload changes over time and plan your resources.
Best Practices for the Employee Workload Dashboard in Excel
To get maximum value from this dashboard, follow these best practices:
- Update Data Regularly
Add task data daily or weekly to keep insights fresh.
- Use Clear Naming Conventions
Use simple names for task categories and departments to avoid confusion.
- Assign One Owner for Each Task
This helps track responsibility clearly.
- Set Realistic Estimated Hours
Accurate estimates improve workload planning.
- Use Filters to Identify Issues
Filters help you find problems quickly.
- Review Monthly Trends
Use the trends sheet to plan hiring and resource allocation.
- Keep the Dashboard Simple
Avoid excessive charts. Focus on insights that help you make decisions.
Conclusion
An Employee Workload Dashboard in Excel is a complete solution for tracking tasks, managing workload, and improving team performance. It offers real-time insights into employee productivity, departmental workload, task progress, and estimated hours. Because of its simple structure, even non-technical users work with ease.
When you use the dashboard the right way, you reduce overload, improve planning, increase efficiency, and achieve better project outcomes. Whether you work in a small team or a large organization, this dashboard helps you manage workload with confidence.
Frequently Asked Questions (FAQs)
What is an Employee Workload Dashboard?
It is a visual tool in Excel that tracks employee tasks, workload, progress, and performance.
Who can use this dashboard?
Project managers, HR teams, team leaders, department heads, and business owners use this dashboard.
What type of data do I need to use this dashboard?
You need task name, employee name, department, category, status, and estimated hours.
Can I use this dashboard for any industry?
Yes, you can use it in IT, finance, HR, marketing, healthcare, and many other industries.
Do I need Excel expertise to use this dashboard?
No, the dashboard is ready to use. You only need to enter your data.
Can I customize the charts?
Yes, you can change colors, chart types, labels, and layouts based on your needs.
How often should I update the data?
You should update the data daily or weekly for accurate insights.
Does the dashboard show employee performance?
Yes, charts like Completed Task % by Employee Name help measure performance.
Can I track total estimated hours?
Yes, the Estimated Hours chart shows how much work each employee handles.
Why should companies use workload dashboards?
They help balance work, avoid burnout, improve team efficiency, and support better planning.
Visit our YouTube channel to learn step-by-step video tutorials
Watch the step-by-step video tutorial:
Click to buy Employee Workload Dashboard in Excel