Venture capital firms handle fast-moving investments, multiple funding rounds, changing valuations, and unpredictable market conditions. Because of this, investors need a clear and reliable way to track their portfolio performance. A Venture Capital Dashboard in Power BI solves this challenge. It turns scattered financial data into simple visuals that help partners understand risks, returns, and growth opportunities.
In this article, you will learn everything about this dashboard, how each page works, the key metrics it tracks, its advantages, best practices, and answers to the most common questions. Let’s explore how a Power BI dashboard transforms venture capital decision-making.
Click to Purchases Venture Capital Dashboard in Power BI
What Is a Venture Capital Dashboard in Power BI?
A Venture Capital Dashboard in Power BI is an interactive reporting system that tracks the performance of funds, partners, industries, and portfolio companies. It shows real-time insights such as:
-
Investment amounts
-
Valuation trends
-
Revenue growth
-
Burn rate
-
ESG scores
-
Fund risk levels
-
Monthly performance patterns
Because Power BI updates the visuals instantly, investors can switch between industries, partners, fund types, and time periods with ease. This dashboard brings clarity to complex data and supports fast, informed decisions.
Why Do Venture Capital Firms Need a Dashboard?
Venture capital firms manage several investments at the same time. They evaluate companies, track valuations, review partner activities, and monitor financial health every month. Without a dashboard, teams spend hours compiling spreadsheets and verifying numbers.
A Power BI dashboard solves this problem by:
-
Collecting all data in one place
-
Showing insights in real time
-
Highlighting risks early
-
Supporting better forecasting
-
Improving transparency among stakeholders
As a result, investors gain confidence and make decisions based on accurate, organized, and visualized data.
Key Features of the Venture Capital Dashboard in Power BI
This dashboard includes five powerful pages in the Power BI file. Each page presents different insights for deeper analysis.
1. Overview Page: Your Complete Investment Snapshot
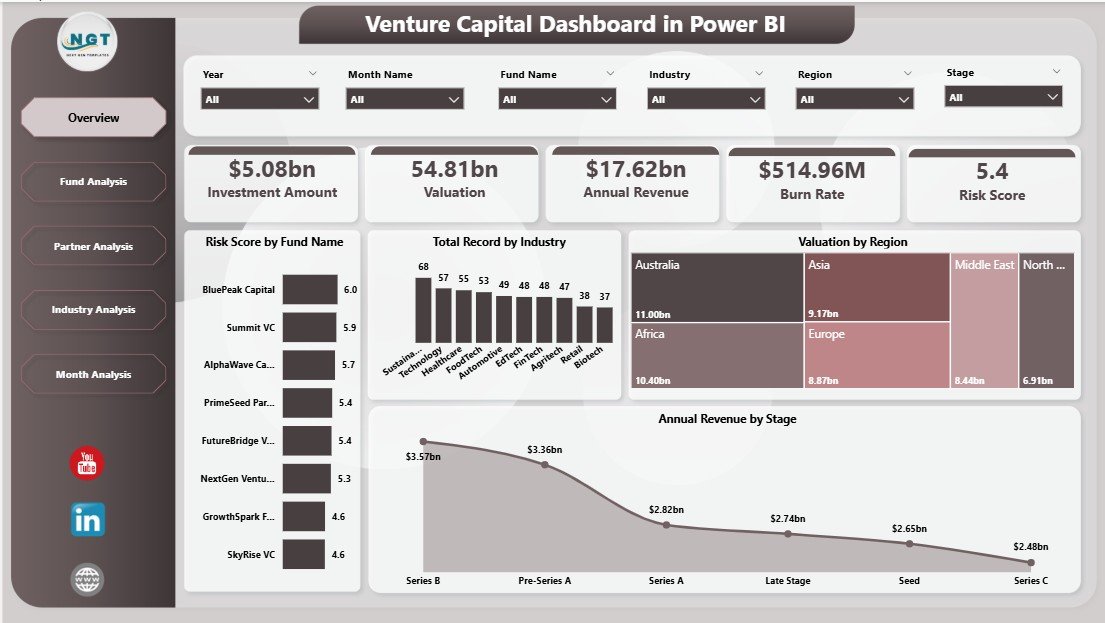
The Overview Page works as the main control panel of the dashboard. It includes essential slicers that help users filter data by fund type, industry, or region. In addition, it displays four KPI cards and four key charts.
KPI Cards on the Overview Page
-
Total Funds
-
Total Portfolio Companies
-
Average Risk Score
-
Total Annual Revenue
These cards give a quick view of the overall health of your investments.
Charts on the Overview Page
-
Risk Score by Fund Type: Helps investors understand which fund types carry higher risks.
-
Total Records by Industry: Shows how diversified the investments are across industries.
-
Valuation by Region: Highlights which regions hold the highest valuation.
-
Annual Revenue by Stage: Reveals revenue patterns from early stage to late stage companies.
This first page helps partners review the complete picture before diving deeper.
2. Fund Analysis Page: Insights Into Each Fund
-
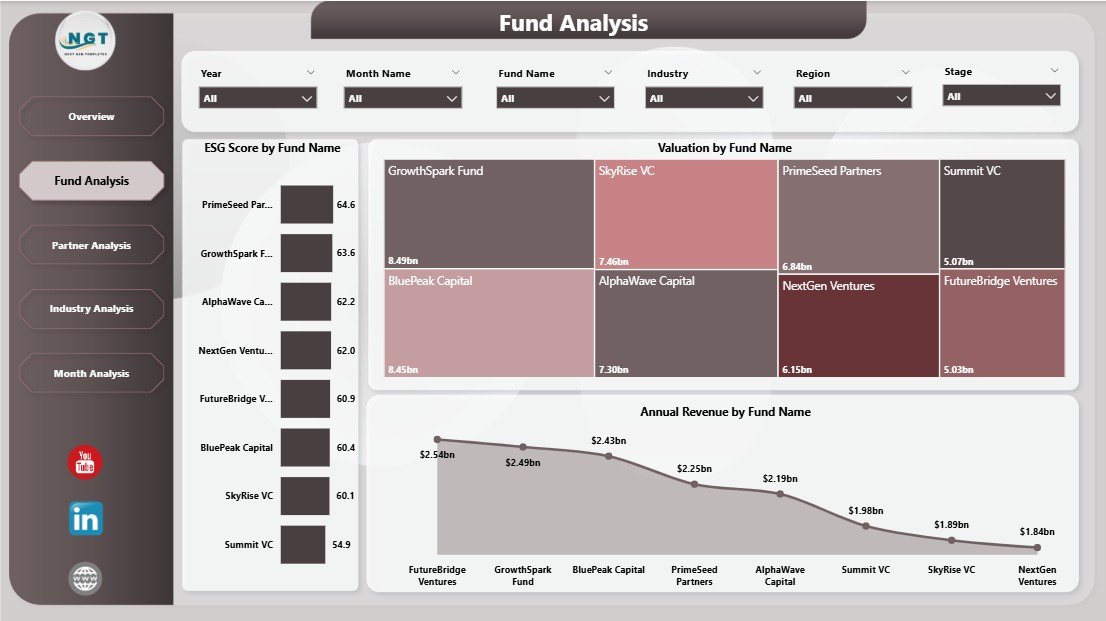
Fund Analysis Page
The Fund Analysis Page focuses on the performance of individual investment funds. It includes slicers for selecting specific fund names.
Charts on the Fund Analysis Page
-
ESG Score by Fund Name: Shows how sustainable and compliant each fund is.
-
Valuation by Fund Name: Helps measure the current worth of portfolio investments within each fund.
-
Annual Revenue by Fund Name: Reveals which funds produce the strongest returns.
This page gives clarity about fund-level performance and supports strategy alignment.
3. Partner Analysis Page: Evaluate Partner Contribution
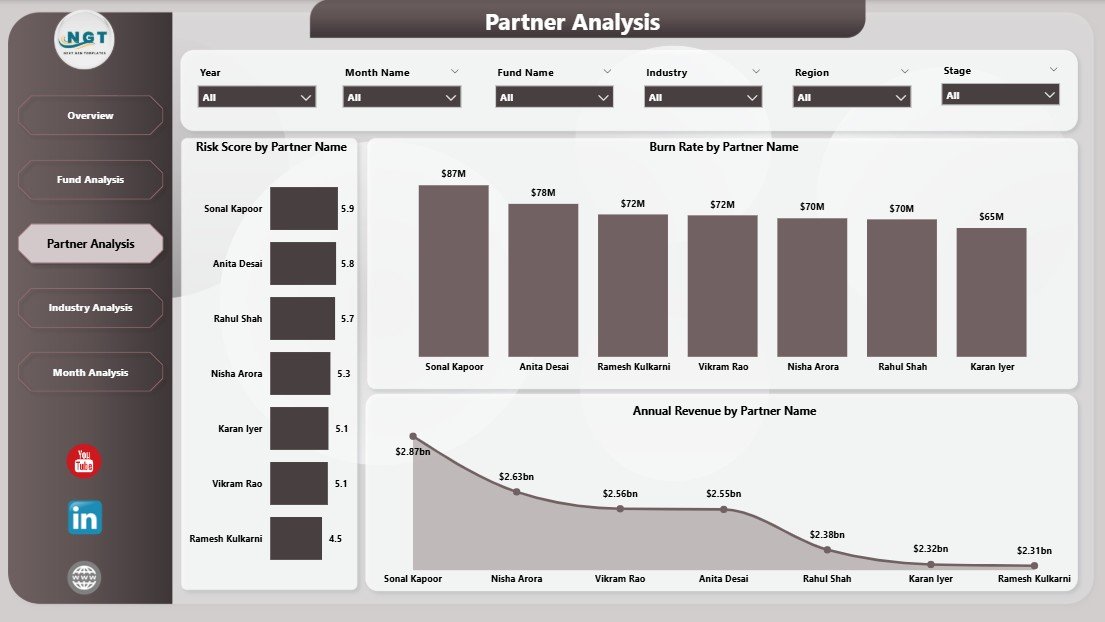
Partners play a major role in finding deals, supporting startups, and allocating funds. Therefore, tracking their performance becomes essential.
Charts on the Partner Analysis Page
-
Risk Score by Partner Name: Shows how each partner handles risk in their portfolio.
-
Burn Rate by Partner Name: Measures how fast their assigned companies spend money.
-
Annual Revenue by Partner Name: Identifies partners who contribute the most to portfolio growth.
This analysis helps leadership reward strong performers and guide others more efficiently.
Click to Purchases Venture Capital Dashboard in Power BI
4. Industry Analysis Page: Compare Industry-Wise Performance
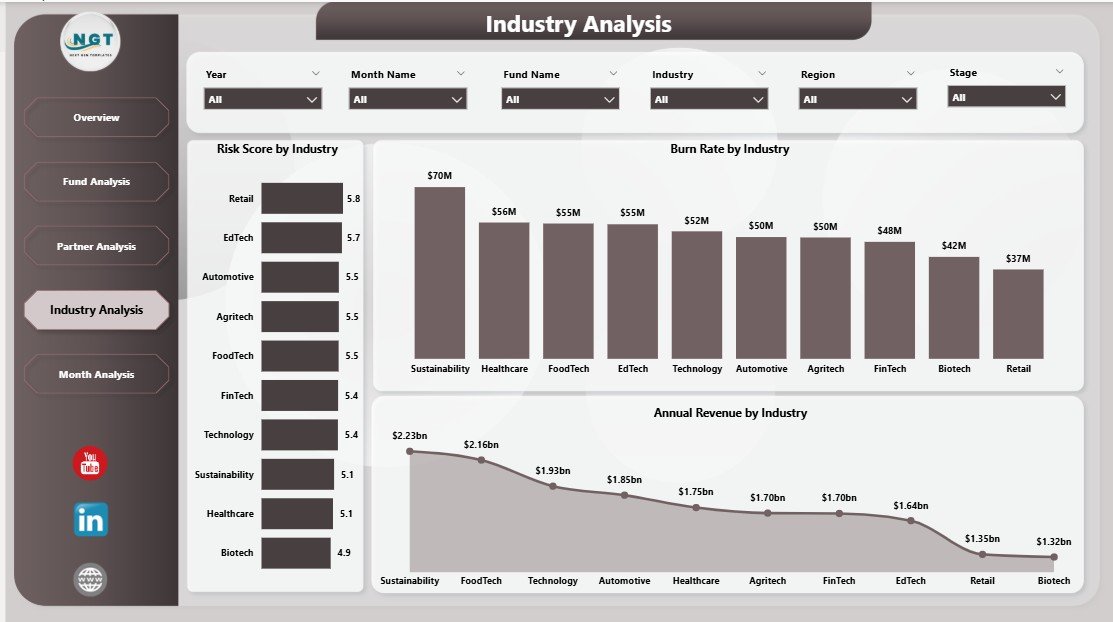
Every industry behaves differently. Some industries grow fast, while others present higher risks. Therefore, this page breaks down investment performance by industry.
Charts on the Industry Analysis Page
-
Risk Score by Industry: Highlights industries with the highest investment risks.
-
Burn Rate by Industry: Shows which sectors consume funds faster.
-
Annual Revenue by Industry: Helps identify the most profitable industries.
This comparison supports diversification decisions and long-term planning.
5. Monthly Trends Page: Track Performance Month by Month
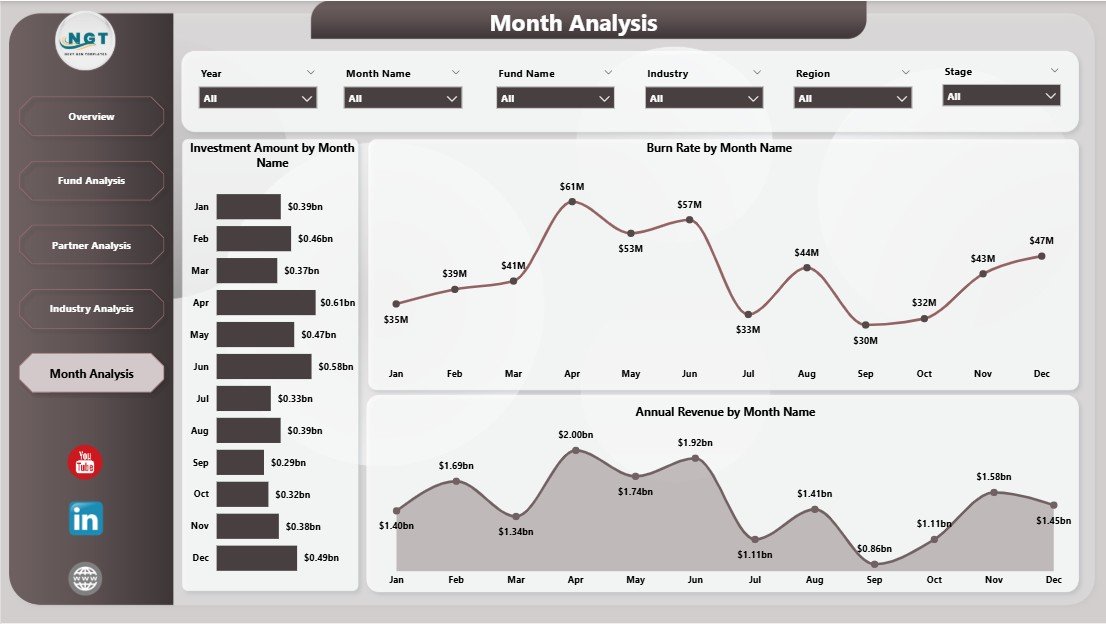
The Monthly Trends Page shows how the portfolio performs over time. Investors can easily monitor patterns, seasonality, and financial changes.
Charts on the Monthly Trends Page
-
Investment Amount by Month: Shows funding patterns across the year.
-
Burn Rate by Month: Reveals cost consumption trends.
-
Annual Revenue by Month: Tracks month-wise revenue growth.
This page supports forecasting and helps detect early warning signs.
What Makes This Dashboard Useful for VC Firms?
A Venture Capital Dashboard in Power BI gives investors the clarity they need. It turns complex financial data into visuals everyone understands.
Key Benefits
-
Quick access to real-time investment insights
-
Easy comparison between funds, industries, and partners
-
Faster decision-making during investment rounds
-
Better portfolio diversification
-
Improved risk assessment
-
Enhanced investor transparency
The dashboard works smoothly for early-stage, growth-stage, and large venture capital firms.
How Does a Venture Capital Dashboard Improve Performance?
This dashboard improves daily operations in the following ways:
-
Investors spend less time on manual reports
-
Partners use accurate data for better guidance
-
Teams track fund health instantly
-
Stakeholders follow investments with more confidence
-
Leaders reduce losses by spotting risks early
Because data remains integrated and dynamic, decisions become more reliable.
Advantages of a Venture Capital Dashboard in Power BI
Investors benefit in several ways. Below are the most important advantages:
1. Real-Time Visibility
The dashboard shows updated data instantly, which helps firms act faster.
2. Better Risk Management
VCs understand which fund, industry, or partner carries higher risks.
3. Improved Portfolio Tracking
The dashboard shows performance from every angle: funds, partners, industries, and time periods.
4. Enhanced Reporting
Leaders present clean and visually appealing reports to stakeholders.
5. Clear Partner Evaluation
Firms track partner-wise revenue, burn rate, and risk score.
6. Faster Investment Decisions
Accurate data helps firms commit to deals more confidently.
7. Stronger Forecasting
Monthly trends support predictive analysis for future investments.
Best Practices for Using the Venture Capital Dashboard
Follow these best practices for better results:
1. Update Data Every Month
Keep your data fresh to maintain accurate insights.
2. Use Filters Carefully
Apply fund, industry, region, or partner filters to get the right view.
3. Compare Multiple Metrics
Review risk score, burn rate, and revenue together for a complete picture.
4. Set Clear KPIs
Define which KPIs matter the most: valuation, burn rate, ESG score, or revenue.
5. Review Industry Trends Often
Industries change fast, so monitor their performance regularly.
6. Track Partner Performance
Use the partner analysis page to identify high-value contributors.
7. Share Reports With Stakeholders
Use Power BI sharing features for smooth communication.
8. Add Forecasting Models
Enhance your dashboard with Power BI forecasting tools.
Conclusion
A Venture Capital Dashboard in Power BI helps investors manage complex portfolios with ease. It simplifies data, improves transparency, and supports informed decisions. With pages for funds, partners, industries, and monthly trends, investors get a complete view of their portfolio performance.
By following best practices and updating your data regularly, you can achieve stronger investment outcomes and make smarter, faster decisions.
Frequently Asked Questions (FAQs)
Click to Purchases Venture Capital Dashboard in Power BI
1. What is a Venture Capital Dashboard in Power BI?
It is an interactive tool that shows investment performance, fund trends, partner performance, and industry insights using clear visuals and real-time data.
2. Who can use this dashboard?
Venture capital firms, investment managers, startup accelerators, private equity teams, and financial analysts.
3. What KPIs does the dashboard track?
It tracks risk score, valuation, annual revenue, burn rate, ESG score, and investment trends.
4. How often should I update the data?
You should update it monthly, although weekly or quarterly updates also work based on the fund size.
5. Can I customize this dashboard in Power BI?
Yes, you can modify slicers, add KPIs, or include forecasting models based on your needs.
6. Why is burn rate important for venture capital?
Burn rate shows how fast a company spends cash. It helps investors spot liquidity risks early.
7. Does this dashboard support forecasting?
Yes, Power BI offers built-in forecasting charts for predicting future performance.
8. How does industry analysis help investors?
It helps find high-growth industries, reduce risk, and improve diversification.
Visit our YouTube channel to learn step-by-step video tutorials