Digital streaming platforms have transformed how audiences consume content. Viewers now expect seamless streaming, personalized recommendations, and high-quality content across devices. At the same time, competition among streaming platforms continues to intensify. Therefore, tracking performance accurately has become critical for growth and sustainability.
That is exactly where a Digital Streaming Platforms KPI Dashboard in Excel becomes a powerful and practical solution.
In this in-depth, SEO-friendly article, you will learn what a Digital Streaming Platforms KPI Dashboard in Excel is, why it matters, how it works, its worksheet-wise structure, advantages, best practices, and frequently asked questions. Moreover, the article uses simple language, strong transitions, and practical explanations so that teams can apply it easily.
Click to Purchases Digital Streaming Platforms KPI Dashboard in Excel
What Is a Digital Streaming Platforms KPI Dashboard in Excel?
A Digital Streaming Platforms KPI Dashboard in Excel is a ready-to-use performance tracking tool designed to monitor and analyze key performance indicators (KPIs) related to streaming platforms.
Instead of using multiple disconnected spreadsheets and manual reports, this dashboard consolidates actual performance, targets, and previous-year data into a single interactive Excel file. As a result, platform owners, analysts, and managers gain a clear and consistent view of performance.
Because the dashboard runs on Microsoft Excel, teams can use it easily without investing in complex or expensive analytics tools.
Why Do Digital Streaming Platforms Need a KPI Dashboard?
Digital streaming platforms operate in a fast-changing and data-heavy environment. Therefore, relying on intuition alone no longer works.
Key Reasons to Use a KPI Dashboard
-
To track MTD and YTD performance in one place
-
To compare actual results with targets and previous years
-
To identify performance gaps early
-
To improve reporting accuracy and transparency
-
To support data-driven strategic decisions
Moreover, a KPI dashboard saves time and improves confidence in performance reporting.
Click to Purchases Digital Streaming Platforms KPI Dashboard in Excel
How Does the Digital Streaming KPI Dashboard in Excel Work?
The dashboard follows a simple and structured workflow.
-
Users enter data into predefined input sheets
-
Excel formulas calculate MTD, YTD, and comparisons
-
Conditional formatting highlights performance status
-
Drop-downs allow quick filtering by month and KPI
-
Charts and tables update automatically
Because of this design, users reduce manual work and avoid calculation errors.
What Worksheets Are Included in the Digital Streaming KPI Dashboard?
This ready-to-use dashboard includes 7 structured worksheets, each designed for a specific purpose.
What Is the Purpose of the Home Sheet?
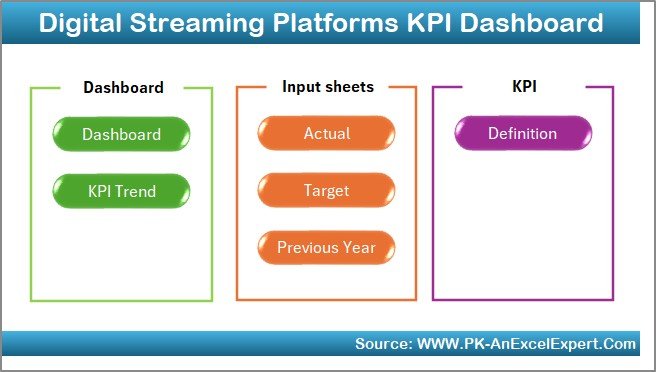
The Home sheet works as an index and navigation hub.
Key Features of the Home Sheet
-
Clean and user-friendly layout
-
Six navigation buttons
-
One-click access to all major sheets
As a result, users move across the dashboard quickly and efficiently.
Click to Purchases Digital Streaming Platforms KPI Dashboard in Excel
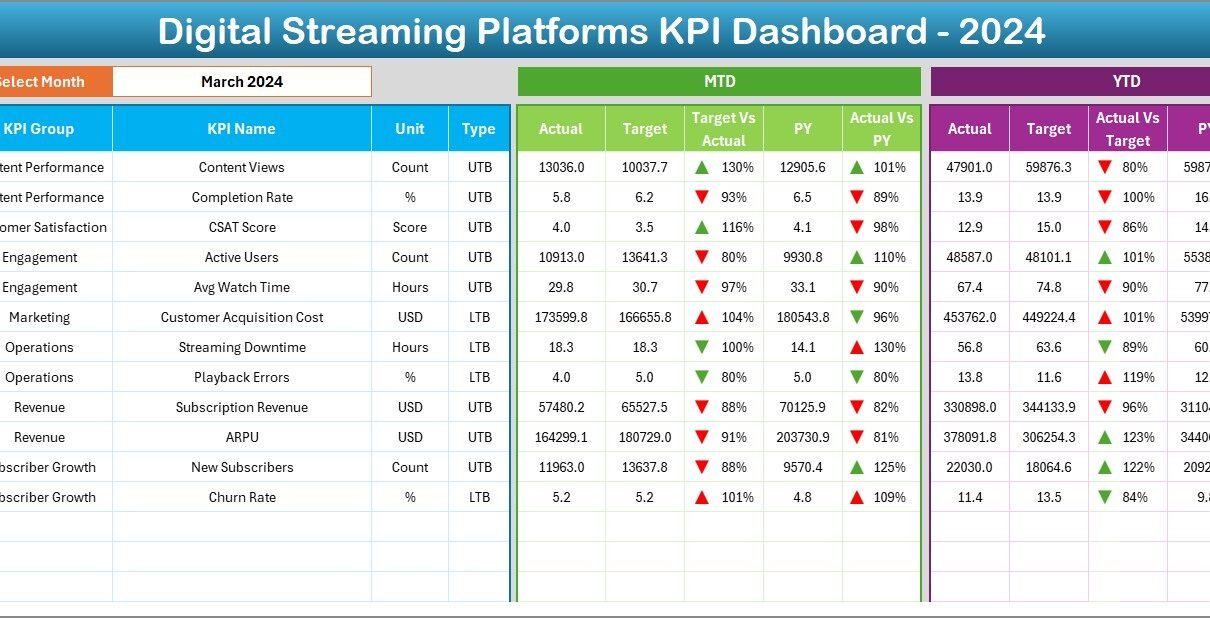
What Information Does the Dashboard Sheet Display?
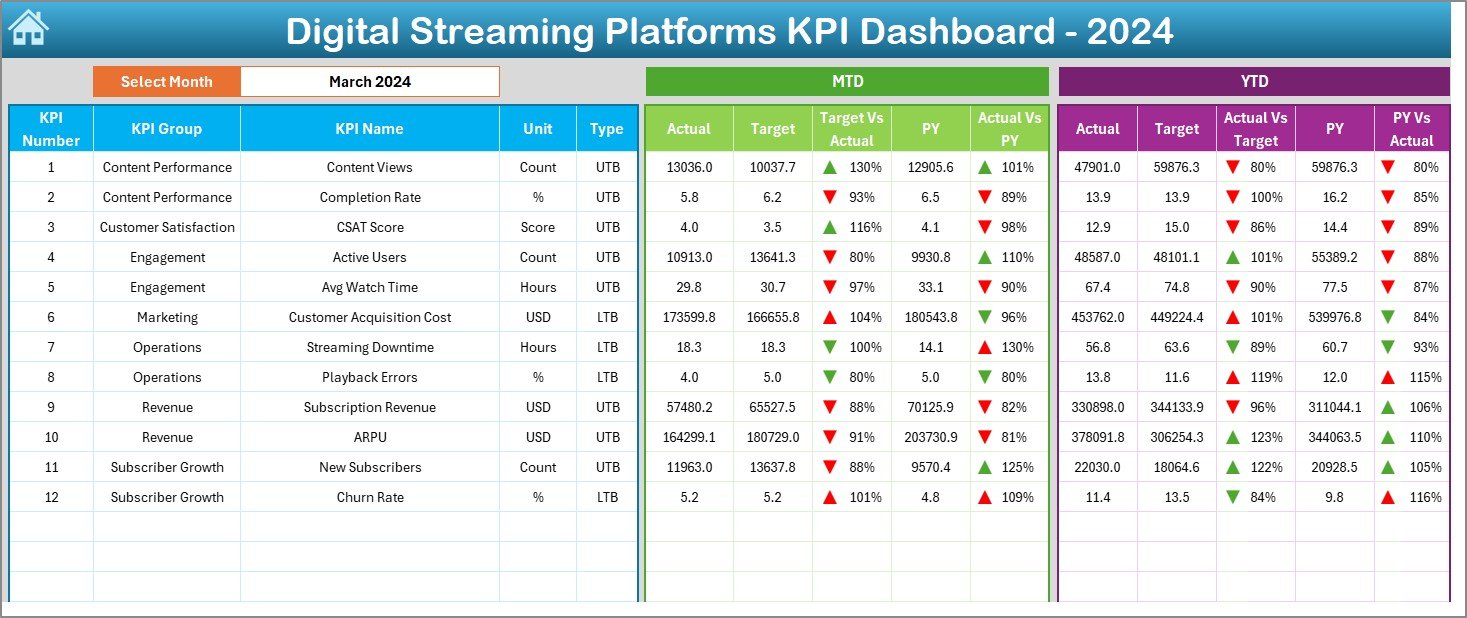
The Dashboard sheet serves as the central performance view.
Month Selection Feature
-
Cell D3 contains a month drop-down
-
Selecting a month updates the entire dashboard instantly
This feature allows quick month-wise performance analysis.
MTD Performance View
The dashboard shows:
-
MTD Actual
-
MTD Target
-
MTD Previous Year
-
Target vs Actual %
-
Previous Year vs Actual %
Conditional formatting with up and down arrows clearly highlights performance trends.
YTD Performance View
The dashboard also displays:
-
YTD Actual
-
YTD Target
-
YTD Previous Year
-
Target vs Actual %
-
Previous Year vs Actual %
Because MTD and YTD appear together, users get both short-term and long-term insights.
What Does the KPI Trend Sheet Help You Analyze?
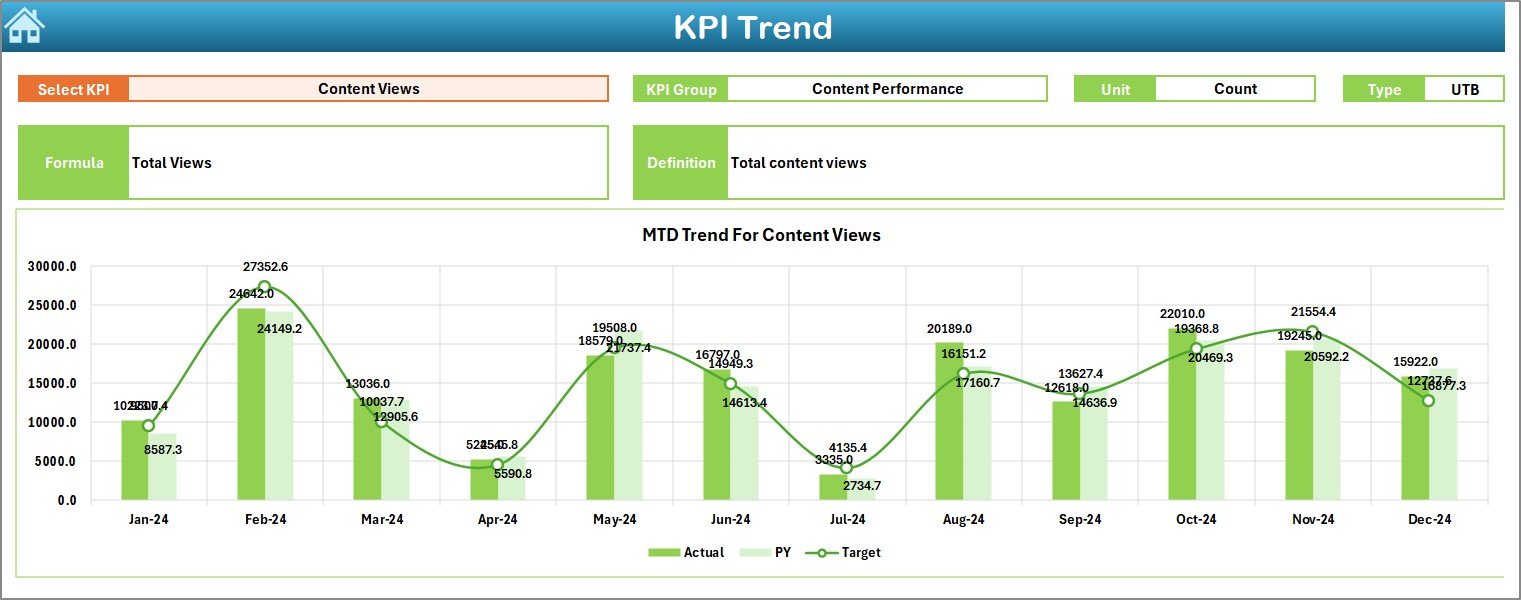
The KPI Trend sheet focuses on deep KPI-level insights.
KPI Selection
-
KPI Name drop-down available at cell C3
-
Selecting a KPI updates all details automatically
KPI Details Displayed
For the selected KPI, the sheet shows:
-
KPI Group
-
KPI Unit
-
KPI Type (Lower the Better or Upper the Better)
-
KPI Formula
-
KPI Definition
This information ensures correct interpretation of each KPI.
Trend Charts on the KPI Trend Sheet
The sheet includes:
-
MTD trend chart (Actual, Target, Previous Year)
-
YTD trend chart (Actual, Target, Previous Year)
As a result, users can easily identify trends, seasonality, and performance gaps.
Click to Purchases Digital Streaming Platforms KPI Dashboard in Excel
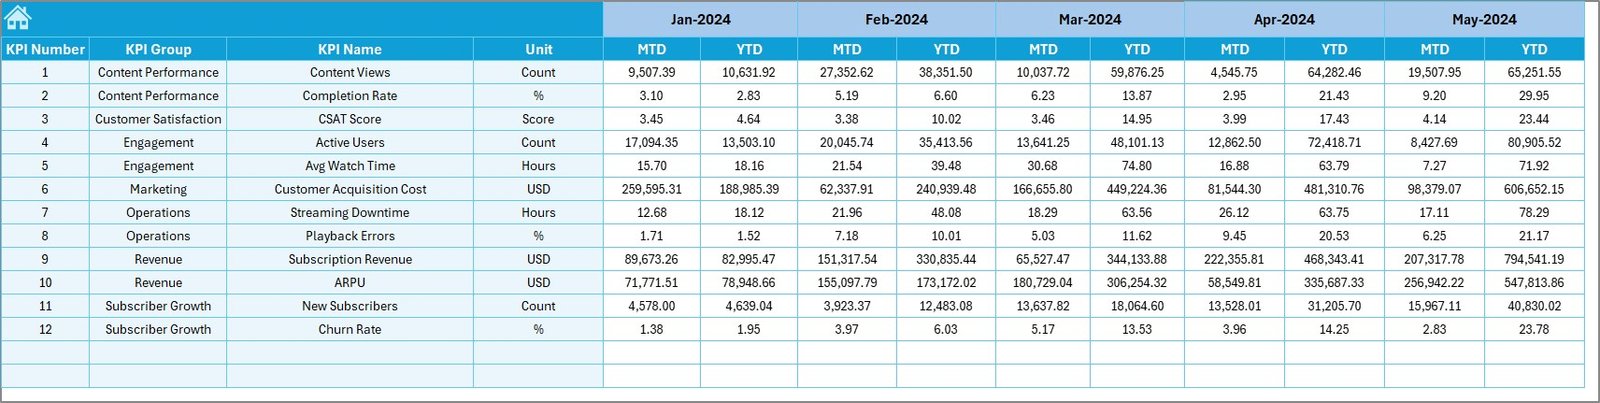
What Is the Actual Numbers Input Sheet?
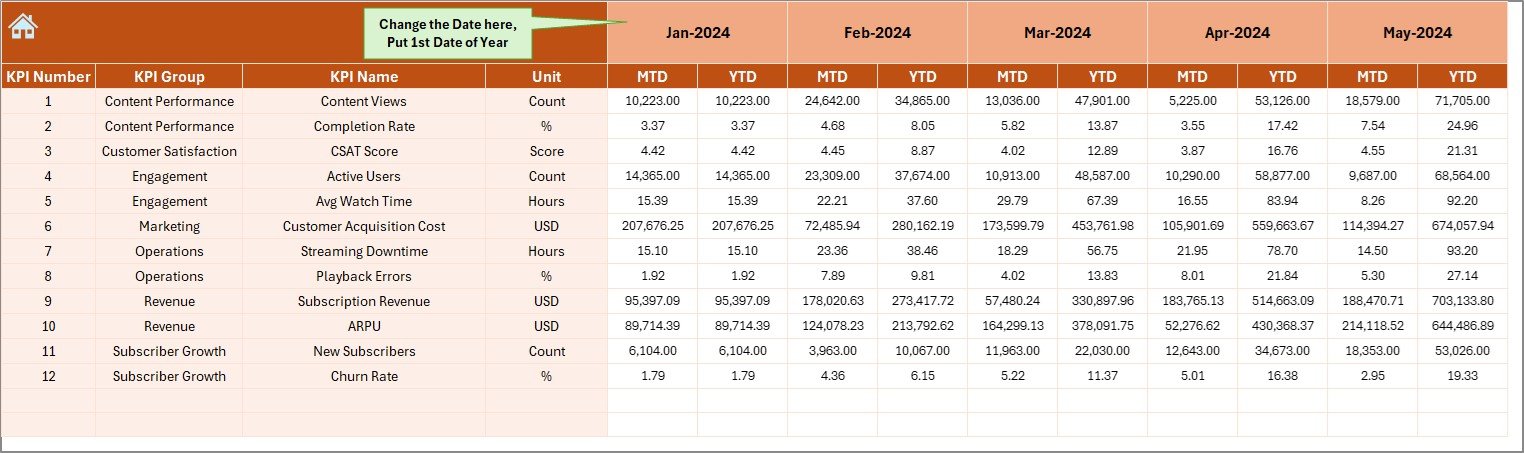
The Actual Numbers Input sheet stores current-year performance data.
How to Use This Sheet
-
Enter the first month of the year in cell E1
-
Input MTD and YTD actual values for each KPI
-
Update data regularly, usually monthly
Because data entry remains structured, calculations stay reliable.
What Is the Role of the Target Sheet?
The Target Sheet stores planned performance goals.
Data Captured in This Sheet
-
Monthly MTD target values
-
Monthly YTD target values
-
Targets defined for each KPI
This structure supports accurate target vs actual comparisons.
Why Is the Previous Year Number Sheet Important?
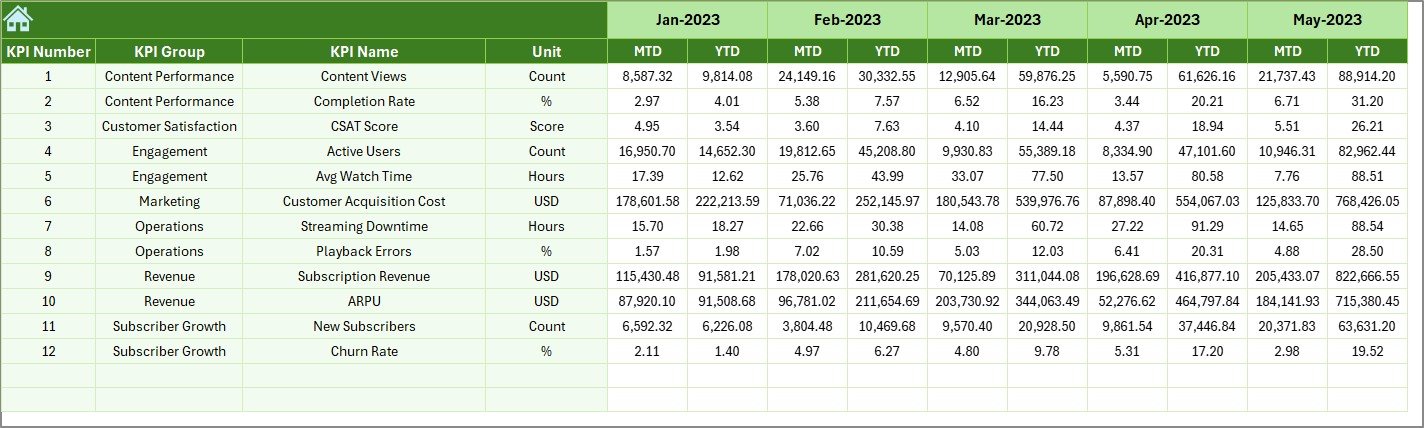
The Previous Year Number sheet stores historical data.
Key Benefits
-
Enables year-over-year analysis
-
Supports benchmarking and trend analysis
-
Improves strategic performance reviews
Keeping historical data separate ensures clarity and consistency.
What Does the KPI Definition Sheet Contain?
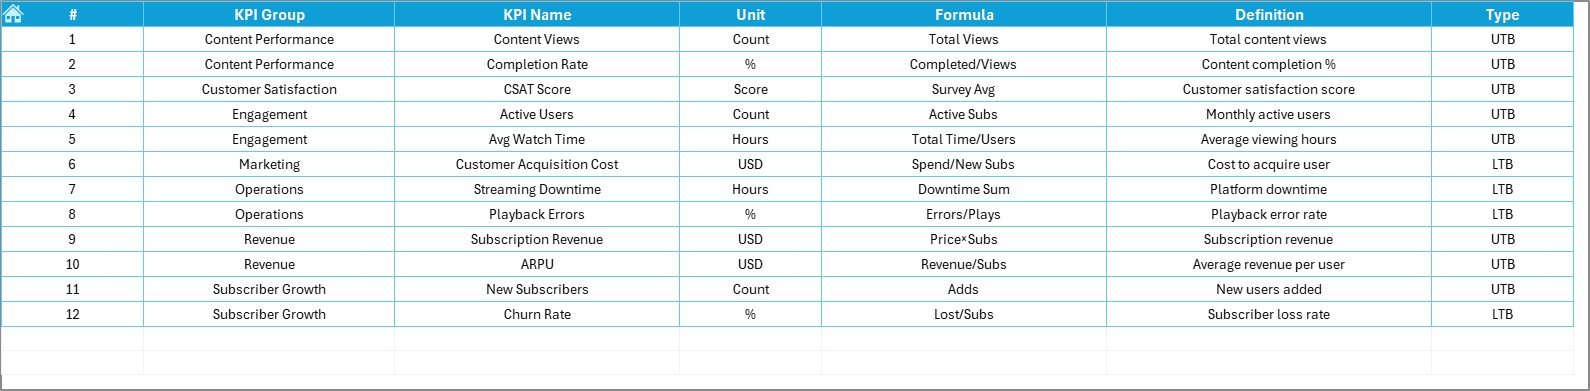
The KPI Definition sheet acts as the master reference for all KPIs.
Information Stored
-
KPI Name
-
KPI Group
-
KPI Unit
-
KPI Formula
-
KPI Definition
This sheet ensures alignment and standardization across teams.
Advantages of Digital Streaming Platforms KPI Dashboard in Excel
1. Centralized KPI Monitoring
The dashboard brings all KPIs into one file. Therefore, teams avoid fragmented reporting.
2. Easy to Use
Because it is built in Excel, users do not need advanced technical skills.
3. Clear Performance Visibility
Conditional formatting instantly highlights strong and weak performance areas.
4. Better Decision-Making
MTD, YTD, and historical trends support informed strategic decisions.
5. Time-Saving Reporting
Automated calculations reduce manual effort and errors.
6. Cost-Effective Analytics Solution
The dashboard delivers strong insights without expensive BI tools.
Click to Purchases Digital Streaming Platforms KPI Dashboard in Excel
Who Should Use a Digital Streaming KPI Dashboard?
This dashboard benefits a wide range of users, including:
-
Streaming platform managers
-
Content strategy teams
-
Data and business analysts
-
Finance and planning teams
-
Senior leadership and stakeholders
Because of its intuitive design, both analysts and managers can use it confidently.
Best Practices for the Digital Streaming Platforms KPI Dashboard in Excel
1. Define KPIs Clearly
Always maintain accurate definitions and formulas in the KPI Definition sheet.
2. Update Data Regularly
Update actual, target, and previous-year data monthly for reliable insights.
3. Validate Inputs Before Analysis
Check for missing or incorrect values before reviewing performance.
4. Group KPIs Logically
Group KPIs into categories such as engagement, revenue, retention, and content performance.
5. Focus on Trends, Not Just Status
Review KPI Trend charts to understand long-term performance patterns.
6. Train Users on KPI Interpretation
Ensure users understand Lower the Better and Upper the Better logic.
What Challenges Does This Dashboard Solve?
-
Manual and time-consuming KPI reporting
-
Inconsistent performance tracking
-
Limited visibility into trends
-
Difficulty comparing targets and actuals
-
Errors caused by complex calculations
Because of its structured design, the dashboard solves these challenges effectively.
How Does This Dashboard Support Strategic Planning?
By combining MTD, YTD, and historical data, the dashboard supports:
-
Subscriber growth planning
-
Content performance evaluation
-
Budget and cost control
-
Long-term platform strategy
As a result, leadership teams can make confident, data-driven decisions.
Conclusion
A Digital Streaming Platforms KPI Dashboard in Excel offers a simple yet powerful way to track performance, monitor targets, and analyze trends. Instead of relying on disconnected reports, streaming platforms gain a centralized, transparent, and easy-to-use performance management solution.
With structured input sheets, dynamic dashboards, and clear visual indicators, this KPI dashboard supports better decisions and stronger accountability. Therefore, any digital streaming platform aiming to improve performance tracking should adopt this dashboard.
Frequently Asked Questions (FAQs)
What is a Digital Streaming Platforms KPI Dashboard in Excel?
It is a ready-to-use Excel dashboard that tracks MTD, YTD, target, and previous-year performance for streaming KPIs.
Can I customize KPIs in this dashboard?
Yes, you can easily add or modify KPIs through the KPI Definition sheet.
Does the dashboard support monthly and yearly analysis?
Yes, it supports both MTD and YTD analysis with year-over-year comparisons.
Is Excel suitable for streaming KPI analysis?
Yes, Excel works well for structured KPI tracking and reporting in most streaming use cases.
Can non-technical users use this dashboard?
Yes, the dashboard uses drop-downs, buttons, and visuals that are easy to understand.
How often should the dashboard be updated?
You should update it monthly or as per your reporting cycle to maintain accuracy.
Click to Purchases Digital Streaming Platforms KPI Dashboard in Excel
Visit our YouTube channel to learn step-by-step video tutorials