Managing purchasing activities in a refinery is never easy. Refineries deal with high-value procurement, multiple vendors, strict budgets, and continuous operational demands. Therefore, teams need a system that helps them track spending, control costs, analyze supplier performance, and make faster decisions.
That is exactly where the Refinery Purchasing Dashboard in Excel becomes an essential tool.
In this detailed article, you will learn everything about the Refinery Purchasing Dashboard in Excel, including its structure, features, advantages, best practices, and real-world benefits. Moreover, this guide explains how this dashboard helps refinery procurement teams gain full visibility into purchasing performance and cost control.
Click to Purchases Refinery Purchasing Dashboard in Excel
✅ What Is a Refinery Purchasing Dashboard in Excel?
A Refinery Purchasing Dashboard in Excel is a centralized analytical tool designed to track and monitor all purchasing-related activities within a refinery.
Instead of managing multiple Excel files, emails, and reports, this dashboard combines all purchasing data into one interactive Excel file. As a result, procurement teams can easily analyze:
-
Purchase costs
-
Budget utilization
-
High-priority purchases
-
Supplier spending
-
Category-wise procurement
-
Department-wise purchasing
-
Monthly purchasing trends
Moreover, since the dashboard works entirely in Excel, users do not need any advanced BI tools or technical knowledge.
✅ Why Do Refineries Need a Purchasing Dashboard?
Refineries deal with complex procurement operations every day. They purchase raw materials, spare parts, chemicals, services, and maintenance items regularly. Without a proper tracking system, organizations face:
-
Cost overruns
-
Poor budget visibility
-
Inefficient vendor management
-
Delayed approvals
-
Lack of performance insights
Therefore, a Refinery Purchasing Dashboard in Excel helps solve these challenges by offering real-time visibility, structured reporting, and actionable insights.
📊 Key Features of the Refinery Purchasing Dashboard in Excel
This dashboard is professionally designed and contains multiple analytical pages that provide deep insights into purchasing performance.
Let’s explore each feature in detail.
🔹 1. Page Navigator – Easy & Quick Navigation
First of all, the dashboard includes a Page Navigator placed on the left side of the dashboard.
✅ Why This Feature Matters
-
Allows quick navigation between pages
-
Saves time while analyzing reports
-
Improves user experience
-
Makes the dashboard easy for beginners
Because of this navigation panel, users can switch between analysis pages without searching or scrolling.
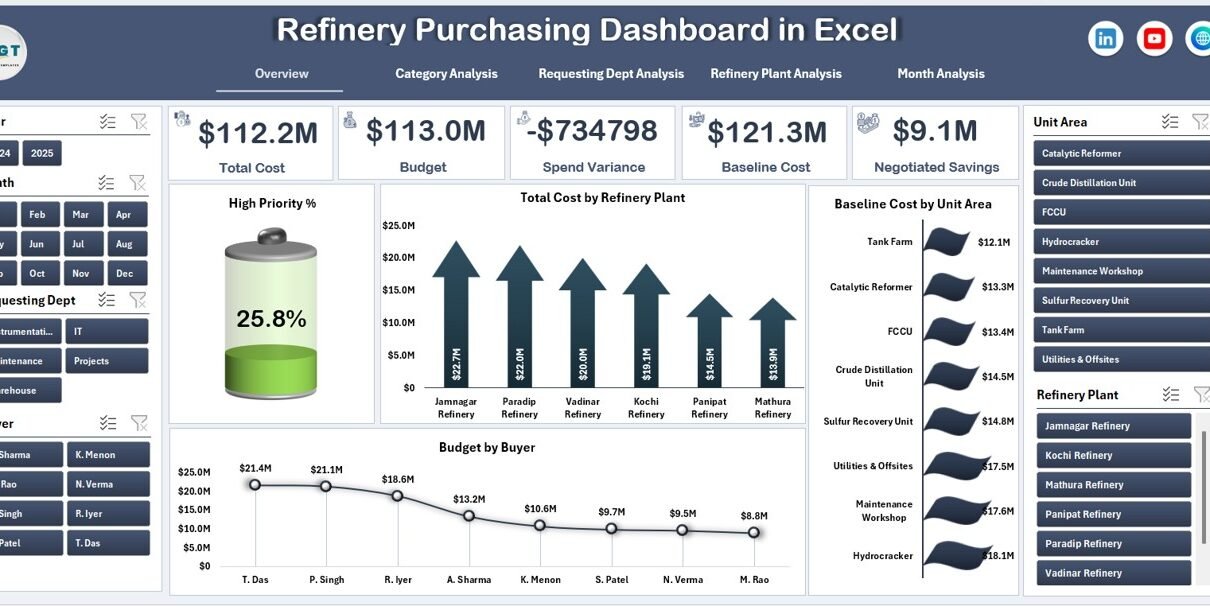
🔹 2. Overview Page – Complete Purchasing Summary
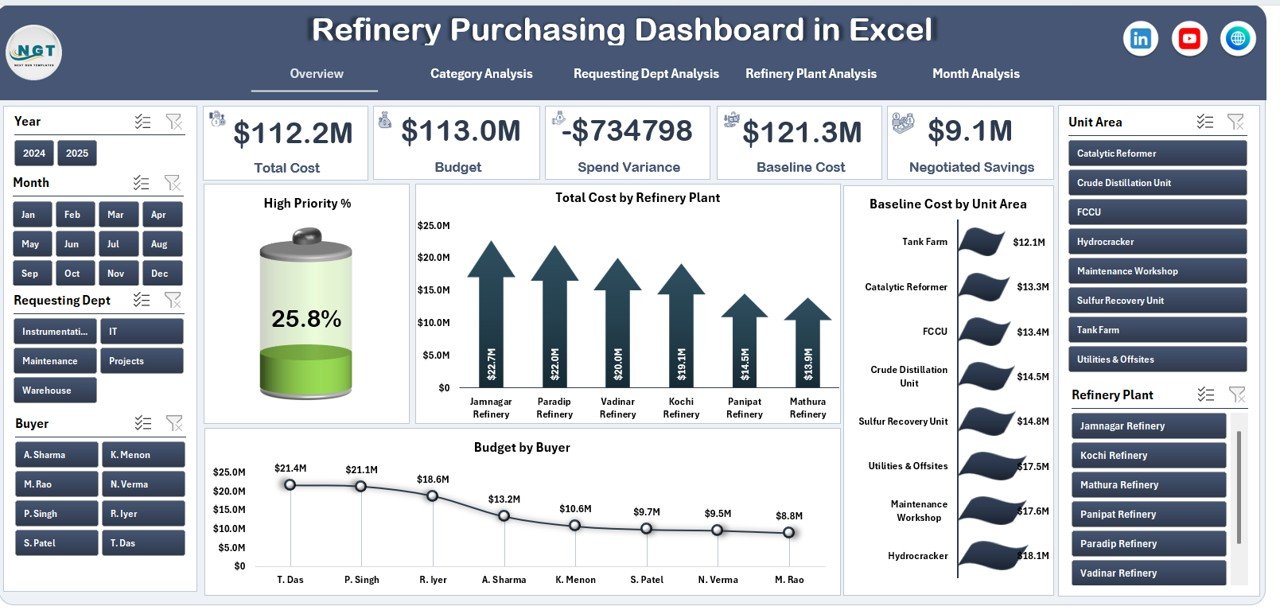
The Overview Page acts as the main control center of the dashboard.
📌 Key Highlights of the Overview Page:
-
Located as the primary dashboard screen
-
Displays high-level purchasing KPIs
-
Provides a quick summary of procurement performance
📊 Charts Available on the Overview Page:
✔ High Priority % – Shows urgent or critical purchase share
✔ Total Cost by Refinery Plant – Displays spending per plant
✔ Baseline Cost by Unit Area – Helps analyze cost benchmarks
✔ Budget by Buyer – Tracks purchasing responsibility
Click to Purchases Refinery Purchasing Dashboard in Excel
🎯 Why This Page Is Important:
-
Provides instant performance insights
-
Helps identify cost-heavy areas
-
Supports quick management decisions
-
Improves purchasing transparency
🔹 3. Category Analysis – Understand Spending by Category
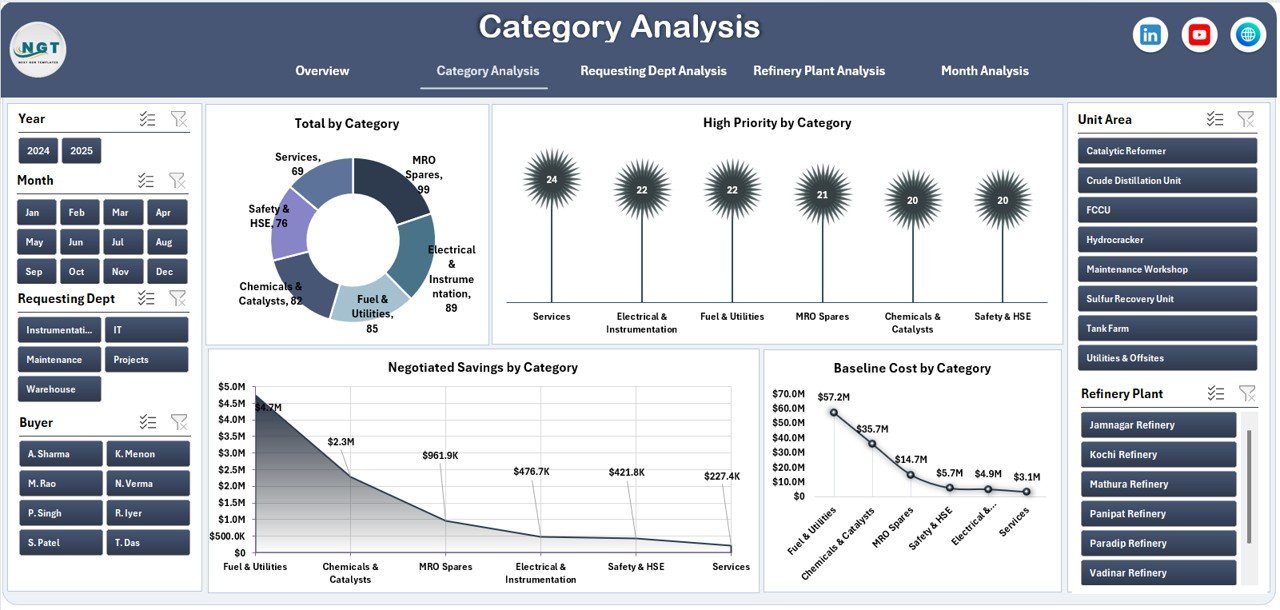
The Category Analysis page focuses on understanding how money gets spent across different purchasing categories.
📊 Charts Included:
-
Total by Category
-
High Priority by Category
-
Negotiated Saving by Category
-
Baseline Cost by Category
✅ Benefits of Category Analysis:
-
Identifies high-cost procurement categories
-
Highlights savings achieved through negotiation
-
Helps control unnecessary spending
-
Supports vendor and contract strategy
Because of this view, procurement managers can easily identify categories that need cost optimization.
🔹 4. Requesting Department Analysis – Track Department Spending

The Requesting Department Analysis page helps organizations monitor purchasing behavior across departments.
📊 Charts Available:
-
Total by Requesting Department
-
Budget by Requesting Department
-
Baseline Cost by Requesting Department
-
Total Requests by Department
📈 Why This Analysis Matters:
-
Tracks department-wise spending trends
-
Identifies departments with high procurement demand
-
Helps allocate budgets more efficiently
-
Encourages accountability across teams
As a result, management gains better control over internal purchasing activities.
🔹 5. Refinery Plant Analysis – Plant-Wise Cost Control

This section provides detailed insights into purchasing activity across different refinery plants.
📊 Charts Included:
-
Budget by Refinery Plant
-
Baseline Cost by Refinery Plant
-
High Priority % by Refinery Plant
-
Negotiated Saving by Refinery Plant
✅ Benefits:
-
Compares purchasing efficiency across plants
-
Highlights plants with higher cost deviations
-
Identifies opportunities for cost reduction
-
Supports plant-level decision-making
Therefore, this page plays a crucial role in operational cost control.
🔹 6. Month Analysis – Track Trends Over Time
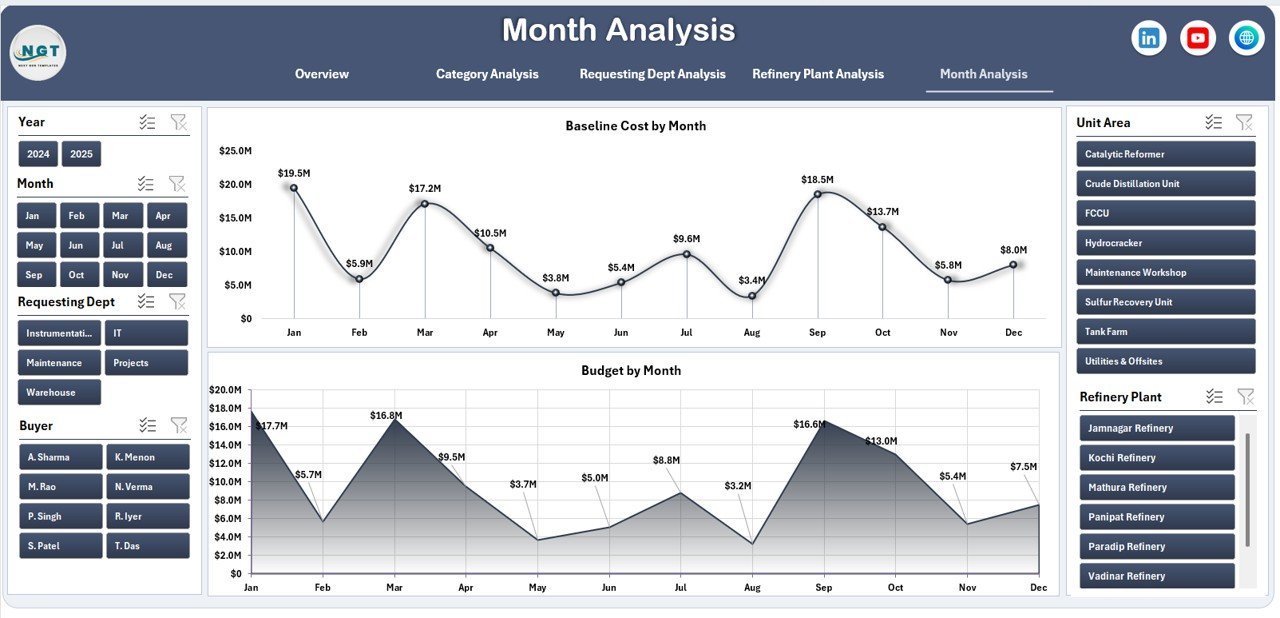
The Month Analysis page helps users analyze purchasing trends over time.
📊 Charts Included:
-
Budget by Month
-
Baseline Cost by Month
🔍 Why Monthly Analysis Is Important:
-
Identifies spending trends
-
Helps forecast future budgets
-
Detects seasonal variations
-
Supports better financial planning
With this view, organizations can plan purchases more effectively and avoid budget surprises.
Click to Purchases Refinery Purchasing Dashboard in Excel
🔹 7. Support Sheet & Data Sheet
📂 Data Sheet
-
Stores all raw purchasing data
-
Acts as the backend of the dashboard
-
Supports automatic chart updates
📂 Support Sheet
-
Helps with calculations
-
Stores helper formulas
-
Ensures smooth dashboard functionality
These sheets work silently in the background to deliver accurate insights.
✅ Advantages of Refinery Purchasing Dashboard in Excel
Let’s now explore the key advantages of using this dashboard.
⭐ 1. Centralized Data Management
-
All purchasing data in one file
-
No need for multiple reports
-
Easy data tracking
⭐ 2. Improved Cost Control
-
Tracks baseline vs actual cost
-
Highlights high-priority spending
-
Supports cost-saving decisions
⭐ 3. Better Decision Making
-
Visual charts simplify analysis
-
Real-time insights
-
Faster management actions
⭐ 4. Time-Saving
-
Eliminates manual reporting
-
Automated calculations
-
Ready-to-use visuals
⭐ 5. Easy Customization
-
Fully editable Excel file
-
Add or remove KPIs easily
-
No coding required
⭐ 6. Improved Transparency
-
Clear budget visibility
-
Department-wise tracking
-
Plant-wise performance analysis
✅ Best Practices for Using the Refinery Purchasing Dashboard
To get the maximum value from this dashboard, follow these best practices:
✔ Maintain Accurate Data
Always enter correct and complete purchasing data to ensure reliable results.
✔ Update Data Regularly
Update the dashboard weekly or monthly to keep insights current.
✔ Use Category & Department Filters
Analyze spending patterns using category and department views.
✔ Monitor High-Priority Purchases
Track urgent purchases to avoid budget overruns.
✔ Review Monthly Trends
Use month-wise analysis to forecast future budgets.
✔ Share Dashboard with Stakeholders
Allow procurement and management teams to review performance together.
✅ Who Should Use This Dashboard?
This dashboard is ideal for:
-
Refinery Procurement Teams
-
Purchase Managers
-
Supply Chain Managers
-
Finance & Budget Teams
-
Operations Managers
-
Cost Control Analysts
It suits both small and large refinery operations.
✅ Why Excel Is the Best Choice for This Dashboard?
Excel remains the most widely used business tool across industries.
Key Benefits:
-
Easy to use
-
No extra software required
-
Highly customizable
-
Supports charts and automation
-
Works offline
Therefore, an Excel-based purchasing dashboard ensures flexibility and accessibility.
✅ Conclusion
The Refinery Purchasing Dashboard in Excel is a powerful and practical solution for managing procurement operations efficiently. It helps organizations track spending, monitor budgets, analyze trends, and improve purchasing decisions.
With its structured design, dynamic charts, and easy navigation, this dashboard simplifies complex purchasing data into meaningful insights. Moreover, it empowers procurement teams to control costs, improve transparency, and enhance operational efficiency.
If your refinery wants better purchasing control, improved reporting, and smarter decision-making, this dashboard is the perfect solution.
❓ Frequently Asked Questions (FAQs)
❓ What is a Refinery Purchasing Dashboard in Excel?
A Refinery Purchasing Dashboard in Excel is a reporting tool that tracks purchasing costs, budgets, categories, and performance in one interactive Excel file.
❓ Who can use this dashboard?
Procurement managers, finance teams, plant managers, and supply chain professionals can use this dashboard.
❓ Do I need advanced Excel skills to use it?
No. The dashboard is user-friendly and works with basic Excel knowledge.
❓ Can I customize the dashboard?
Yes. You can add or remove charts, modify KPIs, and update data as per your needs.
❓ Does the dashboard support monthly analysis?
Yes. The dashboard includes a dedicated Month Analysis section to track trends over time.
❓ Is this dashboard suitable for large refineries?
Yes. It works well for both small and large refinery operations.
Visit our YouTube channel to learn step-by-step video tutorials