Managing electricity projects without a structured performance system often creates delays, budget overruns, and unclear reporting. However, when project teams use a centralized KPI dashboard in Excel, they gain clarity, control, and confidence in decision-making. Therefore, organizations increasingly rely on an Electricity Project KPI Dashboard in Excel to track performance accurately and consistently.
In this detailed guide, you will learn everything about the Electricity Project KPI Dashboard in Excel. Moreover, you will understand its structure, worksheets, benefits, best practices, and real-world applications. Additionally, this article explains how Excel dashboards simplify complex electricity project data into clear insights.
Click to buy Electricity Project KPI Dashboard in Excel
What Is an Electricity Project KPI Dashboard in Excel?
An Electricity Project KPI Dashboard in Excel is a structured and interactive reporting tool that helps organizations monitor key performance indicators related to electricity projects. Instead of using multiple spreadsheets, this dashboard consolidates all KPIs into one centralized Excel file.
As a result, project managers, engineers, and stakeholders can track progress, compare targets, analyze trends, and identify issues quickly. Furthermore, Excel offers flexibility, ease of use, and wide adoption across industries.
Because Excel supports formulas, pivot tables, charts, slicers, and conditional formatting, this dashboard delivers powerful insights without requiring advanced technical skills.
Why Do Electricity Projects Need a KPI Dashboard?
Electricity projects involve multiple tasks, timelines, budgets, and compliance requirements. Therefore, manual tracking often leads to errors and delays. However, a KPI dashboard changes this situation completely.
Electricity projects need a KPI dashboard because:
- It centralizes all project performance data
- It improves transparency and accountability
- It enables faster decision-making
- It highlights risks before they escalate
- It tracks progress against targets consistently
Consequently, organizations that use KPI dashboards complete projects more efficiently and cost-effectively.
How Does an Electricity Project KPI Dashboard Improve Decision-Making?
Decision-making improves significantly when teams view real-time performance metrics. Instead of guessing or waiting for manual reports, stakeholders see accurate data instantly.
An Electricity Project KPI Dashboard in Excel improves decision-making by:
- Showing MTD and YTD performance at a glance
- Comparing actuals with targets and previous year data
- Highlighting deviations using visual indicators
- Allowing quick month and KPI filtering
Therefore, managers focus on corrective actions rather than data preparation.
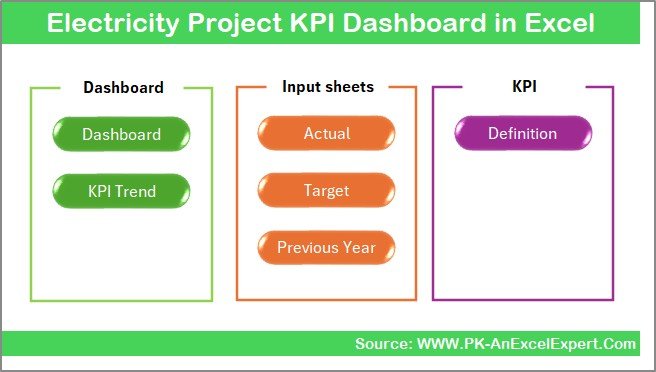
Overview of the Electricity Project KPI Dashboard Structure
In this Electricity Project KPI Dashboard in Excel, we have designed 7 structured worksheets. Each sheet serves a specific purpose and supports smooth data flow across the dashboard.
Let us explore each worksheet in detail.
the Summary Page
The Summary Page acts as the index of the dashboard. It improves navigation and user experience significantly.
Key Features of the Summary Page
- Serves as the landing page of the dashboard
- Contains 6 navigation buttons
- Allows users to jump directly to any worksheet
- Saves time and improves usability
Because of this structured design, users do not waste time searching for sheets.
Click to buy Electricity Project KPI Dashboard in Excel
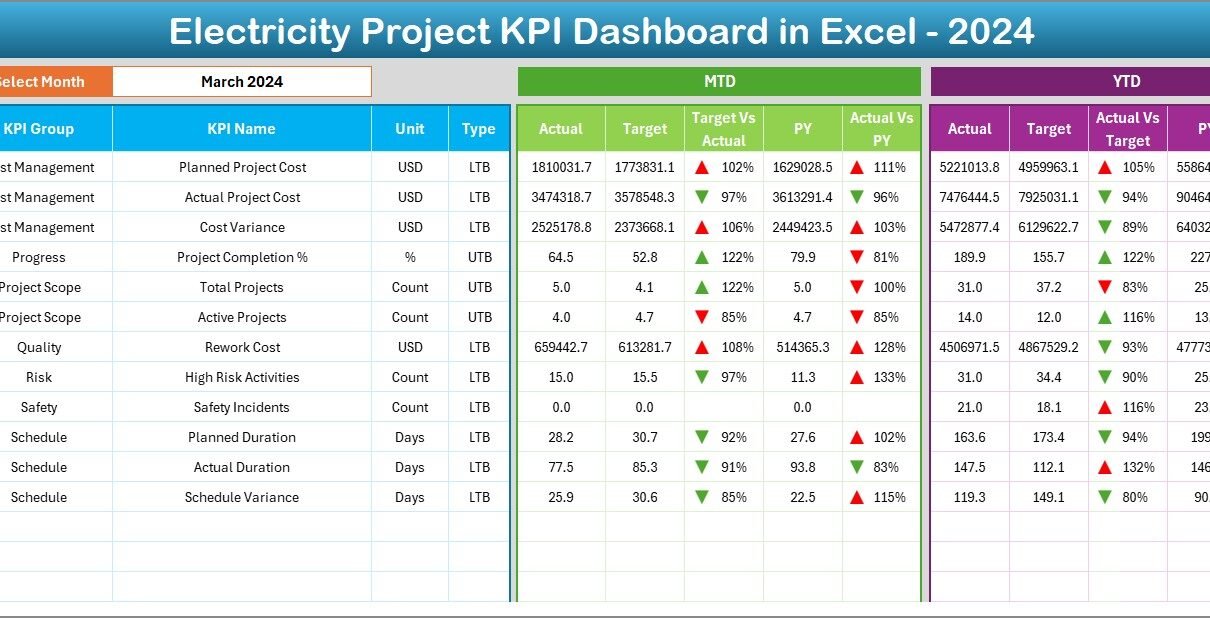
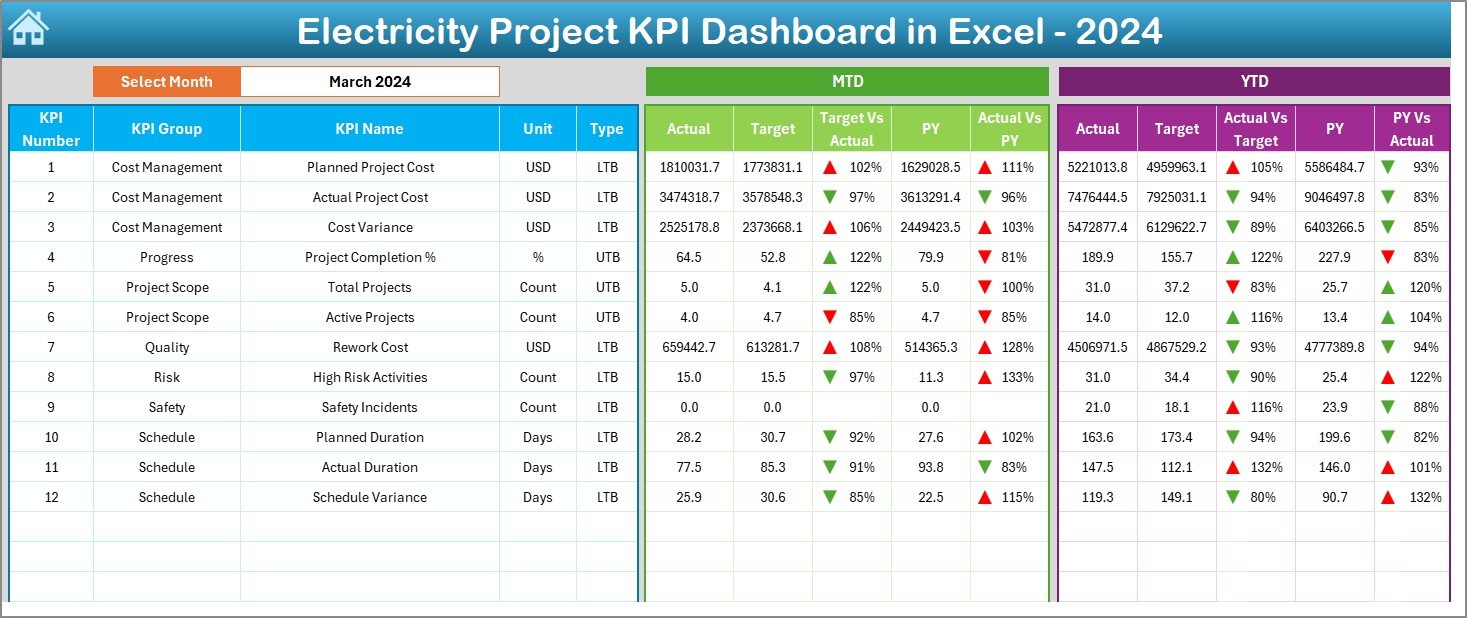
Dashboard Sheet
The Dashboard Sheet is the core of the Electricity Project KPI Dashboard in Excel. It displays all KPI performance information in a single view.
Key Highlights of the Dashboard Sheet
- Displays all electricity project KPIs
- Month selection available in cell D3
- Automatically updates all numbers when the month changes
- Shows both MTD and YTD performance
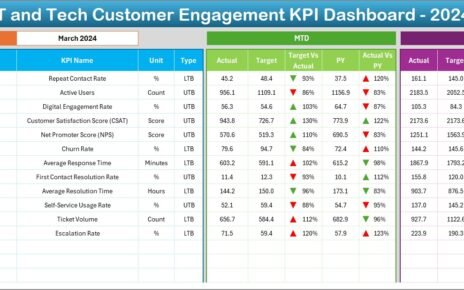
KPI Metrics Displayed on the Dashboard
For each KPI, the dashboard shows:
- MTD Actual
- MTD Target
- MTD Previous Year
- Target vs Actual %
- Previous Year vs Actual %
Similarly, for YTD:
- YTD Actual
- YTD Target
- YTD Previous Year
- Target vs Actual %
- Previous Year vs Actual %
Visual Indicators for Better Insights
- Up and down arrows using conditional formatting
- Color coding for positive and negative performance
- Clear visual comparison for faster interpretation
As a result, users instantly identify underperformance or achievement.
Click to buy Electricity Project KPI Dashboard in Excel
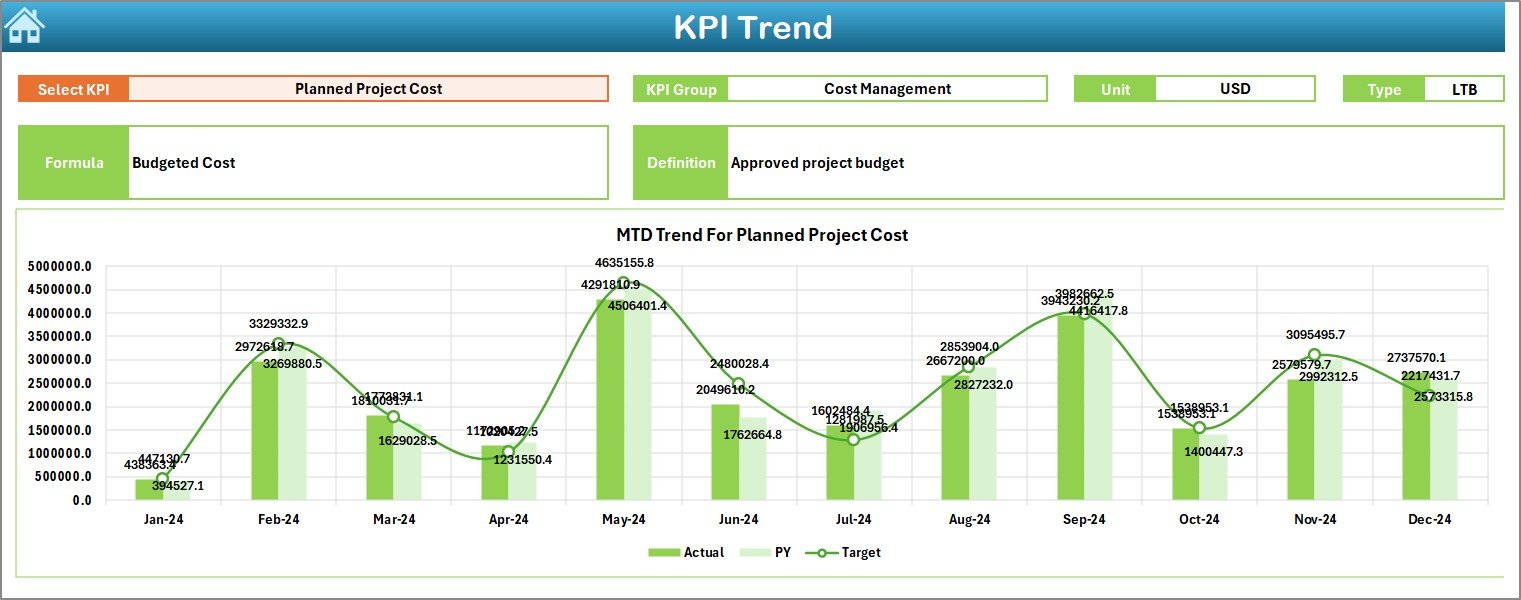
Trend Sheet
The Trend Sheet focuses on KPI trends and definitions. It helps users understand how performance changes over time.
Key Features of the Trend Sheet
- KPI selection dropdown available in cell C3
Displays detailed KPI information:
KPI Group
KPI Unit
KPI Type (Lower the Better or Upper the Better)
KPI Formula
KPI Definition
Trend Analysis Charts
The Trend Sheet includes:
- MTD trend chart for Actual, Target, and Previous Year
- YTD trend chart for Actual, Target, and Previous Year
Therefore, users can easily identify seasonal patterns, improvements, or declines.
Click to buy Electricity Project KPI Dashboard in Excel
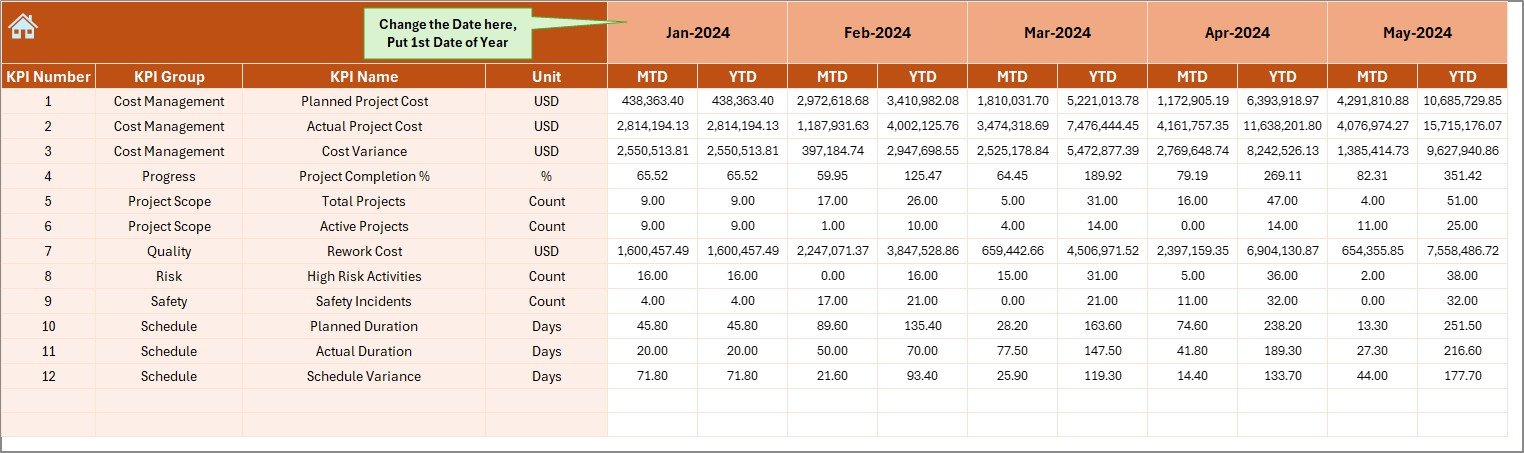
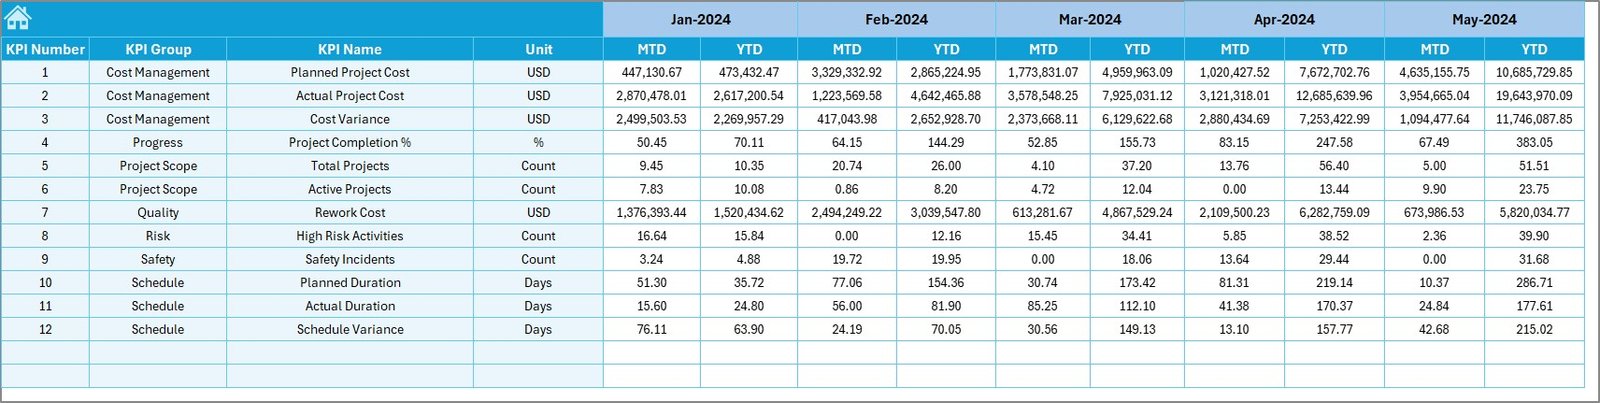
Actual Numbers Input
The Actual Numbers Input Sheet allows users to enter real performance data for electricity projects.
How This Sheet Works
- Users enter MTD and YTD actual values
- Month selection available in cell E1
- Users input the first month of the year in E1
- The dashboard updates automatically based on this input
Because of this structure, data entry remains simple and controlled.
Click to buy Electricity Project KPI Dashboard in Excel
Target Sheet
The Target Sheet stores planned KPI values for electricity projects.
Key Responsibilities of the Target Sheet
- Users enter monthly target values
- Supports both MTD and YTD targets
- Acts as the benchmark for performance comparison
As a result, the dashboard clearly highlights gaps between planned and actual performance.
Click to buy Electricity Project KPI Dashboard in Excel
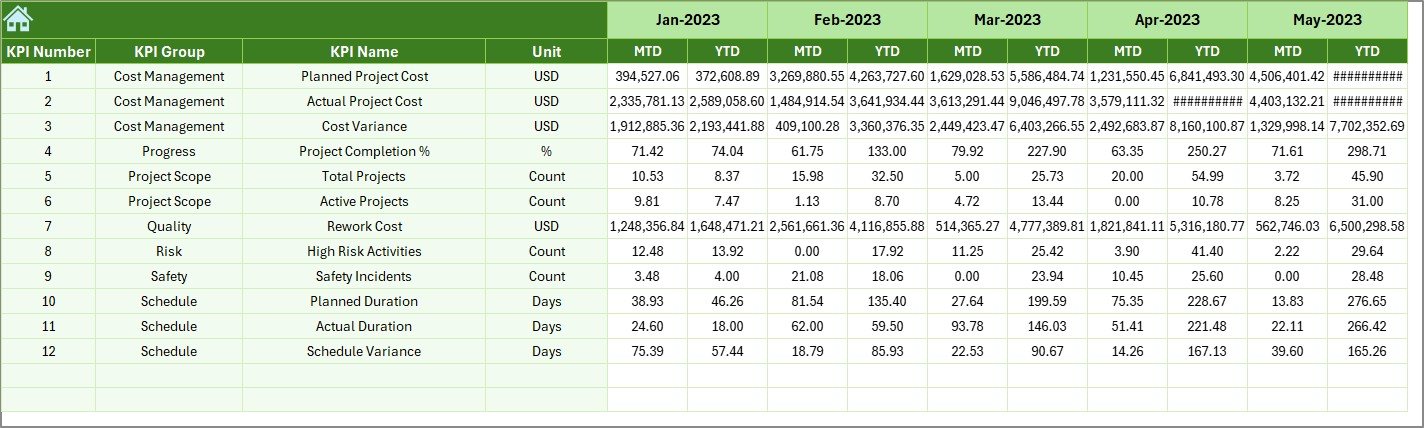
Previous Year Number Sheet
The Previous Year Number Sheet stores historical performance data.
Benefits of Including Previous Year Data
- Enables year-over-year comparison
- Helps identify growth or decline trends
- Supports strategic planning and forecasting
Users enter data in the same structure as the current year, ensuring consistency.
Click to buy Electricity Project KPI Dashboard in Excel
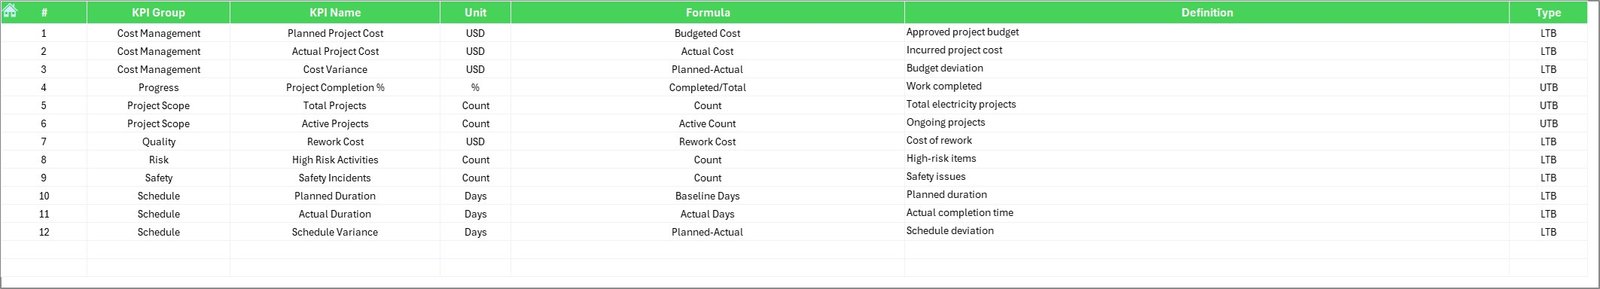
the KPI Definition Sheet
The KPI Definition Sheet acts as the reference layer of the dashboard.
Key Details Stored in This Sheet
- KPI Name
- KPI Group
- KPI Unit
- KPI Formula
- KPI Definition
Because of this sheet, users clearly understand what each KPI measures and how calculations work.
Click to buy Electricity Project KPI Dashboard in Excel
What KPIs Can You Track in an Electricity Project Dashboard?
An Electricity Project KPI Dashboard in Excel supports a wide range of KPIs, such as:
- Project completion percentage
- Power generation efficiency
- Downtime hours
- Cost variance
- Schedule variance
- Energy loss percentage
- Safety incident rate
- Maintenance efficiency
Therefore, organizations can customize KPIs based on project goals.
Advantages of Electricity Project KPI Dashboard in Excel
Using an Electricity Project KPI Dashboard in Excel delivers multiple benefits across teams and stakeholders.
Key Advantages
- Centralized KPI tracking in one file
- Easy to use and update
- No advanced software required
- Real-time performance visibility
- Improved accountability
- Faster decision-making
- Clear visual insights
- Historical and trend analysis
As a result, project teams work smarter and more efficiently.
How Does Excel Make KPI Dashboards Cost-Effective?
Excel dashboards eliminate the need for expensive BI tools. Since most organizations already use Excel, implementation costs remain low.
Additionally:
- No licensing costs
- Easy customization
- Offline accessibility
- Quick deployment
Therefore, Excel remains a powerful and budget-friendly solution.
Best Practices for the Electricity Project KPI Dashboard in Excel
Following best practices ensures accurate insights and long-term dashboard success.
- Define Clear KPIs
Always define KPIs clearly before implementation. Use measurable and relevant metrics aligned with project goals.
- Maintain Data Accuracy
Ensure users enter data correctly and consistently. Validate inputs where possible.
- Use Consistent Time Periods
Keep MTD and YTD logic consistent across all sheets to avoid confusion.
- Keep the Dashboard Simple
Avoid clutter. Focus on meaningful KPIs instead of excessive metrics.
- Update Data Regularly
Schedule regular updates to maintain dashboard relevance.
- Document KPI Definitions
Always maintain a KPI definition sheet to avoid misinterpretation.
- Use Visual Indicators Wisely
Use colors, arrows, and charts to enhance clarity, not distraction.
How Can Organizations Customize This Dashboard?
Organizations can customize the Electricity Project KPI Dashboard in Excel easily by:
- Adding new KPIs
- Modifying KPI groups
- Changing target structures
- Adjusting chart types
- Adding slicers or filters
Therefore, the dashboard adapts to different electricity project types.
Who Should Use an Electricity Project KPI Dashboard?
This dashboard benefits multiple roles, including:
- Project managers
- Electrical engineers
- Operations teams
- Finance teams
- Senior management
- Compliance officers
Because of its flexibility, teams across departments gain value.
Conclusion: Why an Electricity Project KPI Dashboard in Excel Is Essential
An Electricity Project KPI Dashboard in Excel transforms raw project data into meaningful insights. It centralizes KPIs, improves transparency, and enables faster, data-driven decisions. Moreover, its structured worksheets, visual indicators, and trend analysis support efficient project management.
By following best practices and maintaining accurate data, organizations can maximize the value of this dashboard. Ultimately, this Excel-based solution helps electricity projects stay on track, within budget, and aligned with strategic goals.
Frequently Asked Questions (FAQs)
What is an Electricity Project KPI Dashboard in Excel?
An Electricity Project KPI Dashboard in Excel is a centralized reporting tool that tracks key performance indicators for electricity projects using interactive visuals and automated calculations.
Can beginners use this dashboard easily?
Yes, beginners can use it easily because it relies on standard Excel features and simple data entry.
How often should data be updated?
Teams should update data monthly or as per project reporting cycles for accurate insights.
Can this dashboard handle multiple projects?
Yes, with customization, users can track multiple electricity projects within one dashboard.
Does this dashboard require macros or VBA?
No, this dashboard works using standard Excel formulas, charts, and formatting.
Can organizations add new KPIs later?
Yes, the dashboard structure allows easy addition of new KPIs without redesigning the file.
Watch the step-by-step video tutorial:
Visit our YouTube channel to learn step-by-step video tutorials
Click to buy Electricity Project KPI Dashboard in Excel