Managing contracts in smart city projects demands clarity, control, and continuous performance monitoring. However, many organizations still rely on scattered spreadsheets, manual tracking, and delayed reports. As a result, decision-makers struggle to track performance, identify risks, and ensure compliance. That is exactly why a Smart Cities Contract KPI Dashboard in Excel becomes a powerful and practical solution.
In this detailed, SEO-friendly guide, you will learn everything about the Smart Cities Contract KPI Dashboard in Excel. Moreover, you will understand what it is, why it matters, how it works, its worksheet structure, advantages, best practices, and real-world use cases. Additionally, this article explains how Excel dashboards transform complex contract data into clear, visual, and actionable insights—without expensive software or technical complexity.
Click to buy Smart Cities Contract KPI Dashboard in Excel
What Is a Smart Cities Contract KPI Dashboard in Excel?
A Smart Cities Contract KPI Dashboard in Excel is a structured and interactive Excel-based reporting tool designed to track, analyze, and monitor key performance indicators related to smart city contracts. These contracts often cover infrastructure development, IT systems, utilities, mobility solutions, energy projects, and public services.
Instead of managing multiple Excel files and manual calculations, this dashboard consolidates all contract KPIs into one centralized Excel workbook. Consequently, contract managers, project teams, procurement departments, and city authorities gain instant visibility into contract performance.
Because Excel supports formulas, pivot tables, charts, slicers, and conditional formatting, this dashboard delivers advanced analytics while remaining easy to use and widely accessible.
Why Do Smart Cities Need a Contract KPI Dashboard in Excel?
Smart city contracts are complex by nature. They involve multiple vendors, milestones, budgets, timelines, and compliance requirements. Therefore, manual tracking often leads to delays, disputes, and cost overruns.
A Smart Cities Contract KPI Dashboard in Excel solves these problems by:
- Centralizing contract performance data
- Automating calculations and comparisons
- Highlighting risks and deviations early
- Improving transparency and accountability
- Supporting data-driven decisions
As a result, organizations gain better control over contract execution and long-term outcomes.
How Does a Smart Cities Contract KPI Dashboard in Excel Work?
The dashboard works by linking multiple structured input sheets with automated calculations and visual dashboards. Users enter actual values, targets, and previous-year data once. Then, Excel formulas and charts instantly update the dashboard.
Moreover, interactive elements like drop-downs and slicers allow users to change months or KPIs and view updated results in real time. Therefore, decision-makers always see the latest performance without manual effort.
What Are the Key Features of the Smart Cities Contract KPI Dashboard in Excel?
This dashboard comes with powerful features designed specifically for contract performance monitoring. Below are the most important ones.
Centralized KPI Monitoring
The dashboard tracks all contract-related KPIs in one Excel file. Therefore, users no longer need multiple spreadsheets or manual reports.
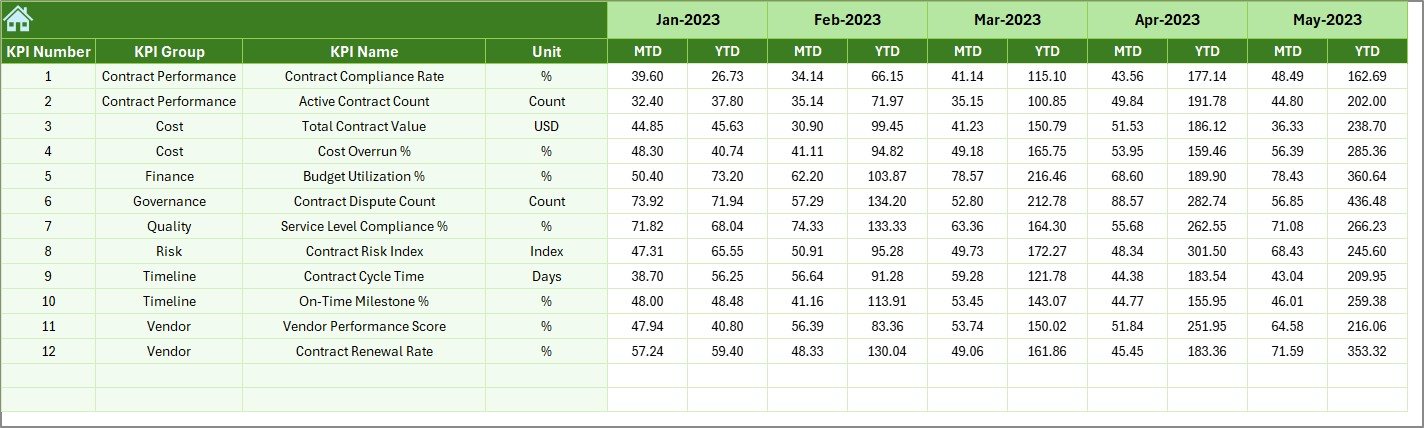
MTD and YTD Performance Tracking
The dashboard shows Month-to-Date (MTD) and Year-to-Date (YTD) performance for each KPI. As a result, users can analyze both short-term and long-term trends.
Target vs Actual Comparison
The dashboard compares actual performance against predefined targets. Consequently, performance gaps become visible instantly.
Previous Year Comparison
The dashboard also compares current-year performance with previous-year values. Therefore, users can evaluate improvement or decline over time.
Visual Performance Indicators
Conditional formatting with up and down arrows clearly shows positive or negative performance. As a result, users identify issues at a glance.
Dynamic Month Selection
A month drop-down allows users to change the reporting period. Consequently, the entire dashboard updates automatically.
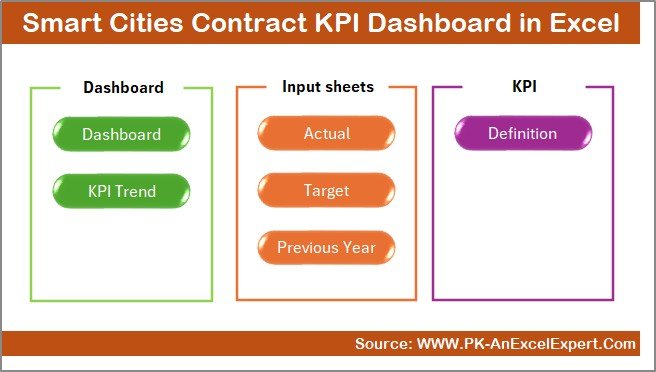
What Are the Worksheets Included in the Smart Cities Contract KPI Dashboard in Excel?
This dashboard includes 7 well-structured worksheets, each designed for a specific purpose. Let us explore them one by one.
Summary Page in the Dashboard
The Summary Page works as an index sheet. It contains six navigation buttons that allow users to jump directly to any worksheet.
Because of this design, users save time and navigate the dashboard smoothly. Moreover, the summary page improves user experience, especially for non-technical users.
Click to buy Smart Cities Contract KPI Dashboard in Excel
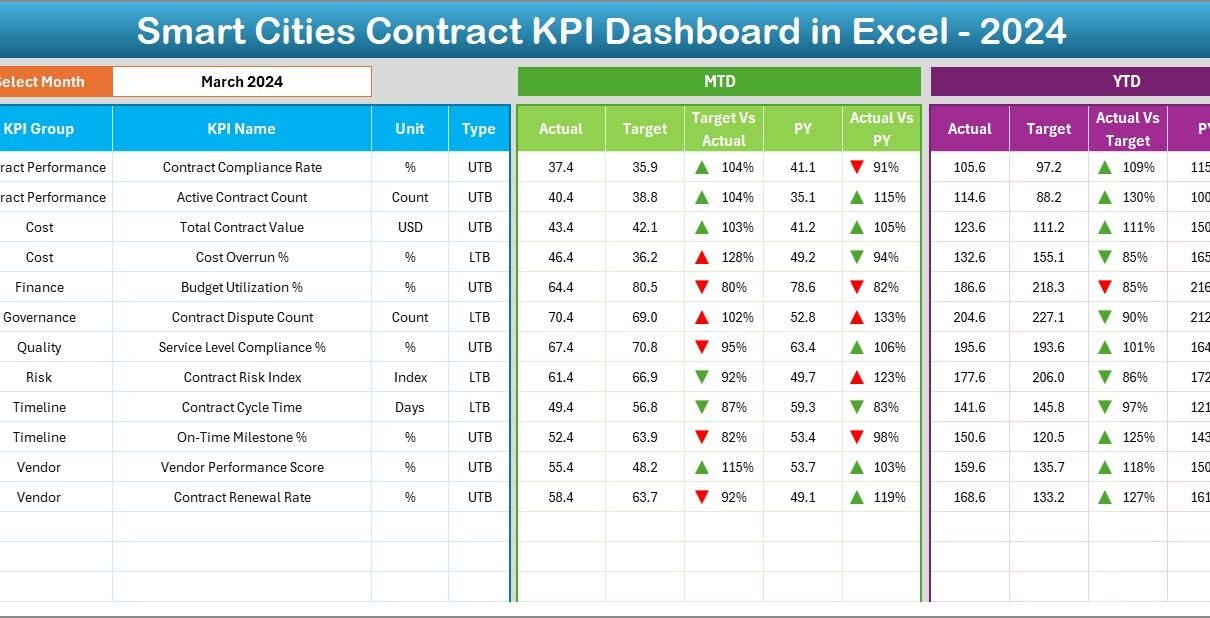
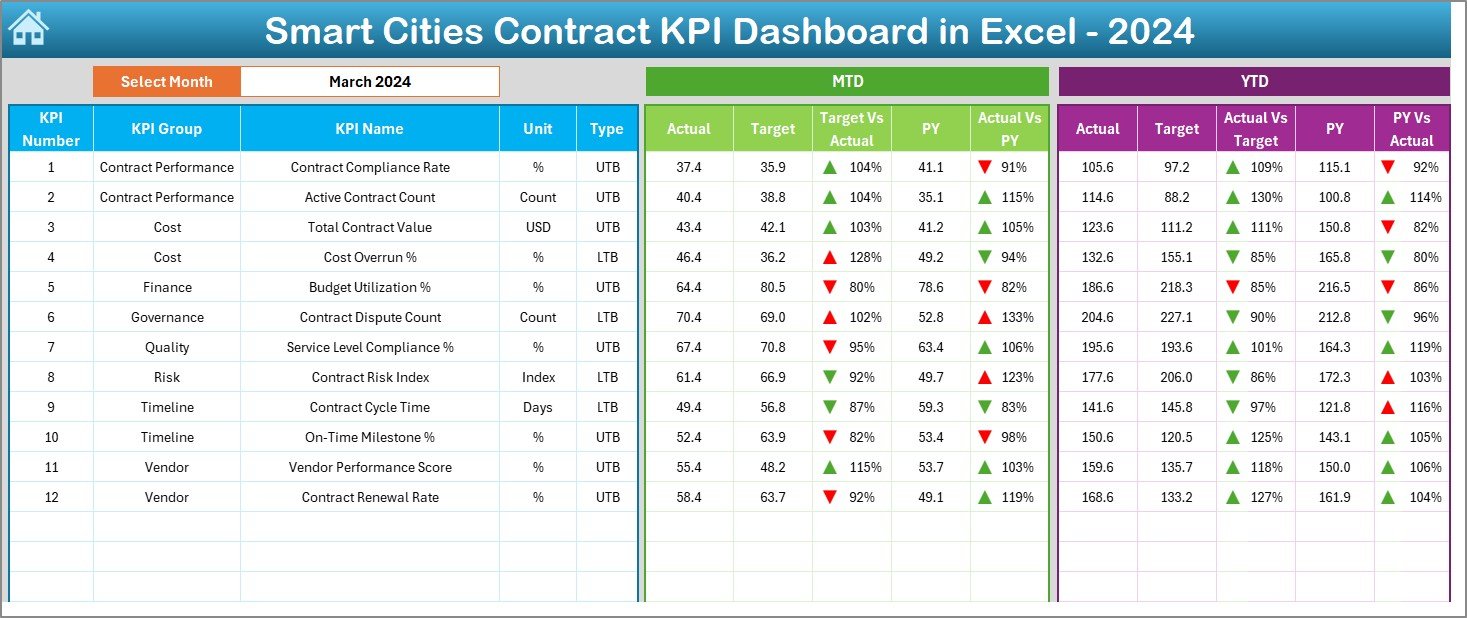
Dashboard Sheet Tab
The Dashboard Sheet is the heart of the Smart Cities Contract KPI Dashboard in Excel.
Key Highlights of the Dashboard Sheet
- Month selection available in cell D3
- Automatic update of all KPIs based on the selected month
- Display of MTD Actual, Target, and Previous Year
- Display of YTD Actual, Target, and Previous Year
- Automated Target vs Actual variance
- Automated Previous Year vs Actual comparison
- Conditional formatting with up and down arrows
Because everything updates dynamically, users always see accurate and current insights.
Click to buy Smart Cities Contract KPI Dashboard in Excel
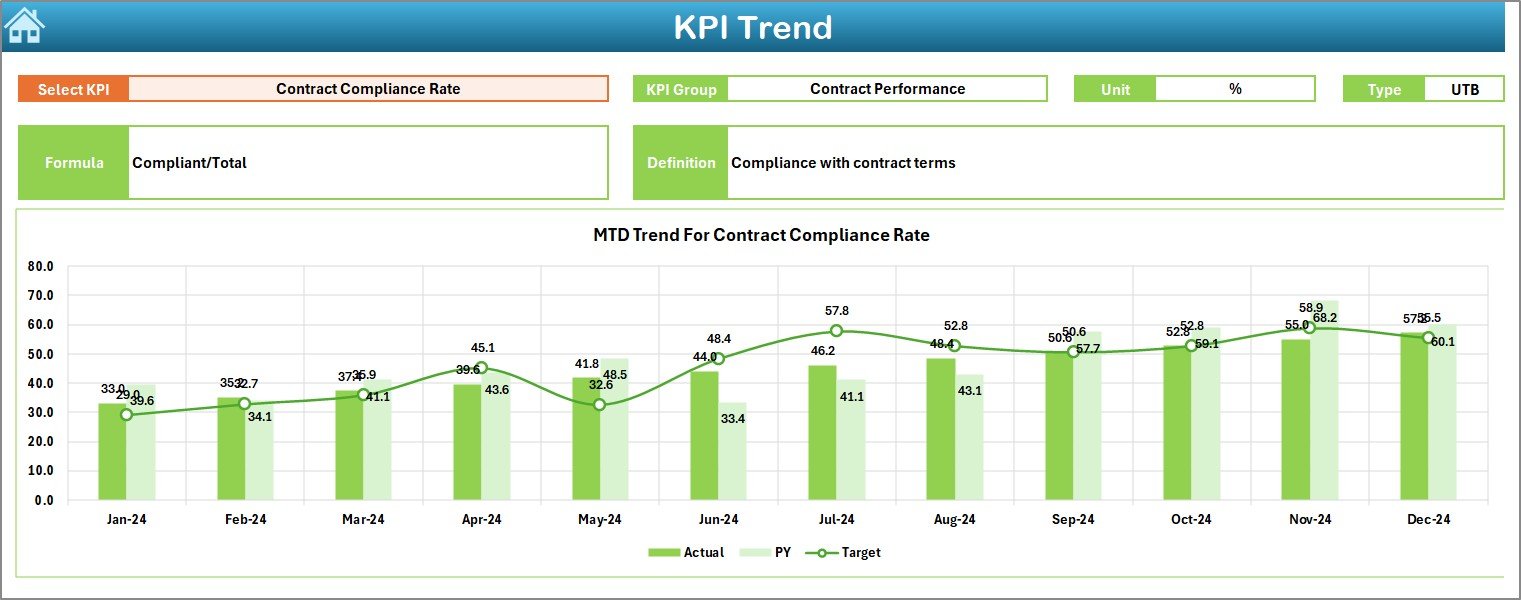
Trend Sheet Tab Used
The Trend Sheet Tab focuses on KPI-level analysis.
What Can You Do on the Trend Sheet?
- Select the KPI name from a drop-down in cell C3
- View KPI Group, Unit, KPI Type (LTB or UTB)
- Understand the KPI formula and definition
- Analyze MTD trend charts
- Analyze YTD trend charts
- Compare Actual, Target, and Previous Year trends
As a result, users gain deep insights into KPI behavior over time.
Click to buy Smart Cities Contract KPI Dashboard in Excel
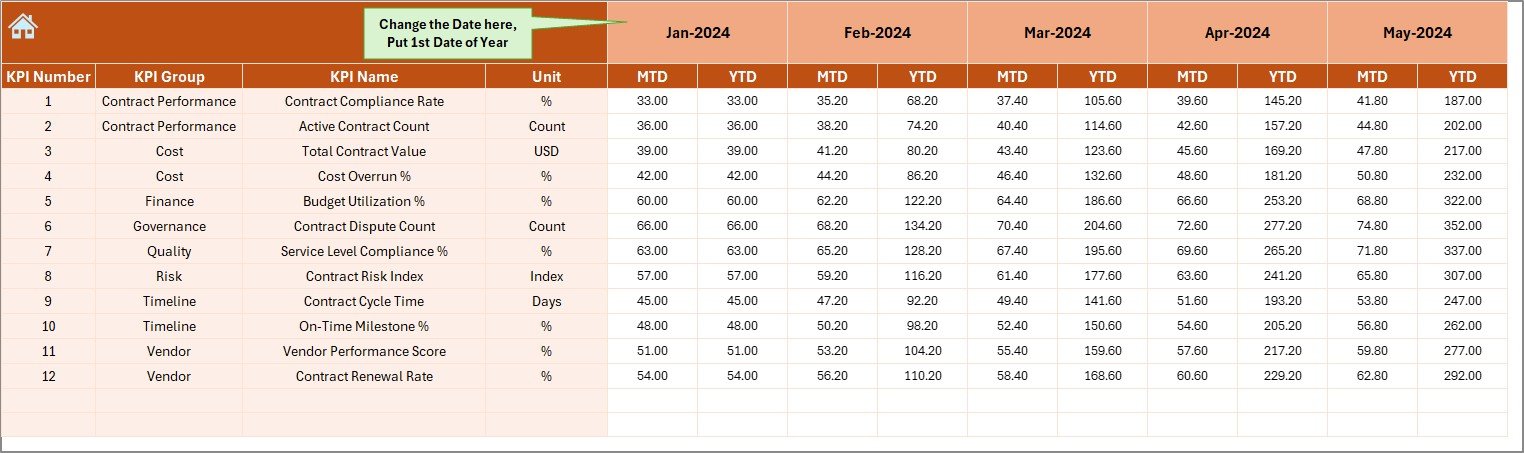
Actual Numbers Input Sheet Work
The Actual Numbers Input Sheet allows users to enter actual contract performance data.
Key Points
- Enter MTD and YTD actual values
- Change the starting month in cell E1
- Input data for each KPI once per month
Because data entry stays separate from analysis, errors reduce significantly.
Click to buy Smart Cities Contract KPI Dashboard in Excel
Target Sheet Tab
The Target Sheet Tab stores target values for each KPI.
Why This Sheet Matters
- Users enter monthly MTD and YTD targets
- Targets drive variance analysis
- Clear separation of targets and actuals improves accuracy
As a result, performance benchmarking becomes reliable and consistent.

Click to buy Smart Cities Contract KPI Dashboard in Excel
Why Is the Previous Year Number Sheet Important?
The Previous Year Number Sheet captures historical performance data.
Benefits of This Sheet
- Enables year-over-year comparison
- Supports trend analysis and forecasting
- Helps evaluate long-term contract improvements
Therefore, organizations can measure progress with confidence.
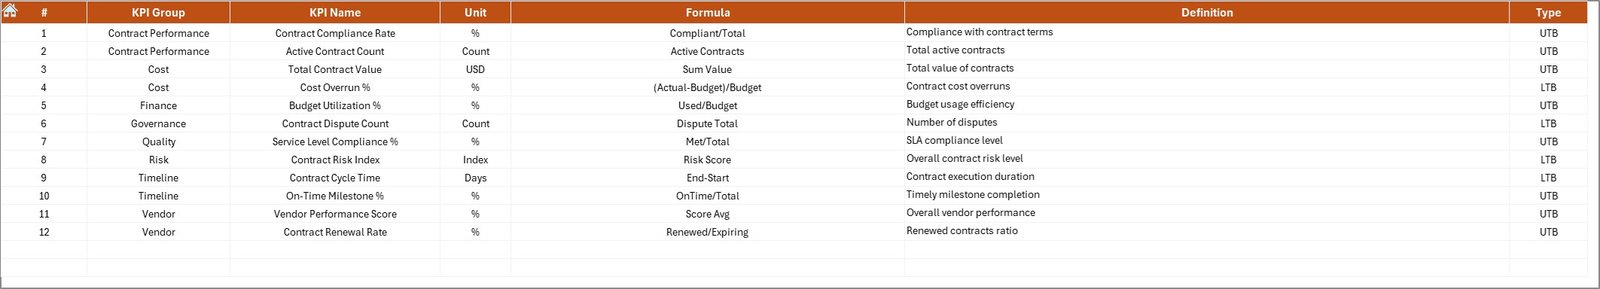
What Is the KPI Definition Sheet Tab?
The KPI Definition Sheet serves as a reference guide.
What Information Does It Contain?
- KPI Name
- KPI Group
- Unit of Measurement
- KPI Formula
- KPI Definition
- KPI Type (Lower the Better or Upper the Better)
Because of this sheet, all stakeholders understand KPIs clearly and consistently.
Click to buy Smart Cities Contract KPI Dashboard in Excel
Advantages of Smart Cities Contract KPI Dashboard in Excel
Using a Smart Cities Contract KPI Dashboard in Excel offers several strategic advantages.
Improved Transparency
The dashboard provides a single source of truth. As a result, stakeholders see the same data and insights.
Better Decision-Making
Visual KPIs highlight risks and opportunities quickly. Therefore, managers act faster and smarter.
Cost Control
Early detection of deviations helps prevent cost overruns. Consequently, budgets stay under control.
Time Savings
Automation eliminates manual calculations. As a result, teams save hours of reporting work.
Easy Customization
Because it is built in Excel, users customize KPIs, formats, and charts easily.
Who Should Use a Smart Cities Contract KPI Dashboard in Excel?
This dashboard benefits a wide range of professionals, including:
- Smart city project managers
- Contract managers
- Procurement teams
- Government authorities
- Infrastructure planners
- Finance and audit teams
Therefore, any organization managing smart city contracts can use this dashboard effectively.
Best Practices for the Smart Cities Contract KPI Dashboard in Excel
To get maximum value, follow these best practices.
Define Clear KPIs
Always define KPIs with clear formulas and definitions. As a result, everyone interprets data correctly.
Update Data Regularly
Enter actual, target, and previous-year data monthly. Consequently, insights stay accurate.
Use Consistent Units
Ensure all KPIs use consistent units. Therefore, comparisons remain meaningful.
Review Trends Monthly
Analyze trend charts every month. As a result, risks appear early.
Limit KPI Overload
Track only meaningful KPIs. Therefore, the dashboard stays focused and actionable.
How Does This Dashboard Support Smart City Governance?
Smart city governance requires accountability, transparency, and performance tracking. This dashboard supports governance by:
- Providing auditable performance records
- Supporting compliance monitoring
- Improving vendor accountability
- Enabling evidence-based decisions
As a result, city administrations gain better control over contract execution.
Can This Dashboard Be Used as a Template?
Yes, this Smart Cities Contract KPI Dashboard in Excel works as a ready-to-use template. Users can easily adapt it for:
- IT contracts
- Infrastructure contracts
- Utility service contracts
- Public-private partnership projects
Therefore, it becomes a scalable solution across departments.
Conclusion: Why Choose a Smart Cities Contract KPI Dashboard in Excel?
A Smart Cities Contract KPI Dashboard in Excel transforms contract management from reactive reporting to proactive performance control. Instead of struggling with scattered data and delayed insights, organizations gain clarity, speed, and confidence.
Because the dashboard combines structured data entry, automated calculations, interactive visuals, and trend analysis, it delivers enterprise-level insights without expensive tools. Therefore, it becomes the ideal solution for smart city contract monitoring.
Frequently Asked Questions (FAQs)
What is a Smart Cities Contract KPI Dashboard in Excel?
It is an Excel-based tool that tracks, analyzes, and visualizes key performance indicators related to smart city contracts.
Can non-technical users use this dashboard?
Yes, the dashboard uses simple Excel features and navigation buttons, making it easy for non-technical users.
Does the dashboard support MTD and YTD analysis?
Yes, it shows both Month-to-Date and Year-to-Date performance for all KPIs.
Can I customize KPIs in this dashboard?
Yes, you can add, remove, or modify KPIs easily using the KPI Definition Sheet.
Is this dashboard suitable for government organizations?
Yes, it supports transparency, compliance, and governance requirements, making it ideal for public-sector use.
Can this dashboard replace BI tools?
For many contract management needs, yes. It provides powerful insights without the cost and complexity of BI tools.
Visit our YouTube channel to learn step-by-step video tutorials