Ports manage large volumes of procurement every day. From equipment and spare parts to services and infrastructure materials, purchasing activities directly impact cost control, operational efficiency, and delivery timelines. However, many port authorities and logistics teams still rely on scattered spreadsheets and manual reports. As a result, cost overruns, delivery delays, and poor vendor performance become difficult to track.
That is exactly why a Port Purchasing Dashboard in Excel plays a critical role. This ready-to-use dashboard converts raw purchasing data into clear, visual, and actionable insights. It allows procurement teams to monitor budgeted cost, actual cost, quantities ordered and received, supplier performance, savings, and delivery delays—all in one place.
In this article, we will explain the Port Purchasing Dashboard in Excel, its structure, charts, benefits, and best practices so you can manage port procurement with confidence.
What Is a Port Purchasing Dashboard in Excel?
A Port Purchasing Dashboard in Excel is a centralized reporting tool designed to track and analyze procurement performance for port operations. It consolidates purchasing data from purchase orders, suppliers, ports, and delivery records into a single interactive dashboard.
With this dashboard, teams can:
-
Compare budgeted cost vs actual cost
-
Track ordered vs received quantities
-
Identify delivery delays
-
Measure supplier performance
-
Monitor cost savings
-
Improve procurement transparency
Because the dashboard is built in Excel, it remains easy to use, flexible, and cost-effective.
Overview Sheet Tab –
Click to Buy Port Purchasing Dashboard in Excel
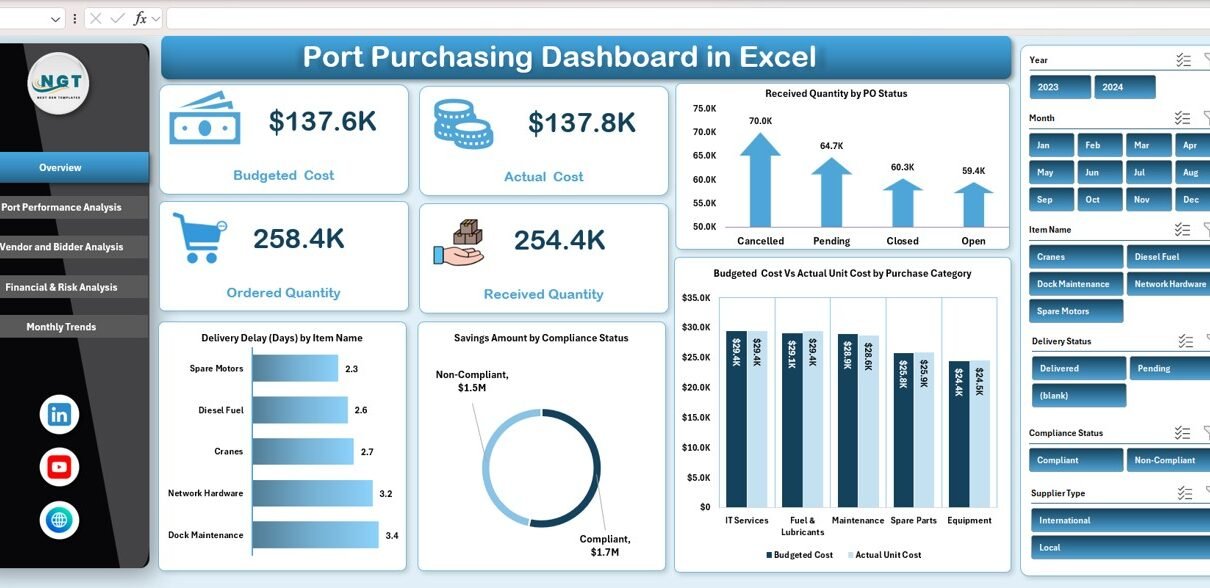
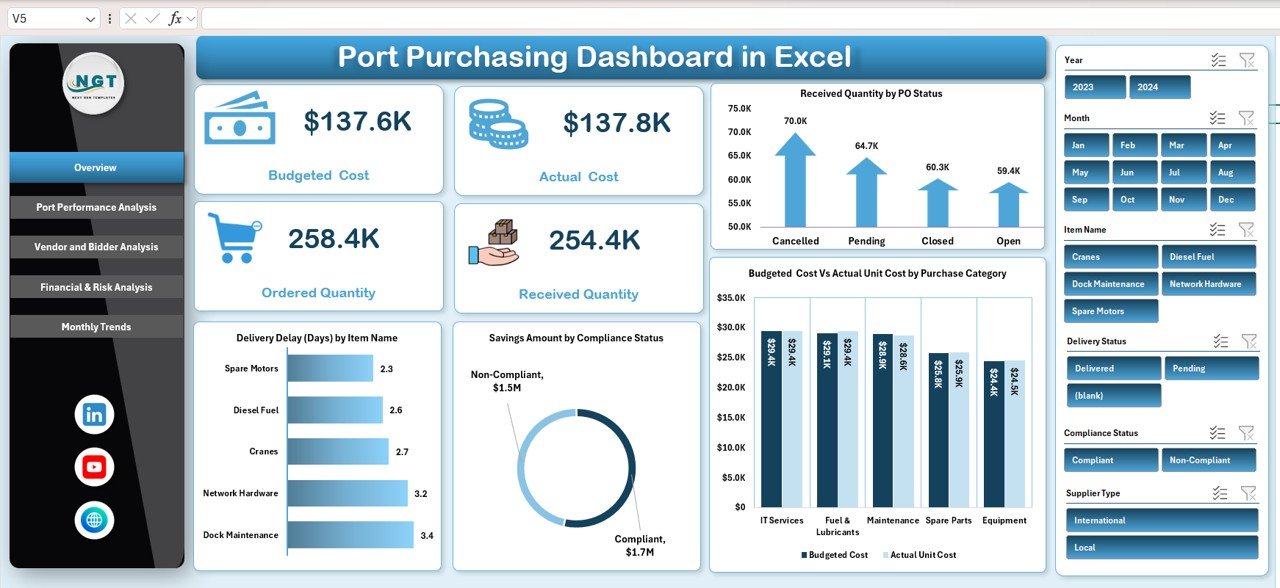
The Overview sheet provides a quick summary of procurement performance using KPI cards and charts. Decision-makers can review this page during meetings without digging into raw data.
Key KPI Cards on the Overview Sheet
These cards display the most important purchasing metrics at a glance:
-
Budgeted Cost – Planned procurement spend
-
Actual Cost – Real amount spent on purchases
-
Ordered Quantity – Total quantity ordered
-
Received Quantity – Quantity successfully delivered
These KPIs immediately highlight cost overruns, shortages, or fulfillment gaps.
Charts on the Overview Sheet
1. Received Quantity by PO Status
Shows how much quantity has been received based on purchase order status such as open, partially received, or closed.
Why it matters:
Helps track fulfillment progress and identify stalled purchase orders.
2. Budgeted Cost vs Actual Unit Cost by Purchase Category
Compares planned unit cost against actual unit cost across categories like equipment, maintenance, fuel, or services.
Why it matters:
Reveals cost overruns and helps improve future budgeting accuracy.
3. Savings Amount by Compliance Status
Displays savings achieved through compliant vs non-compliant purchases.
Why it matters:
Encourages policy compliance and highlights cost benefits of approved suppliers.
4. Delivery Delay (Days) by Item Name
Shows which items face the longest delivery delays.
Why it matters:
Helps prioritize follow-ups and reduce operational disruptions.
Click to Buy Port Purchasing Dashboard in Excel
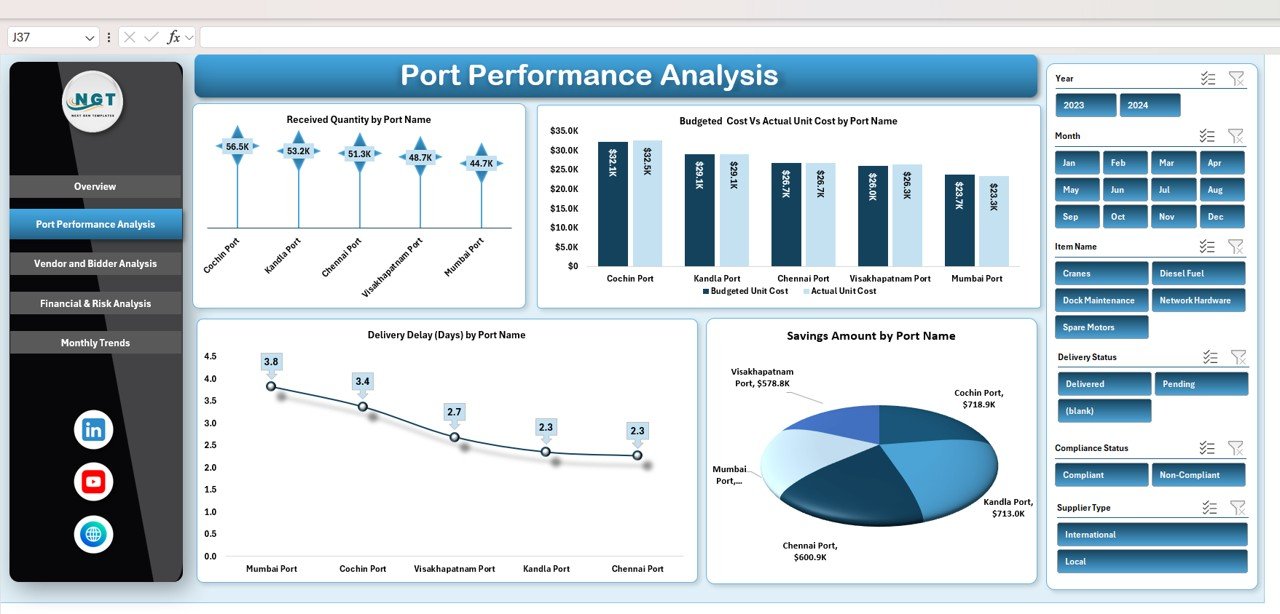
Port Performance Analysis
This section evaluates procurement performance at the port level.
Charts in Port Performance Analysis
1. Received Quantity by Port Name
Shows how efficiently each port receives ordered goods.
Insight:
Identifies ports with fulfillment bottlenecks.
2. Budgeted Cost vs Actual Unit Cost by Port Name
Highlights cost deviations across ports.
Insight:
Supports cost benchmarking between ports.
3. Delivery Delay (Days) by Port Name
Tracks average delivery delays at each port.
Insight:
Helps improve logistics coordination.
4. Savings Amount by Port Name
Shows cost savings achieved by each port.
Insight:
Recognizes ports with strong procurement discipline.
Click to Buy Port Purchasing Dashboard in Excel
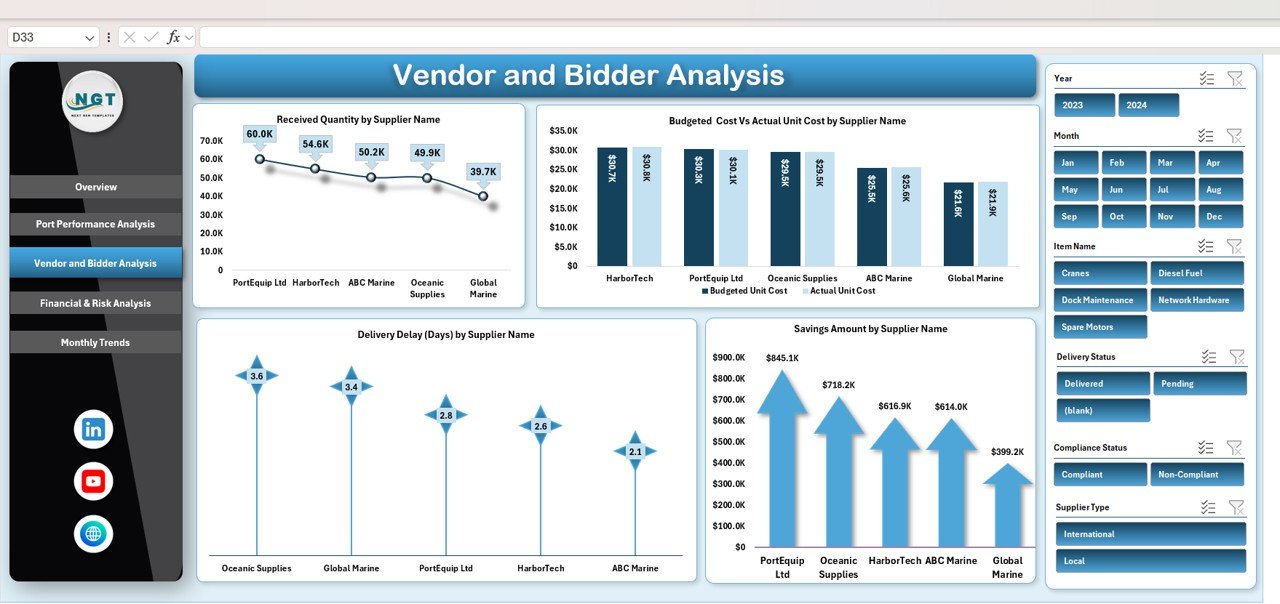
Vendor and Supplier Performance Analysis
Suppliers play a crucial role in port procurement. This section focuses on vendor efficiency, cost control, and delivery reliability.
Charts in Vendor & Supplier Analysis
1. Received Quantity by Supplier Name
Measures how well suppliers fulfill orders.
2. Budgeted Cost vs Actual Unit Cost by Supplier Name
Compares supplier pricing performance.
3. Savings Amount by Supplier Name
Highlights vendors that deliver better value.
4. Delivery Delay (Days) by Supplier Name
Identifies suppliers causing frequent delays.
Why this section matters:
It helps procurement teams renegotiate contracts, improve supplier selection, and reduce risk.
Click to Buy Port Purchasing Dashboard in Excel
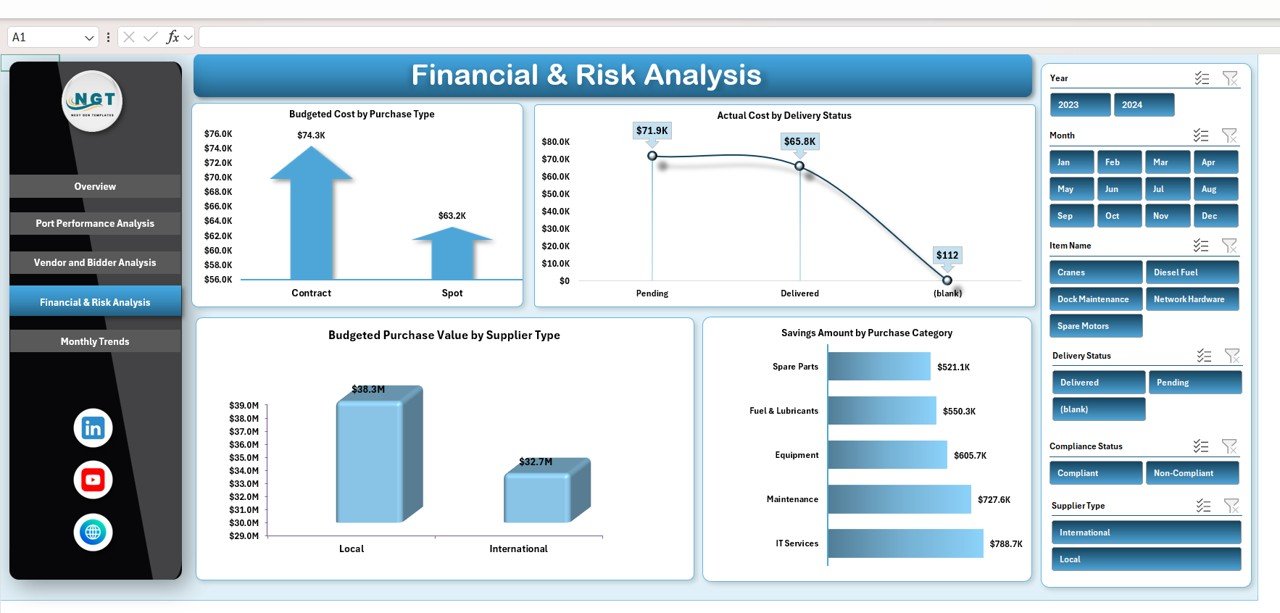
Financial & Risk Analysis
This section focuses on financial exposure and procurement risks.
Charts in Financial & Risk Analysis
1. Budgeted Cost by Purchase Type
Shows planned spend by purchase type.
2. Actual Cost by Delivery Status
Highlights cost distribution based on delivery completion.
3. Savings Amount by Purchase Category
Identifies categories with the highest cost savings.
4. Budgeted Purchase Value by Supplier Type
Compares spending across local, international, and strategic suppliers.
Why this section matters:
Supports risk management and strategic sourcing decisions.
Click to Buy Port Purchasing Dashboard in Excel
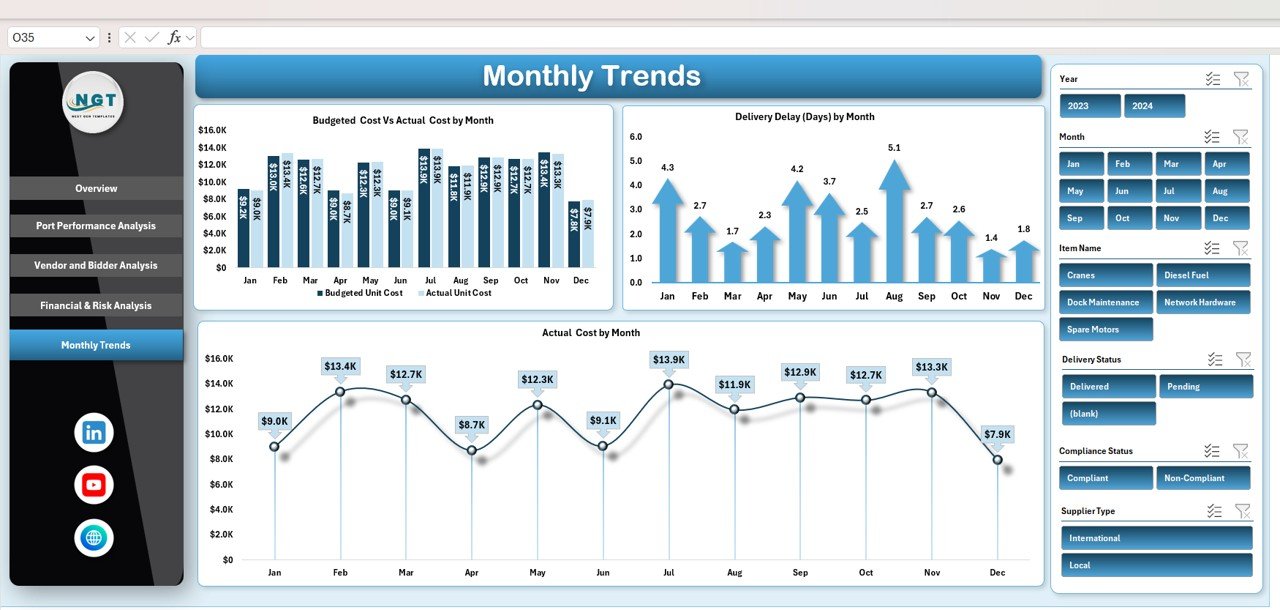
Monthly Trends Analysis
Monthly trends help teams understand how procurement performance changes over time.
Charts in Monthly Trends
1. Budgeted Cost vs Actual Cost by Month
Tracks spending accuracy over time.
2. Delivery Delay (Days) by Month
Shows seasonal or process-related delays.
3. Actual Cost by Month
Helps monitor spending patterns and detect anomalies.
Why this section matters:
Improves forecasting and budgeting for future procurement cycles.
Click to Buy Port Purchasing Dashboard in Excel
Advantages of Using a Port Purchasing Dashboard in Excel
-
Centralized procurement visibility
-
Faster decision-making
-
Improved cost control
-
Better supplier accountability
-
Reduced delivery delays
-
Easy reporting and presentations
-
No expensive software required
Opportunities for Improvement
Although the dashboard is powerful, organizations can enhance it further by:
-
Integrating ERP or PO systems
-
Adding automated alerts for delays
-
Including compliance risk scoring
-
Tracking contract-level procurement
-
Adding forecast vs actual analysis
Best Practices for Using the Dashboard
Click to Buy Port Purchasing Dashboard in Excel
-
Update purchasing data regularly
-
Standardize purchase categories
-
Review supplier performance monthly
-
Monitor delivery delays proactively
-
Use insights during vendor negotiations
-
Share dashboards with operations teams
Who Should Use This Dashboard?
-
Port authorities
-
Procurement managers
-
Finance teams
-
Supply chain analysts
-
Operations managers
-
Vendor management teams
Conclusion
Click to Buy Port Purchasing Dashboard in Excel
A Port Purchasing Dashboard in Excel transforms procurement data into meaningful insights. It helps ports control costs, monitor supplier performance, reduce delivery delays, and improve purchasing efficiency. Because the dashboard is ready to use and built in Excel, teams can deploy it quickly without technical complexity.
Watch the step-by-step video tutorial:
Visit our YouTube channel to learn step-by-step video tutorials
Click to Buy Port Purchasing Dashboard in Excel