Managing tenders in the refinery industry demands precision, transparency, and speed. Because refinery projects involve high-value contracts, strict compliance, and multiple stakeholders, even a small delay or data error can to major cost overruns. Therefore, refinery teams need a structured and reliable way to track tender performance.
That is exactly why a Refinery Tender KPI Dashboard in Excel becomes a powerful and practical solution.
In this detailed and SEO-friendly article, you will learn what a Refinery Tender KPI Dashboard in Excel is, why refineries need it, how it works, its worksheet structure, key KPIs, advantages, best practices, and frequently asked questions. By the end, you will clearly understand how this dashboard helps refinery procurement and management teams gain control, visibility, and confidence in tender decisions.
What Is a Refinery Tender KPI Dashboard in Excel?
A Refinery Tender KPI Dashboard in Excel is a structured and interactive Excel-based reporting tool designed to monitor, analyze, and track key performance indicators related to refinery tender activities.
Instead of relying on scattered spreadsheets and manual reports, this dashboard consolidates all tender KPIs into one centralized Excel file. As a result, refinery procurement teams, finance teams, and management gain real-time visibility into tender performance.
Because the dashboard runs in Microsoft Excel, it remains easy to use, flexible, and cost-effective. Moreover, teams can customize KPIs, targets, and trends without investing in complex BI tools.
Why Do Refineries Need a Tender KPI Dashboard?
Refinery tenders involve equipment procurement, maintenance contracts, construction services, logistics, and specialized technical services. Therefore, managing these tenders without structured KPIs creates risks.
Let us understand why refineries strongly need a tender KPI dashboard.
Key Challenges Without a Dashboard
- Tender data stays spread across multiple files
- Tracking monthly and yearly performance becomes difficult
- Target vs actual analysis consumes too much time
- Trend analysis remains manual and error-prone
- Management lacks a clear performance snapshot
Because of these challenges, decision-making slows down. However, when teams use a Refinery Tender KPI Dashboard in Excel, they overcome these issues quickly and effectively.
How Does a Refinery Tender KPI Dashboard in Excel Work?
The Refinery Tender KPI Dashboard in Excel works by separating data entry, definitions, and analysis into structured worksheets. Therefore, users only enter data once, and the dashboard automatically updates all KPIs and charts.
Additionally, the dashboard allows users to select a month and instantly view:
- Month-to-Date (MTD) performance
- Year-to-Date (YTD) performance
- Target vs Actual comparison
- Current Year vs Previous Year comparison
Because of this structure, refinery teams save time while improving accuracy.
What Are the Core Features of the Refinery Tender KPI Dashboard in Excel?
The dashboard includes 7 well-structured worksheets, each designed for a specific purpose. Let us explore them one by one.
Summary Page – How Does the Navigation Work?
The Summary Page acts as an index or landing page for the entire dashboard.
Key Highlights of the Summary Page
- Provides 6 navigation buttons
- Allows quick access to all major worksheets
- Improves usability and user experience
- Reduces navigation errors
Because refinery dashboards often contain multiple analytical pages, this summary page ensures smooth and fast navigation for users at all levels.
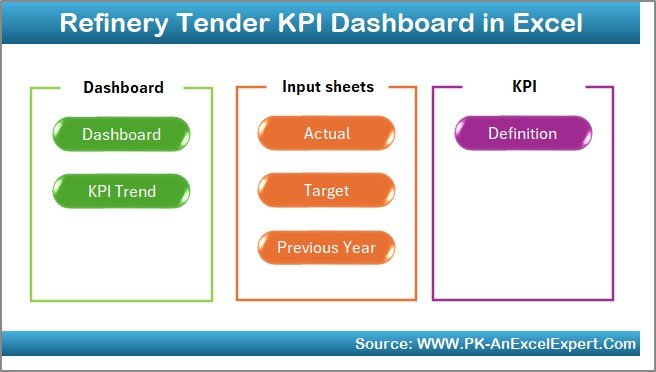
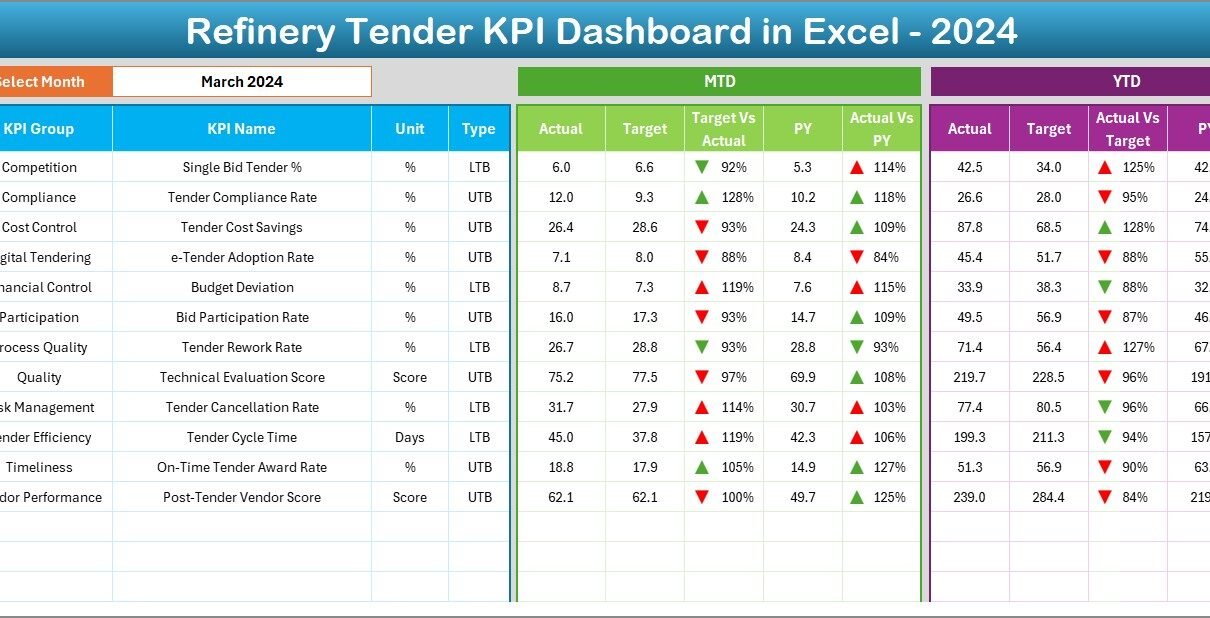
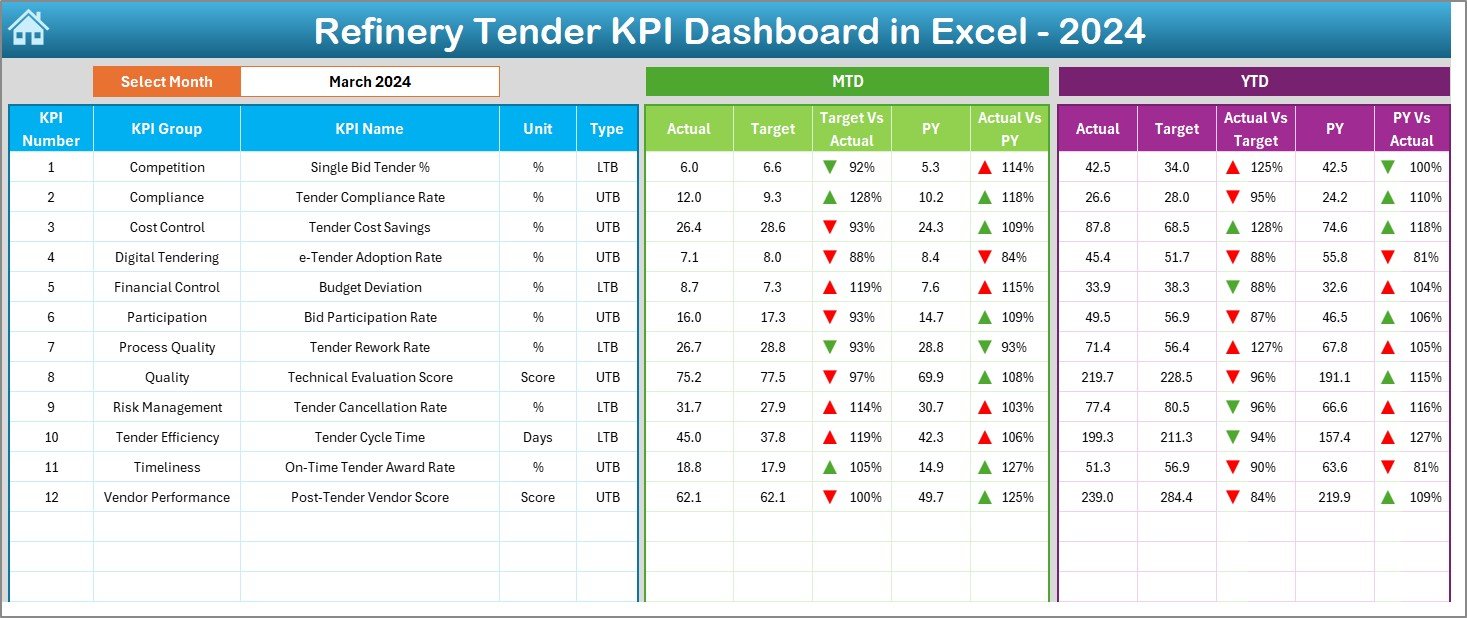
Dashboard Sheet – What KPIs Does It Show?
The Dashboard Sheet is the heart of the Refinery Tender KPI Dashboard in Excel. This sheet displays all key KPIs in a clean and visual format.
Month Selection Feature
- Month selection available in cell D3
- Changing the month automatically updates all KPIs
- Enables quick monthly performance review
KPIs Displayed on the Dashboard
The dashboard shows both MTD and YTD values for:
- Actual performance
- Target performance
- Previous Year performance
Additionally, it calculates and displays:
- Target vs Actual variance
- Previous Year vs Actual variance
Visual Enhancements
- Conditional formatting with up and down arrows
- Easy-to-read KPI cards
- Clear performance indicators
Because of these visuals, management can instantly identify performance gaps and improvement areas.
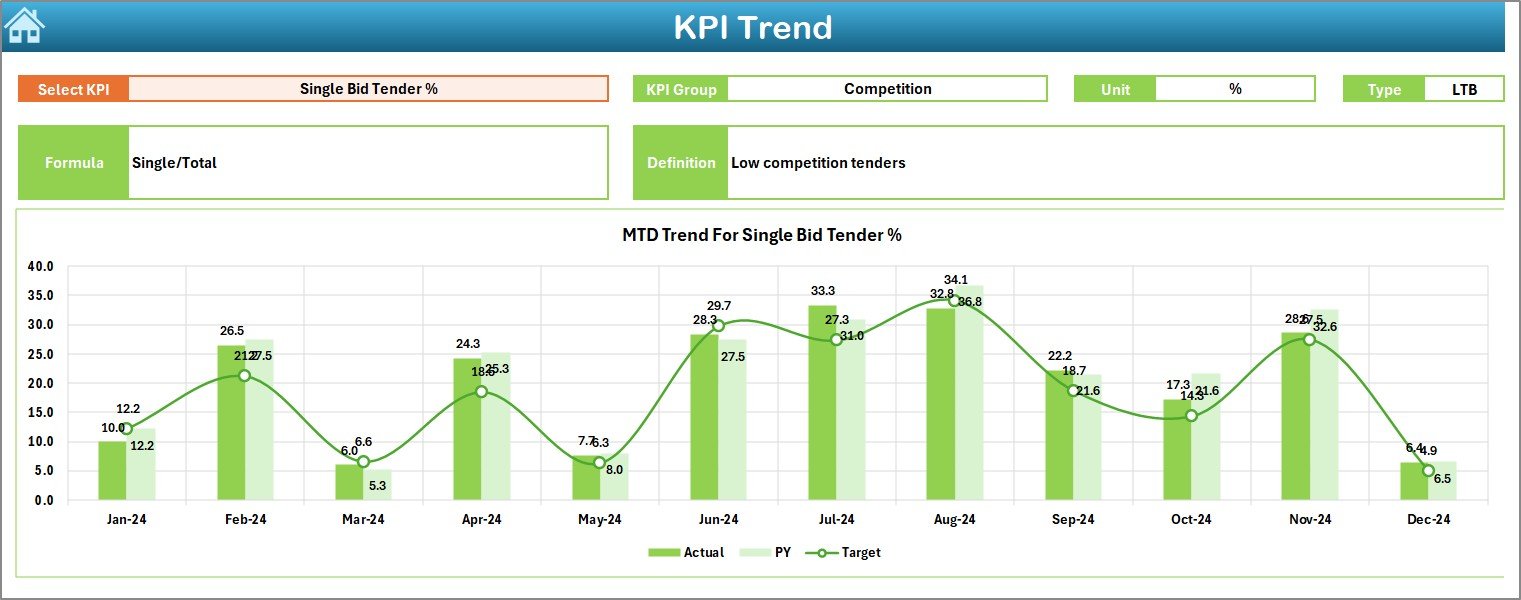
Trend Sheet – How Can You Analyze KPI Trends?
The Trend Sheet focuses on performance trends over time.
Key Features of the Trend Sheet
- KPI selection dropdown in cell C3
Displays KPI metadata:
KPI Group
Unit of KPI
Type of KPI (Lower the Better / Upper the Better)
KPI Formula
KPI Definition
Trend Analysis Charts
MTD trend chart for Actual, Target, and Previous Year
- YTD trend chart for Actual, Target, and Previous Year
Because trends reveal patterns, this sheet helps refinery teams understand whether performance improves, declines, or remains stable over time.
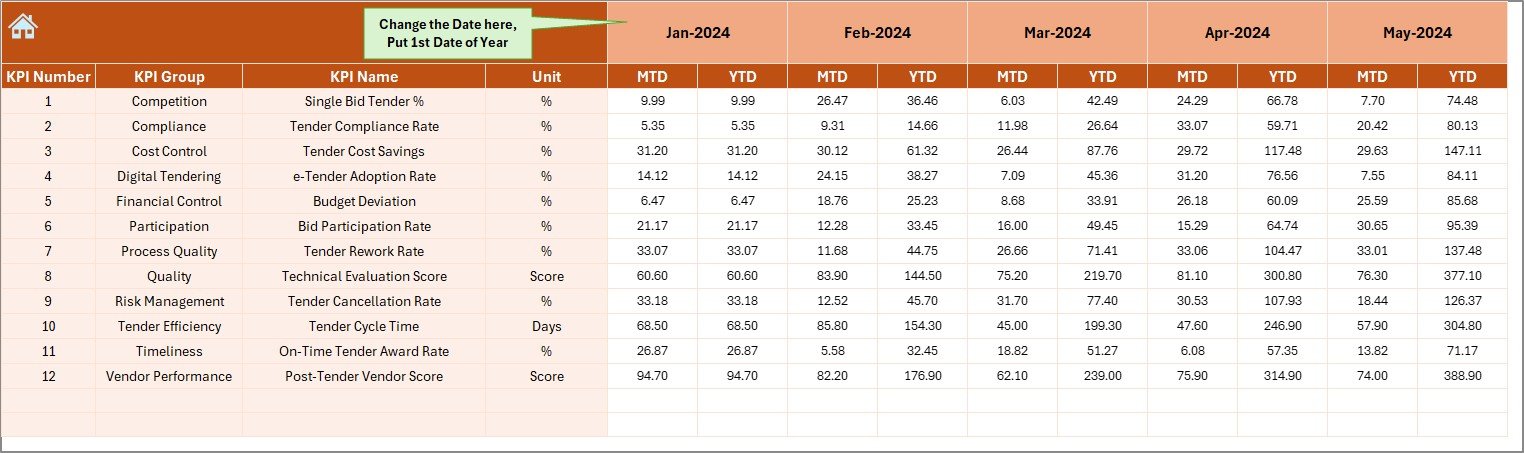
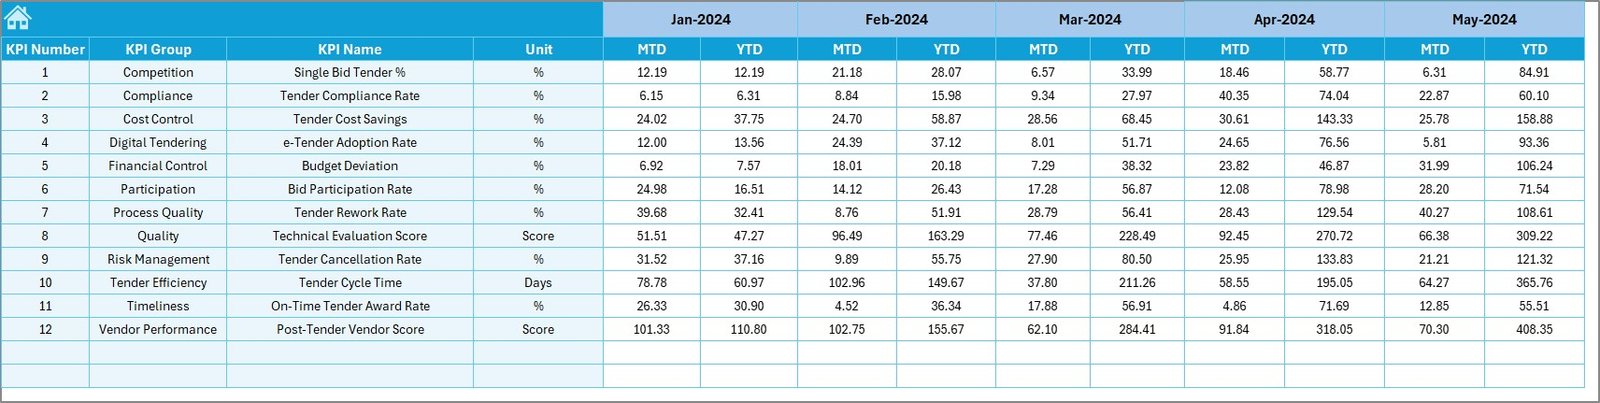
Actual Numbers Input Sheet – Where Do You Enter Data?
The Actual Numbers Input Sheet serves as the main data entry sheet for current-year performance.
How Data Entry Works
- Enter MTD and YTD actual numbers for each KPI
- Select the starting month of the year in cell E1
- Change months easily without restructuring data
Because this sheet separates data entry from analysis, it minimizes formula errors and improves data integrity.
Target Sheet – How Do You Set Performance Goals?
The Target Sheet stores all target values for refinery tender KPIs.
What You Enter in the Target Sheet
- Monthly MTD targets
- Monthly YTD targets
- KPI-wise target values
Because targets drive performance measurement, this sheet plays a critical role in variance analysis.
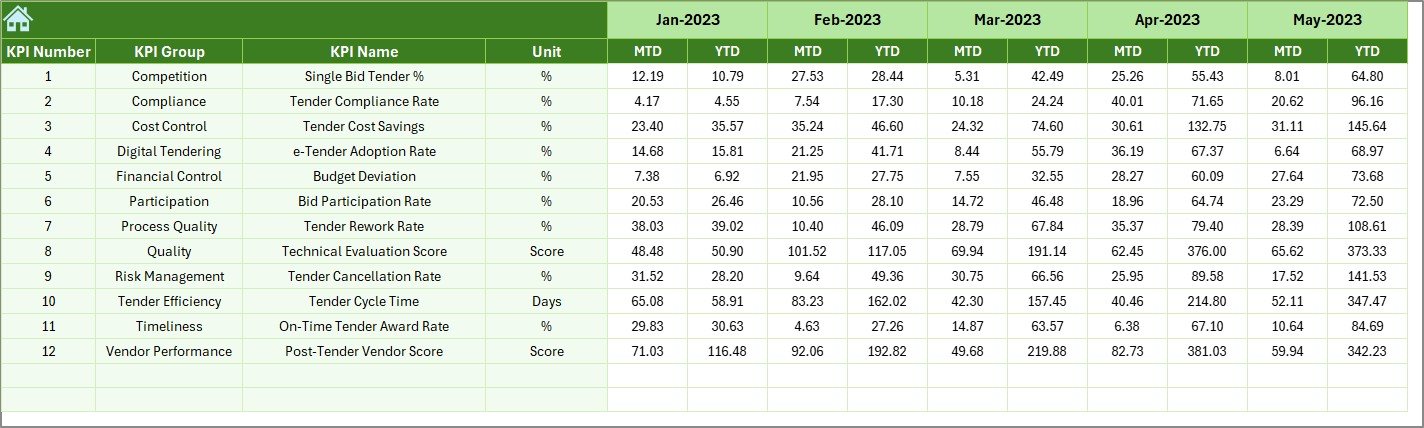
Previous Year Numbers Sheet – Why Is Historical Comparison Important?
The Previous Year Numbers Sheet captures historical KPI data.
Benefits of Previous Year Comparison
- Enables year-over-year analysis
- Highlights performance growth or decline
- Supports realistic target setting
By comparing current performance with past results, refinery teams gain valuable context for decision-making.
KPI Definition Sheet – How Does It Improve Clarity?
The KPI Definition Sheet ensures everyone understands what each KPI means.
Information Stored in This Sheet
- KPI Name
- KPI Group
- Unit of Measurement
- KPI Formula
- KPI Definition
Because this sheet standardizes KPI definitions, it eliminates confusion and ensures consistent interpretation across departments.

What KPIs Can You Track in a Refinery Tender KPI Dashboard?
A Refinery Tender KPI Dashboard in Excel supports a wide range of KPIs, such as:
- Number of tenders issued
- Number of tenders awarded
- Tender success rate
- Average tender cycle time
- Cost savings achieved
- Compliance rate
- Vendor participation rate
- Tender delays
Because the dashboard remains flexible, teams can easily add or modify KPIs based on refinery needs.
Advantages of a Refinery Tender KPI Dashboard in Excel
Using this dashboard delivers several clear benefits.
- Centralized Tender Monitoring
All tender KPIs remain in one Excel file. Therefore, teams avoid scattered reports and duplicated work.
- Faster Decision-Making
Visual KPIs and trends help management take quick and informed decisions.
- Improved Accuracy
Automated calculations reduce manual errors and inconsistencies.
- Better Accountability
Clear targets and variances highlight ownership and responsibility.
- Cost-Effective Solution
Because the dashboard uses Excel, refineries avoid expensive BI software.
How Does This Dashboard Improve Refinery Tender Performance?
This dashboard improves tender performance by:
- Highlighting delays early
- Tracking target achievement continuously
- Encouraging data-driven decisions
- Improving transparency across teams
As a result, refinery procurement teams operate more efficiently and confidently.
Best Practices for the Refinery Tender KPI Dashboard in Excel
To get maximum value from the dashboard, follow these best practices.
- Define KPIs Clearly
Always maintain clear KPI definitions in the KPI Definition sheet.
- Update Data Regularly
Enter actual numbers monthly without delay to ensure accurate reporting.
- Review Trends Monthly
Analyze MTD and YTD trends during monthly review meetings.
- Align Targets with Strategy
Set realistic targets that align with refinery procurement goals.
- Train Users Properly
Ensure all users understand how to input data and read KPIs.
Opportunities for Improvement in Refinery Tender KPI Tracking
Although the dashboard offers strong capabilities, teams can further enhance it.
Improvement Opportunities
- Add slicers for department or vendor analysis
- Include automated alerts for KPI breaches
- Integrate Power BI for advanced visualization
- Connect with ERP systems for automated data feeds
These enhancements can further strengthen tender analytics over time.
Who Can Benefit from a Refinery Tender KPI Dashboard in Excel?
This dashboard benefits:
- Refinery procurement teams
- Contract management teams
- Finance and cost control teams
- Project management offices
- Senior management and executives
Because the dashboard remains simple yet powerful, it suits both operational and strategic users.
Conclusion: Why Should You Use a Refinery Tender KPI Dashboard in Excel?
A Refinery Tender KPI Dashboard in Excel transforms complex tender data into clear, actionable insights. It helps refineries track performance, compare targets, analyze trends, and improve decision-making.
Because it combines structured data entry, clear KPI definitions, and powerful visuals, this dashboard becomes an essential tool for modern refinery tender management. When teams use it consistently, they improve transparency, efficiency, and overall tender success.
Frequently Asked Questions About the Refinery Tender KPI Dashboard in Excel
- What is the main purpose of a Refinery Tender KPI Dashboard in Excel?
The main purpose is to track, analyze, and monitor refinery tender KPIs in one centralized and visual Excel file.
- Can I customize KPIs in this dashboard?
Yes, you can easily add, remove, or modify KPIs based on refinery requirements.
- Does the dashboard support monthly and yearly analysis?
Yes, the dashboard supports both MTD and YTD analysis along with previous year comparisons.
- Do I need advanced Excel skills to use this dashboard?
No, basic Excel knowledge is enough to use and maintain the dashboard.
- Can this dashboard replace BI tools?
While it may not replace advanced BI tools, it offers a powerful and cost-effective alternative for most refinery tender analysis needs.
Visit our YouTube channel to learn step-by-step video tutorials
Watch the step-by-step video tutorial: