Managing procurement in a clinic is never simple. Clinics must balance cost control, supplier performance, compliance, and uninterrupted medical supply availability. At the same time, procurement teams must report performance clearly to management. However, when clinics rely on scattered Excel files, manual reports, or disconnected data sources, visibility drops and risks increase.
That is exactly why a Clinic Procurement KPI Dashboard in Excel becomes a powerful and practical solution. This dashboard helps clinics track procurement performance using structured KPIs, clear visuals, and automated calculations—without complex software or high implementation costs.
In this detailed guide, you will learn what a Clinic Procurement KPI Dashboard in Excel is, why clinics need it, how it works, its worksheet structure, key KPIs, advantages, best practices, and frequently asked questions. By the end of this article, you will clearly understand how this dashboard strengthens procurement control and decision-making in clinic operations.
What Is a Clinic Procurement KPI Dashboard in Excel?
A Clinic Procurement KPI Dashboard in Excel is a centralized performance monitoring tool designed to track, analyze, and visualize procurement-related KPIs for clinics and healthcare facilities.
Instead of managing procurement data across multiple spreadsheets and reports, this dashboard consolidates all KPI information into one structured Excel template. As a result, procurement teams gain instant visibility into monthly, year-to-date, and year-over-year performance.
Moreover, this dashboard uses Excel formulas, dropdowns, conditional formatting, and charts to deliver insights without manual calculations. Therefore, clinics can monitor procurement efficiency, cost control, and supplier performance with confidence.
Why Do Clinics Need a Procurement KPI Dashboard?
Clinic procurement involves medical supplies, pharmaceuticals, consumables, equipment, and service contracts. Every delay or error directly impacts patient care. Therefore, clinics must track procurement performance accurately and consistently.
Here is why a procurement KPI dashboard is essential for clinics:
- Clinics must control costs while maintaining quality
- Clinics need visibility into supplier performance
- Clinics must avoid stockouts and overstocking
- Clinics must track targets versus actual performance
- Clinics must support audits and compliance reporting
Because of these needs, a structured Excel-based KPI dashboard provides clarity, control, and accountability.
How Does a Clinic Procurement KPI Dashboard in Excel Work?
The Clinic Procurement KPI Dashboard in Excel works by separating data input, KPI logic, and visual reporting into structured worksheets. As a result, users can enter data easily while Excel automatically calculates and displays results.
Here is how the process works step by step:
- Enter KPI definitions and targets
- Input actual procurement numbers monthly
- Add previous year data for comparison
- Select the reporting month from a dropdown
- Review automated KPI results, trends, and indicators
Because Excel handles calculations and formatting, users focus only on data and insights.
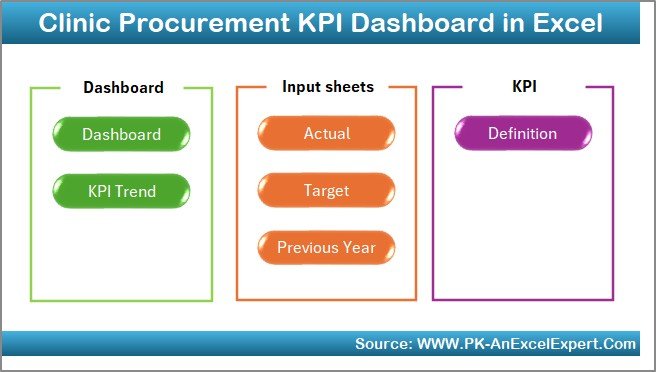
Worksheet Structure of the Clinic Procurement KPI Dashboard in Excel
This dashboard contains 7 structured worksheets, each serving a specific purpose. Together, they create a complete procurement performance monitoring system.
What Is the Summary Page and Why Is It Important?
Summary Page (Index Sheet)
The Summary Page acts as the navigation hub of the dashboard. It improves usability and saves time.
Key Features of the Summary Page:
- Serves as an index sheet
- Contains 6 navigation buttons
- Allows users to jump directly to relevant sheets
- Enhances user experience and dashboard flow
Because procurement dashboards often grow complex, this index-style page ensures smooth navigation for all users.
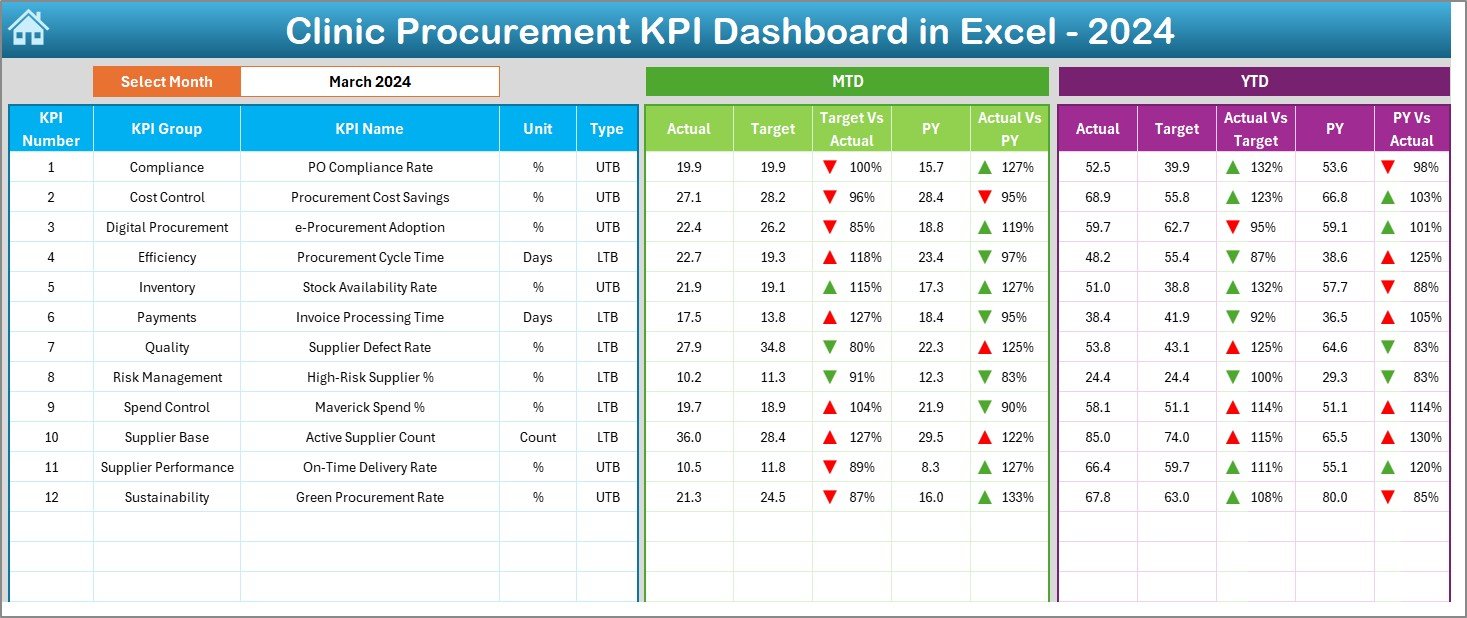
What Information Is Shown on the Dashboard Sheet?
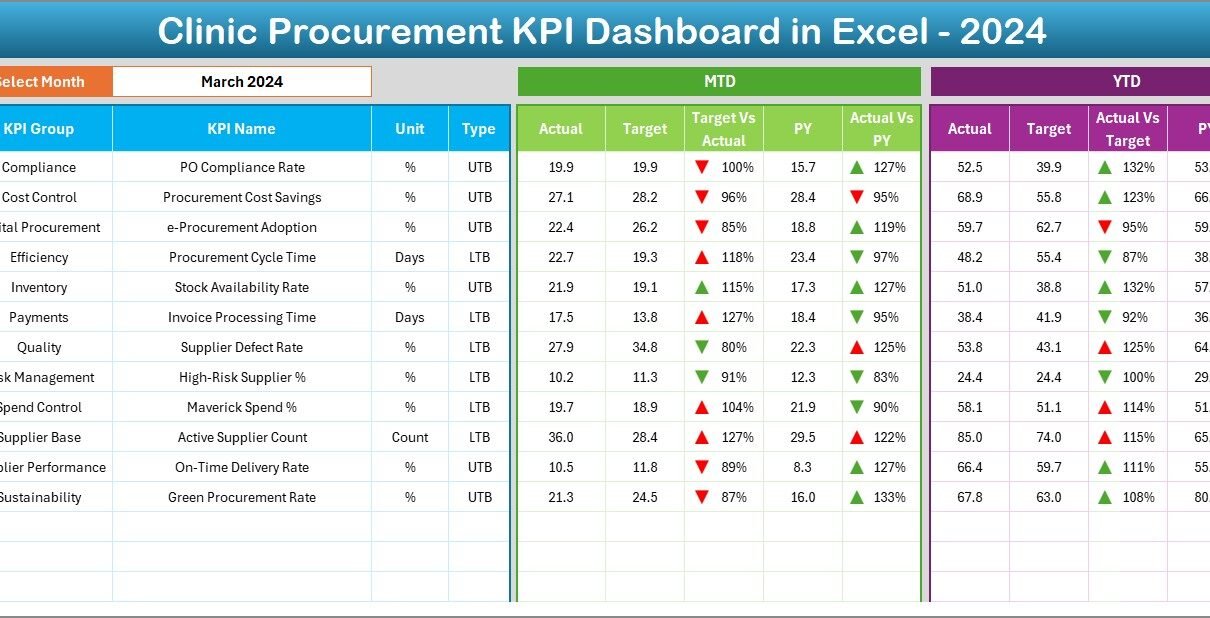
Dashboard Sheet (Main Dashboard)
The Dashboard Sheet is the heart of the Clinic Procurement KPI Dashboard in Excel. It displays all KPIs in a single, interactive view.
Key Highlights of the Dashboard Sheet:
- Month selection dropdown at cell D3
- Dynamic update of all KPIs based on selected month
- Clear presentation of MTD and YTD metrics
- Visual indicators using conditional formatting arrows
KPIs Displayed on the Dashboard:
- MTD Actual
- MTD Target
- MTD Previous Year
- Target vs Actual (MTD)
- Previous Year vs Actual (MTD)
- YTD Actual
- YTD Target
- YTD Previous Year
- Target vs Actual (YTD)
- Previous Year vs Actual (YTD)
Because the dashboard updates instantly, users can analyze performance in seconds.
How Does Conditional Formatting Improve KPI Analysis?
The dashboard uses up and down arrows through conditional formatting. These indicators make insights visible at a glance.
- Up arrow shows positive performance
- Down arrow highlights underperformance
- Color-coded signals improve decision speed
As a result, clinic managers quickly identify problem areas without reading long reports.
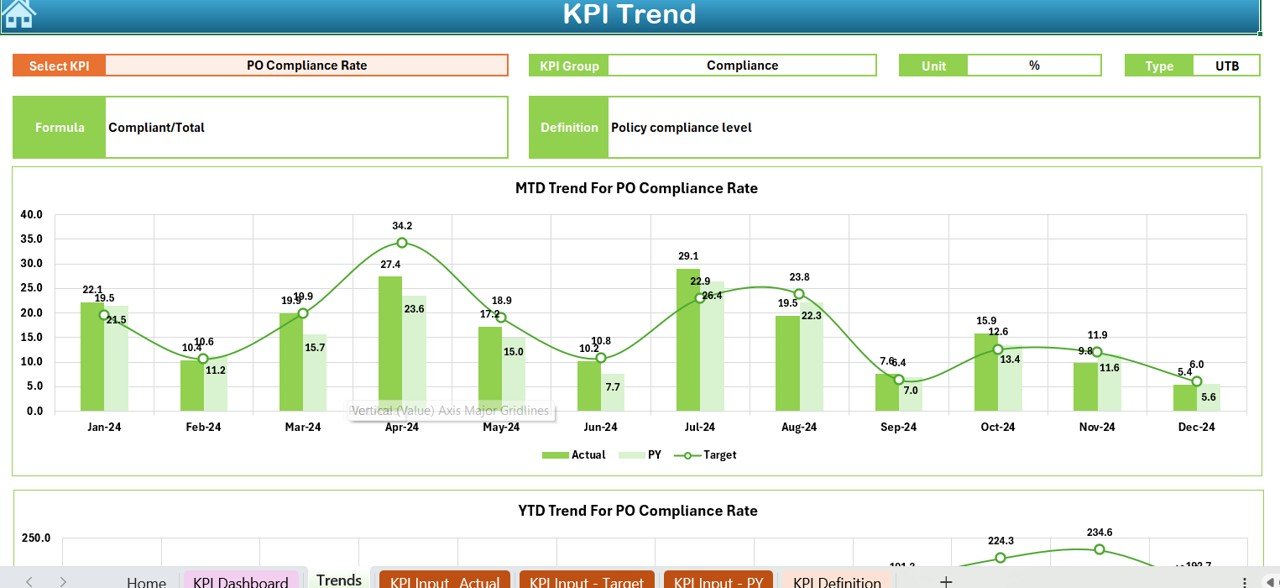
How Does the Trend Sheet Help in KPI Analysis?
Trend Sheet
The Trend Sheet focuses on deep KPI analysis. It allows users to study individual KPIs over time.
Features of the Trend Sheet:
- KPI selection dropdown at cell C3
Automatic display of KPI details:
KPI Group
KPI Unit
KPI Type (LTB or UTB)
KPI Formula
KPI Definition
Visual MTD and YTD trend charts
- Comparison of Actual, Target, and Previous Year values
Because trends reveal patterns, this sheet helps clinics identify long-term procurement issues and improvements.
What Is the Role of KPI Type (LTB and UTB)?
Each KPI includes a Type:
- Lower the Better (LTB): Cost variance, procurement cycle time
- Upper the Better (UTB): Supplier on-time delivery, contract compliance
By defining KPI type, the dashboard correctly evaluates performance direction and indicators.
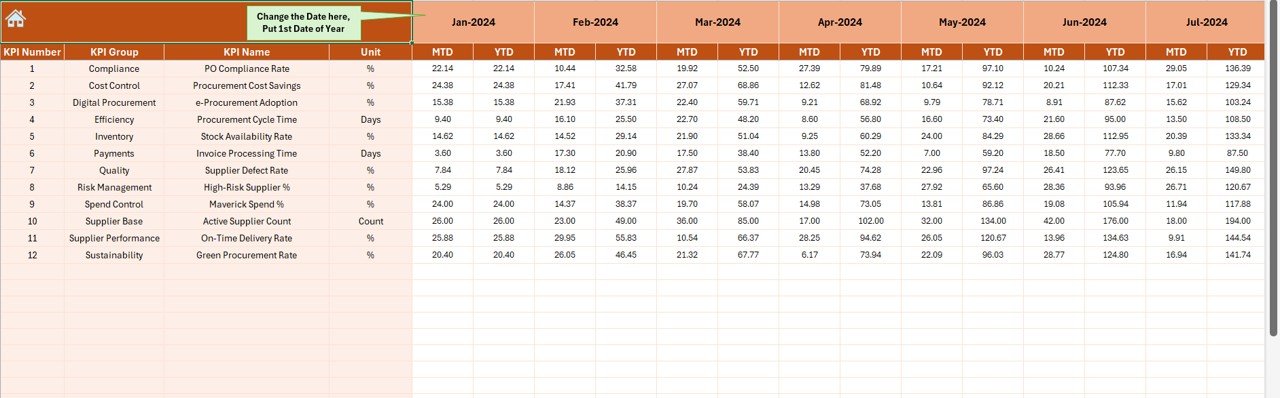
How Do You Enter Actual Procurement Data?
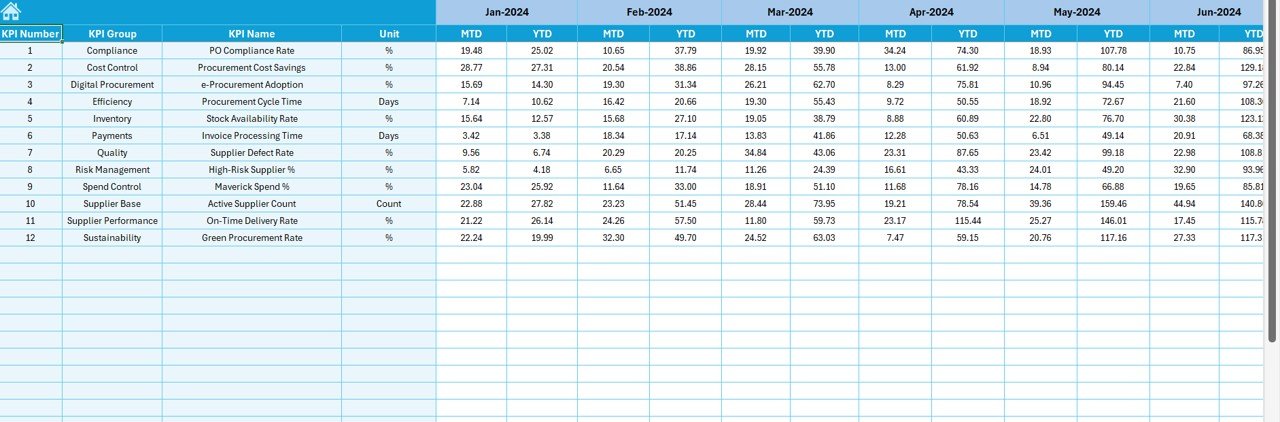
Actual Numbers Input Sheet
The Actual Numbers Input Sheet is where users enter real procurement data.
Key Details:
- Month selection cell at E1
- Input MTD and YTD actual values
- Supports full-year data entry
- Automatically feeds dashboard calculations
Because the dashboard links directly to this sheet, users should maintain accurate and timely data entry.
How Are Targets Managed in the Dashboard?
Target Sheet
The Target Sheet stores planned procurement targets.
What You Enter in the Target Sheet:
- Monthly MTD targets
- Monthly YTD targets
- KPI-wise target values
Targets act as benchmarks. Therefore, the dashboard continuously compares actual performance against these goals.
Why Is Previous Year Data Important?
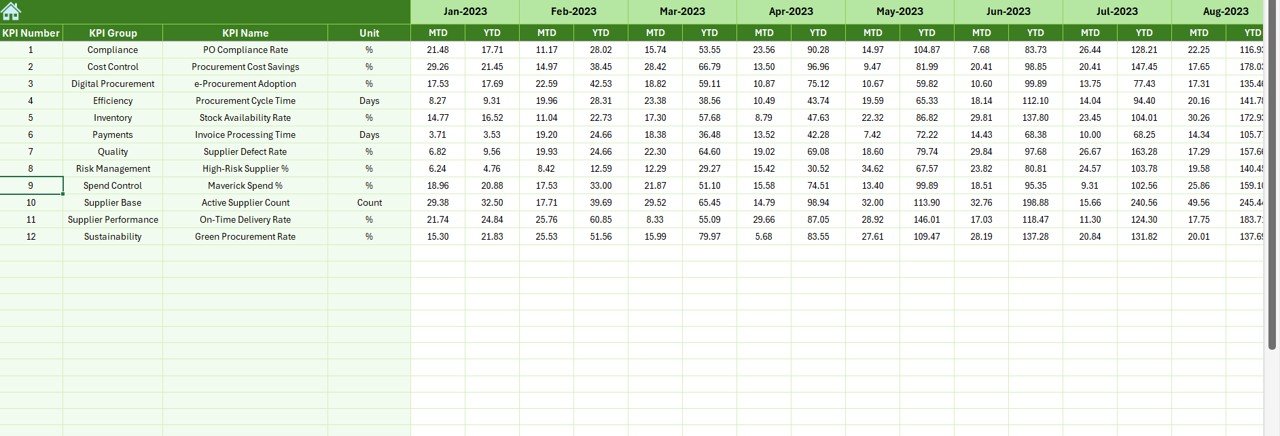
Previous Year Number Sheet
The Previous Year Sheet enables historical comparison.
Purpose of This Sheet:
- Enter previous year MTD values
- Enter previous year YTD values
- Enable year-over-year analysis
Because procurement performance changes over time, comparing with previous years highlights improvement or decline.
What Is the KPI Definition Sheet Used For?
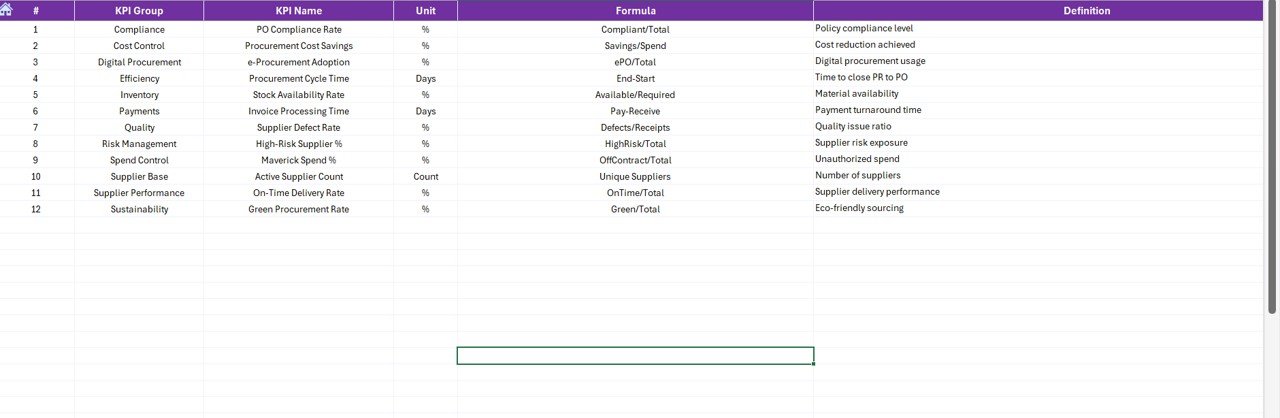
KPI Definition Sheet
The KPI Definition Sheet provides clarity and standardization.
Fields Included:
- KPI Name
- KPI Group
- KPI Unit
- KPI Formula
- KPI Definition
Because different users view the dashboard, this sheet ensures everyone interprets KPIs consistently.
What Are Common Clinic Procurement KPIs?
Although KPIs vary by clinic, the dashboard supports many common procurement KPIs, such as:
- Procurement Cost Variance
- Supplier On-Time Delivery %
- Purchase Order Cycle Time
- Contract Compliance Rate
- Emergency Purchase Ratio
- Stock Availability %
- Vendor Defect Rate
- Procurement Savings %
Because the dashboard is flexible, clinics can customize KPIs as needed.
Advantages of Clinic Procurement KPI Dashboard in Excel
Using a Clinic Procurement KPI Dashboard in Excel delivers several operational and strategic benefits.
Key Advantages:
- Centralized procurement performance tracking
- Real-time KPI visibility
- Faster decision-making
- Reduced manual reporting effort
- Improved supplier accountability
- Better cost control
- Easy customization
- No need for advanced software
Moreover, Excel-based dashboards remain accessible to most clinic teams.
How Does This Dashboard Improve Cost Control?
The dashboard highlights cost deviations instantly. As a result:
- Clinics identify overspending early
- Teams take corrective actions quickly
- Budget discipline improves consistently
How Does the Dashboard Support Management Reporting?
Because the dashboard uses visuals and summaries:
- Management reviews KPIs faster
- Meetings focus on actions, not data collection
- Reporting accuracy improves
Best Practices for the Clinic Procurement KPI Dashboard in Excel
To maximize value, clinics should follow proven best practices.
Best Practices:
- Define KPIs clearly before implementation
- Update actual data monthly without delay
- Validate targets at the start of the year
- Review trends regularly, not just dashboard totals
- Train users on KPI definitions
- Lock formula cells to avoid errors
- Keep backup copies of the dashboard
- Review KPI relevance annually
By following these practices, clinics maintain accuracy and reliability.
How Can Clinics Customize This Dashboard?
Clinics can customize the dashboard easily:
- Add new KPIs in the KPI Definition Sheet
- Modify target values in the Target Sheet
- Adjust formulas based on clinic policies
- Add charts or slicers if required
Because Excel remains flexible, customization does not require advanced technical skills.
Is Excel Suitable for Clinic Procurement Dashboards?
Yes, Excel suits many clinics, especially small and mid-sized facilities. It offers:
- Low cost
- High flexibility
- Easy adoption
- Offline availability
However, clinics with very large datasets may later consider BI tools.
Conclusion: Why Every Clinic Should Use a Procurement KPI Dashboard in Excel
A Clinic Procurement KPI Dashboard in Excel transforms procurement management from reactive reporting to proactive decision-making. It centralizes KPIs, automates calculations, and delivers clear insights.
Because clinics operate in high-pressure environments, this dashboard provides clarity, control, and confidence. Moreover, its structured worksheets, trend analysis, and conditional formatting make procurement performance visible at all times.
When clinics adopt this dashboard and follow best practices, they improve cost control, supplier performance, and operational efficiency—while protecting patient care quality.
Frequently Asked Questions (FAQs)
What is a Clinic Procurement KPI Dashboard in Excel?
It is an Excel-based tool that tracks procurement KPIs using structured data, formulas, charts, and visuals.
Can small clinics use this dashboard?
Yes, small clinics benefit greatly because Excel remains affordable and easy to use.
How often should data be updated?
Clinics should update actual data monthly to maintain accuracy.
Can I add new KPIs later?
Yes, the dashboard supports easy KPI additions through the KPI Definition Sheet.
Does the dashboard support year-over-year comparison?
Yes, it compares current year performance with previous year data automatically.
Is technical expertise required to use the dashboard?
No, basic Excel knowledge is sufficient for most users.
Can this dashboard support audits?
Yes, it improves transparency and documentation for audit purposes.
Visit our YouTube channel to learn step-by-step video tutorials
Watch the step-by-step video tutorial: