Smart cities depend on transparency, efficiency, and data-driven decision-making. Every procurement decision directly impacts public spending, service delivery, and citizen trust. Therefore, city administrations must track procurement performance clearly and consistently. However, when procurement data remains scattered across multiple Excel files, emails, and manual reports, visibility drops and risks increase.
That is exactly why a Smart Cities Procurement Dashboard in Excel becomes a powerful and practical solution. This ready-to-use Excel dashboard transforms raw procurement data into meaningful insights, interactive visuals, and performance indicators that help city leaders take confident decisions.
In this detailed and SEO-optimized guide, you will learn what a Smart Cities Procurement Dashboard in Excel is, why it matters, how it works, its page structure, key metrics, advantages, best practices, and frequently asked questions. By the end of this article, you will clearly understand how this dashboard strengthens procurement governance in smart city environments.
Click to Purchases Smart Cities Procurement Dashboard in Excel
What Is a Smart Cities Procurement Dashboard in Excel?
A Smart Cities Procurement Dashboard in Excel is a centralized analytical tool designed to monitor, analyze, and visualize procurement activities across city departments, categories, and requester teams.
Instead of managing procurement data through disconnected spreadsheets, this dashboard consolidates all critical information into one structured Excel file. As a result, city administrators can track budgets, compliance, lead times, and order status in real time.
Moreover, because the dashboard runs entirely in Excel, it remains cost-effective, flexible, and easy to customize without requiring advanced technical skills.
Why Do Smart Cities Need a Procurement Dashboard?
Smart city projects involve multiple stakeholders, departments, and suppliers. Therefore, procurement complexity increases every year. At the same time, governments face pressure to improve transparency and accountability.
A Smart Cities Procurement Dashboard in Excel helps city administrations because it:
-
Improves visibility across all procurement activities
-
Supports budget control and compliance monitoring
-
Reduces delays and procurement risks
-
Strengthens decision-making with real-time insights
Consequently, cities can manage public funds more responsibly while improving service delivery.
How Does the Smart Cities Procurement Dashboard in Excel Work?
The dashboard works by connecting structured procurement data with interactive Excel visuals. Once users update the data sheet, all charts, cards, and indicators refresh automatically.
Additionally, slicers allow users to filter data by department, category, requester team, or month. As a result, decision-makers can analyze procurement performance from multiple perspectives without manual effort.
What Is the Page Structure of the Smart Cities Procurement Dashboard in Excel?
The dashboard includes five analytical pages, each designed for a specific procurement view. A Page Navigator, located on the left side, enables quick navigation across all pages.
Overview Page: How Can City Leaders Track Procurement at a Glance?
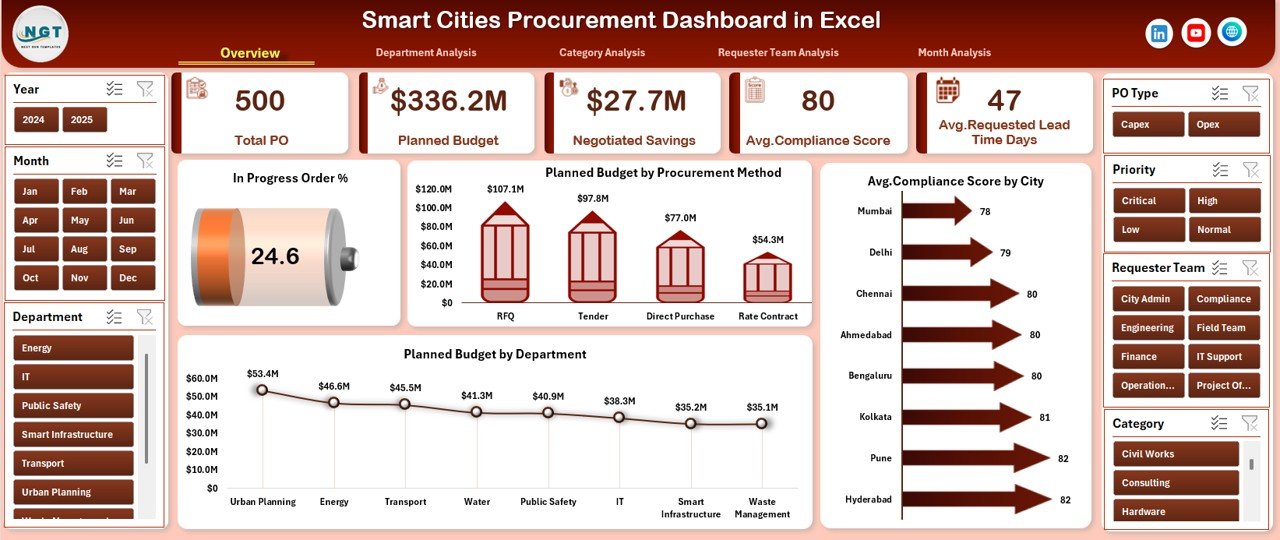
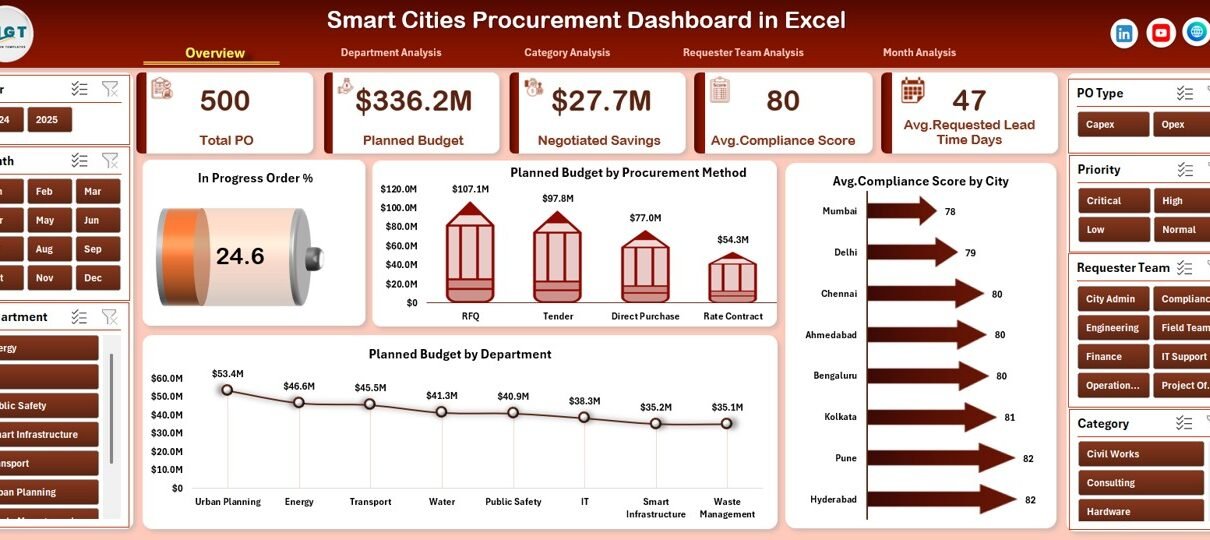
The Overview Page serves as the main control center of the dashboard. It provides a high-level summary of procurement performance across the entire city.
Key Elements of the Overview Page
-
Right-Side Slicer for dynamic filtering
-
Four KPI Cards showing headline metrics
-
Four Interactive Charts for performance analysis
Charts Included on the Overview Page
-
📊 In Progress Order %
-
💰 Planned Budget by Procurement Method
-
🏙️ Average Compliance Score by City
-
🏢 Planned Budget by Department
Because of this structure, city leaders can quickly identify budget trends, compliance levels, and procurement bottlenecks.
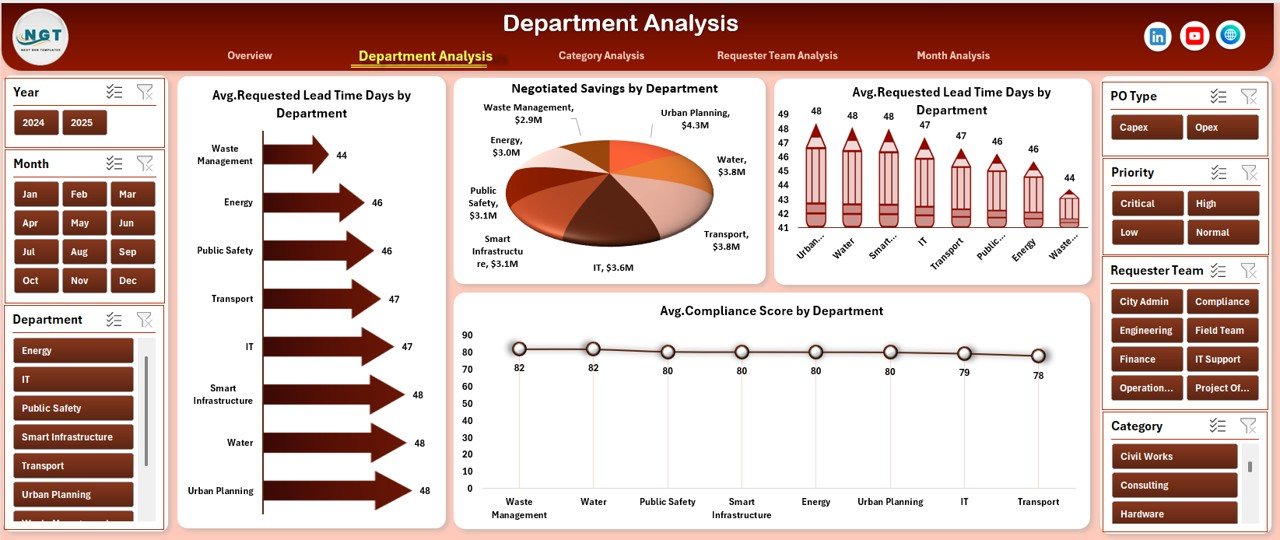
Department Analysis Page: How Can Cities Compare Department Performance?
The Department Analysis Page focuses on procurement efficiency and compliance at the departmental level.
Key Features of the Department Analysis Page
-
Right-side slicer for filtering
-
Department-level performance visuals
-
Comparative analysis across departments
Charts Included on This Page
-
⏱️ Average Requested Lead Time (Days) by Department
-
💸 Negotiated Savings by Department
-
📅 Average Promised Lead Time (Days) by Department
-
✅ Average Compliance Score by Department
As a result, procurement managers can identify which departments perform efficiently and which require improvement.
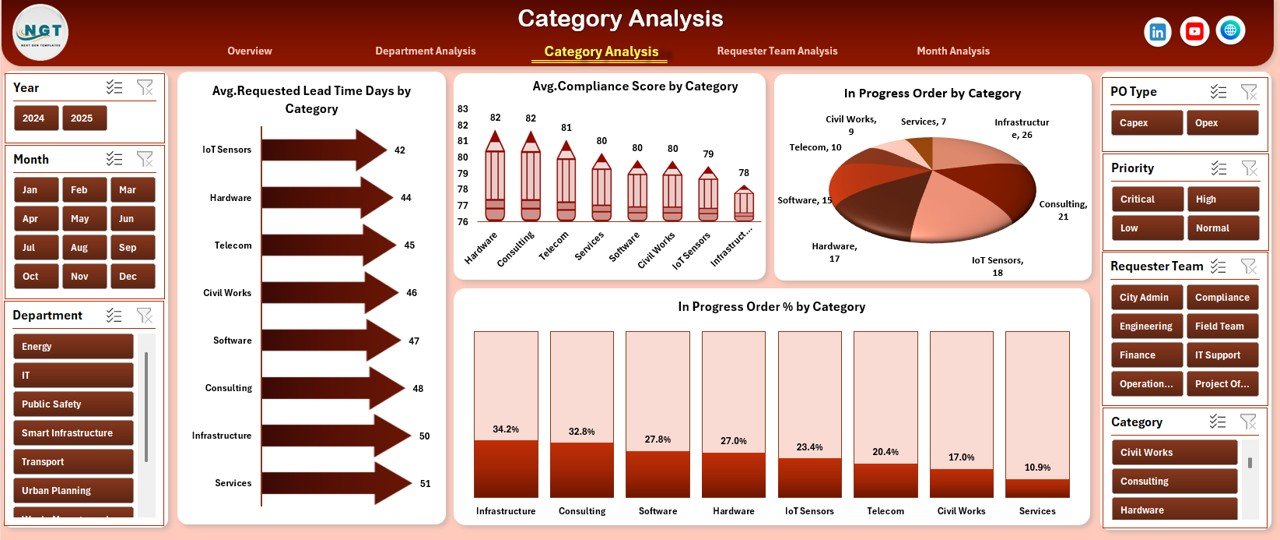
Category Analysis Page: How Can Cities Monitor Procurement Categories?
The Category Analysis Page enables cities to evaluate procurement performance by category, such as IT, infrastructure, utilities, or services.
Key Benefits of Category Analysis
-
Improves category-level planning
-
Highlights risk-prone procurement categories
-
Supports strategic sourcing decisions
Charts Included on the Category Analysis Page
-
⏳ Average Requested Lead Time (Days) by Category
-
✔️ Average Compliance Score by Category
-
🔄 In Progress Orders by Category
-
📈 In Progress Order % by Category
Because of these visuals, procurement teams can easily identify categories that cause delays or compliance issues.
Click to Purchases Smart Cities Procurement Dashboard in Excel
Requester Team Analysis Page: How Do Requester Teams Impact Procurement?
Requester teams play a major role in procurement efficiency. Therefore, this page evaluates how different teams perform.
Key Insights from the Requester Team Analysis Page
-
Budget allocation by requester team
-
Negotiation effectiveness
-
Compliance performance
Charts Included on This Page
-
💼 Planned Budget by Requester Team
-
💲 Negotiated Savings by Requester Team
-
📊 Average Compliance Score by Requester Team
-
✅ Completed Order % by Requester Team
As a result, city administrators can improve accountability and training for requester teams.
Month Analysis Page: How Can Cities Track Procurement Trends Over Time?
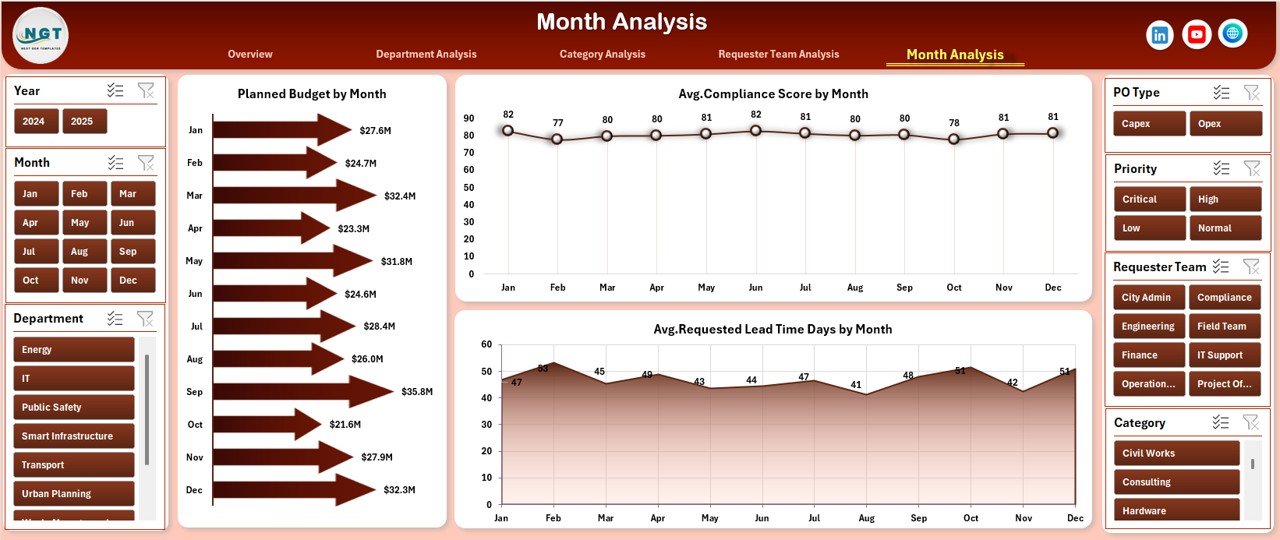
The Month Analysis Page focuses on procurement trends across months.
Why Monthly Analysis Matters
-
Identifies seasonal procurement patterns
-
Helps forecast future budgets
-
Improves planning accuracy
Charts Included on the Month Analysis Page
-
📅 Planned Budget by Month
-
✔️ Average Compliance Score by Month
-
⏱️ Average Requested Lead Time (Days) by Month
Therefore, decision-makers can track improvements or declines over time.
What Are the Supporting Sheets in the Dashboard?
The dashboard also includes supporting sheets that ensure smooth data handling.
Data Sheet
-
Central repository for all procurement records
-
Structured columns for accurate analysis
-
Easy data entry and updates
Support Sheet
-
Calculation logic
-
Lookup tables
-
Helper formulas
These sheets ensure data accuracy and automation.
What KPIs Does the Smart Cities Procurement Dashboard Track?
The dashboard tracks several critical procurement KPIs, including:
-
In Progress Order %
-
Planned Budget
-
Negotiated Savings
-
Average Compliance Score
-
Requested Lead Time
-
Promised Lead Time
-
Completed Order %
Together, these KPIs provide a complete view of procurement health.
Click to Purchases Smart Cities Procurement Dashboard in Excel
Advantages of Smart Cities Procurement Dashboard in Excel
The Smart Cities Procurement Dashboard in Excel offers multiple advantages for city administrations.
Key Advantages
-
✅ Centralized procurement visibility
-
📊 Real-time performance monitoring
-
💰 Improved budget control
-
🔍 Enhanced transparency and compliance
-
⚙️ No expensive software required
-
🧩 Easy customization in Excel
Because of these advantages, cities can manage procurement efficiently without complexity.
How Does This Dashboard Improve Procurement Governance?
Strong governance requires accurate data and timely insights. This dashboard improves governance by:
-
Standardizing procurement reporting
-
Reducing manual errors
-
Enabling data-driven audits
-
Supporting policy compliance
As a result, cities can demonstrate accountability and transparency.
Best Practices for the Smart Cities Procurement Dashboard in Excel
To get maximum value from the dashboard, cities should follow best practices.
Best Practices
-
🔄 Update procurement data regularly
-
📌 Standardize data entry formats
-
👥 Train procurement teams on dashboard usage
-
📈 Review KPIs monthly
-
🧹 Clean and validate data periodically
-
🎯 Align KPIs with city procurement policies
By following these practices, cities can maintain accurate and actionable insights.
Who Can Use a Smart Cities Procurement Dashboard in Excel?
This dashboard suits multiple stakeholders, including:
-
City procurement managers
-
Smart city project teams
-
Finance and audit departments
-
Policy makers
-
Urban planners
Therefore, it supports both operational and strategic decision-making.
How Is Excel an Ideal Platform for Smart City Procurement Dashboards?
Excel remains popular because it offers flexibility, familiarity, and affordability. Moreover, Excel supports:
-
Interactive charts and slicers
-
Automated calculations
-
Easy sharing and collaboration
-
Custom reporting
As a result, cities can deploy dashboards quickly without technical barriers.
How to Implement the Smart Cities Procurement Dashboard Successfully?
Successful implementation requires planning and discipline.
Implementation Steps
-
Prepare clean procurement data
-
Map data fields to dashboard structure
-
Validate calculations and KPIs
-
Train users and stakeholders
-
Review performance regularly
Following these steps ensures long-term success.
Conclusion: Why Smart Cities Should Use a Procurement Dashboard in Excel
Click to Purchases Smart Cities Procurement Dashboard in Excel
Smart cities need clarity, control, and accountability in procurement. A Smart Cities Procurement Dashboard in Excel delivers all three in a single, practical solution.
By consolidating procurement data, automating analysis, and presenting insights visually, this dashboard empowers city administrations to make informed decisions, reduce risks, and improve public service delivery.
Therefore, adopting this dashboard is not just a reporting improvement—it is a governance upgrade.Frequently Asked Questions (FAQs)
What is a Smart Cities Procurement Dashboard in Excel?
It is a centralized Excel tool that tracks, analyzes, and visualizes procurement KPIs for smart city projects.
Is this dashboard suitable for large cities?
Yes, it scales easily with structured data and supports multi-department analysis.
Does the dashboard require advanced Excel skills?
No, it uses standard Excel features like charts and slicers.
Can cities customize KPIs?
Yes, users can modify KPIs and visuals based on procurement policies.
How often should cities update the dashboard?
Cities should update it weekly or monthly for accurate insights.
Does this dashboard support transparency initiatives?
Yes, it improves visibility, compliance tracking, and reporting accuracy.
Visit our YouTube channel to learn step-by-step video tutorials