Documentary filmmaking demands creativity, discipline, and strong decision-making. However, many documentary filmmakers still rely on scattered notes, manual tracking, and intuition to measure success. As a result, they often miss clear insights into budgets, schedules, audience reach, and production efficiency. That is exactly why a Documentary Filmmakers KPI Dashboard in Excel becomes essential.
In this detailed guide, you will learn what a Documentary Filmmakers KPI Dashboard in Excel is, why it matters, how it works, and how you can use it effectively. Moreover, this article explains dashboard features, advantages, best practices, real-world use cases, and frequently asked questions. Therefore, by the end, you will clearly understand how Excel dashboards can transform documentary filmmaking into a data-driven process.
Click to buy Documentary Filmmakers KPI Dashboard in Excel
What Is a Documentary Filmmakers KPI Dashboard in Excel?
A Documentary Filmmakers KPI Dashboard in Excel is a ready-to-use performance tracking tool designed to monitor key performance indicators (KPIs) related to documentary production, distribution, and impact.
Instead of managing multiple spreadsheets, filmmakers use this dashboard to consolidate all KPIs into one interactive view. As a result, they can instantly analyze production progress, budget usage, audience engagement, and overall performance.
Moreover, Excel provides flexibility, affordability, and customization. Therefore, filmmakers of all sizes—from independent creators to production houses—can easily adopt this dashboard.
Why Do Documentary Filmmakers Need a KPI Dashboard?
Documentary projects involve long timelines, multiple stakeholders, and tight budgets. However, without structured tracking, teams struggle to answer critical questions.
For example:
- Are we on budget this month?
- Are production milestones meeting targets?
- How does this project compare with last year?
- Which KPIs show improvement or decline?
A KPI dashboard answers all these questions in one place. Consequently, filmmakers shift from guesswork to clarity.
How Does a Documentary Filmmakers KPI Dashboard in Excel Work?
This dashboard uses Excel worksheets, formulas, drop-downs, and conditional formatting to convert raw data into insights. Moreover, it supports both MTD (Month-to-Date) and YTD (Year-to-Date) analysis, which helps track short-term and long-term performance.
Let us now explore each worksheet in detail.
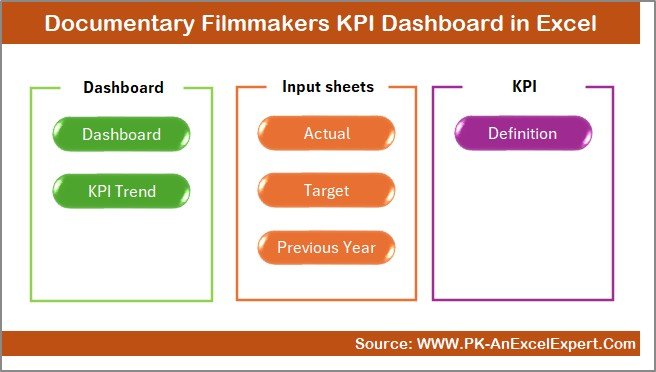
What Are the Key Worksheets in the Documentary Filmmakers KPI Dashboard?
This KPI Dashboard includes 7 well-structured worksheets, each designed for a specific purpose.
Summary Page
The Summary Page works as an index or navigation hub. Here, you get 6 clickable buttons that instantly take you to other sheets.
Why this page matters:
- It improves usability.
- It saves time.
- It makes the dashboard professional and user-friendly.
As a result, even non-technical users can navigate the dashboard easily.
Click to buy Documentary Filmmakers KPI Dashboard in Excel
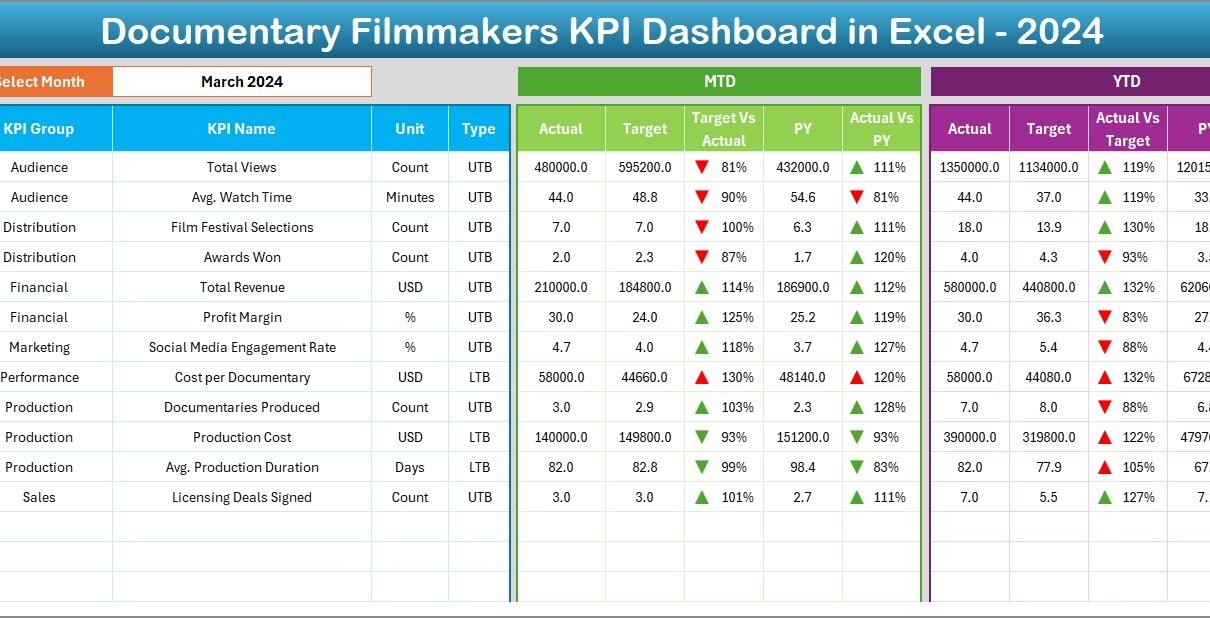
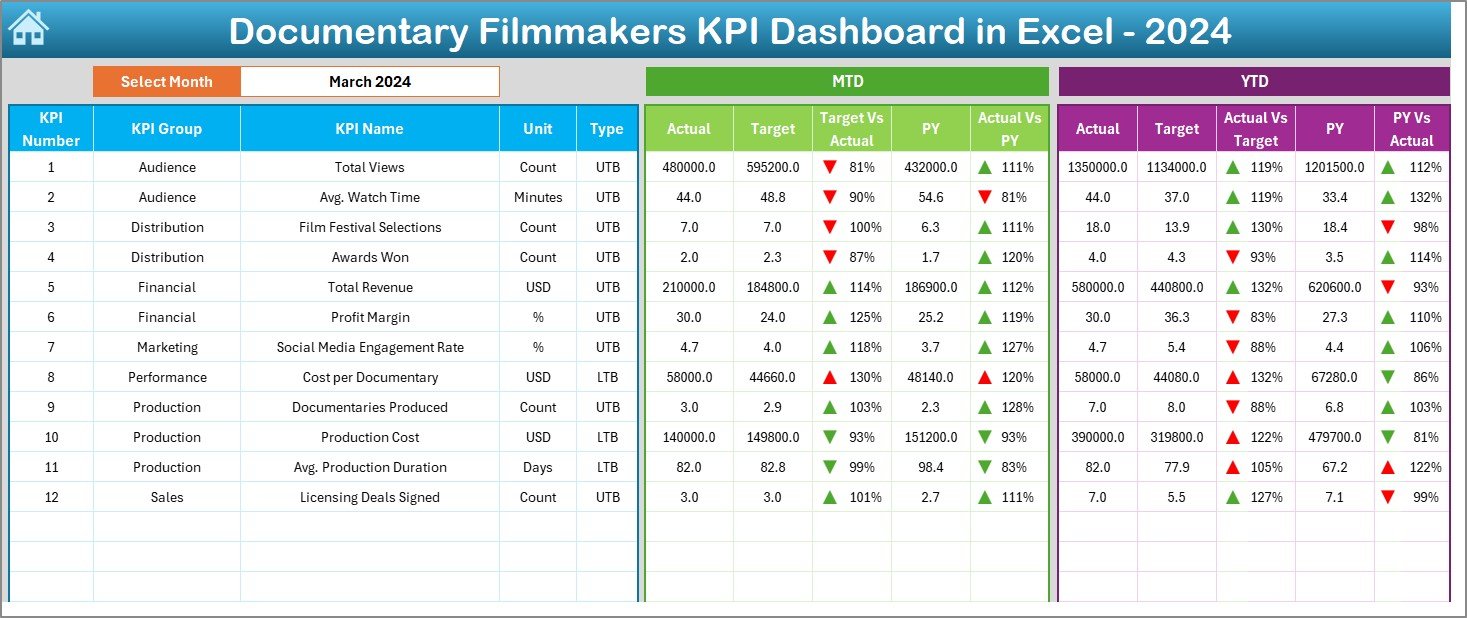
Dashboard Sheet
The Dashboard Sheet is the heart of the entire KPI Dashboard.
Key features of the Dashboard Sheet:
- Month selection drop-down at cell D3
- Automatic update of all KPIs based on the selected month
- Clear comparison between:
MTD Actual vs Target
MTD Actual vs Previous Year
YTD Actual vs Target
YTD Actual vs Previous Year
Moreover, the dashboard uses conditional formatting arrows to highlight performance direction.
Why this matters:
- Up arrows indicate improvement.
- Down arrows indicate decline.
- You instantly spot problem areas.
Therefore, decision-making becomes faster and more accurate.
Click to buy Documentary Filmmakers KPI Dashboard in Excel
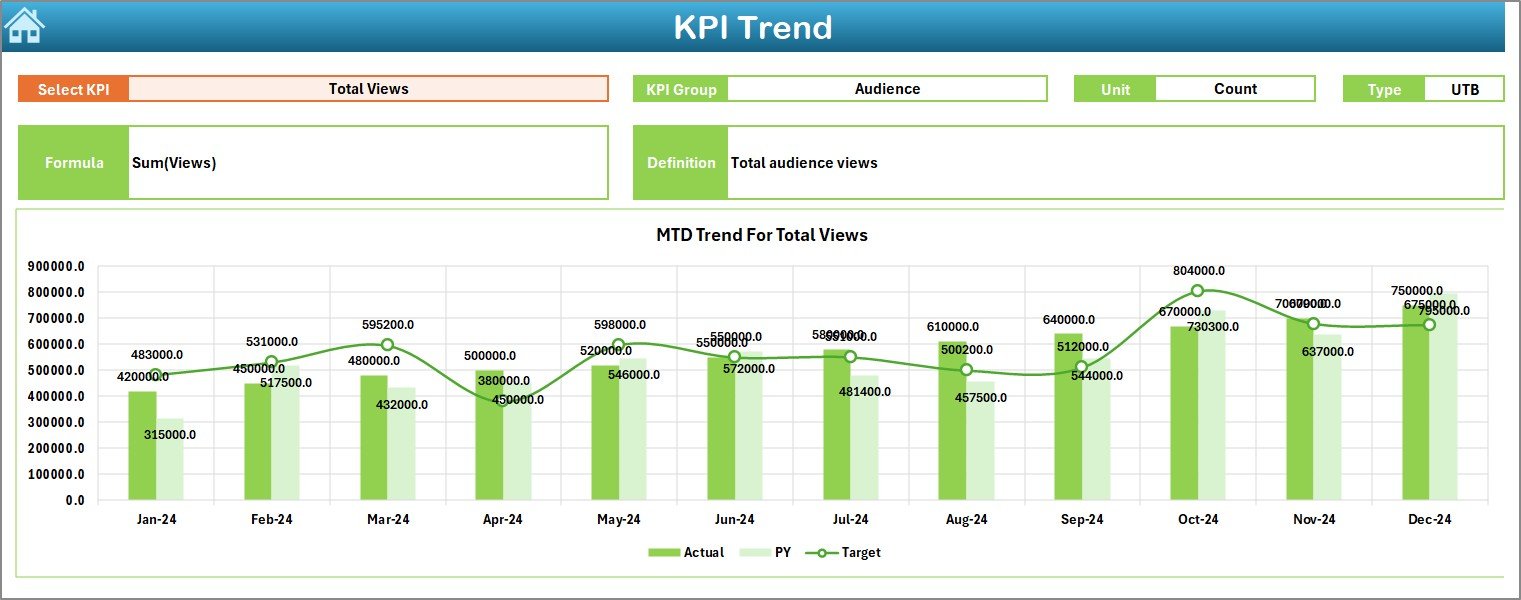
Trend Sheet
The Trend Sheet focuses on KPI-level analysis over time.
What you can do here:
- Select a KPI Name from the drop-down in cell C3
- View related details:
KPI Group
KPI Unit
KPI Type (Upper the Better or Lower the Better)
KPI Formula
KPI Definition
In addition, this sheet displays MTD and YTD trend charts for:
- Actual values
- Target values
- Previous Year values
As a result, you clearly understand how each KPI performs over time.
Click to buy Documentary Filmmakers KPI Dashboard in Excel
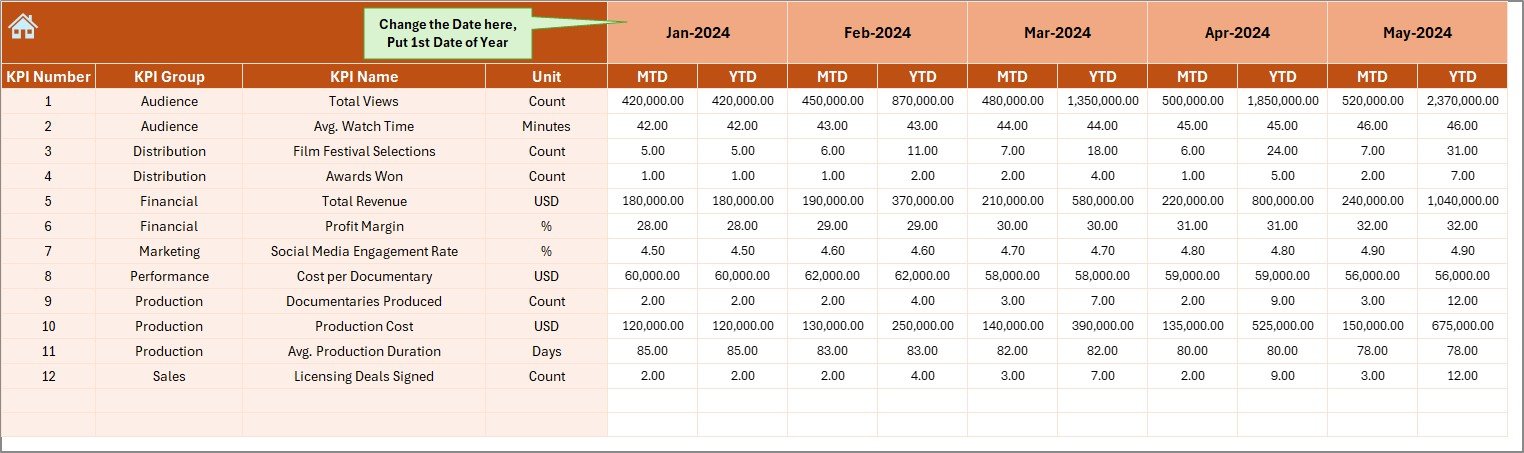
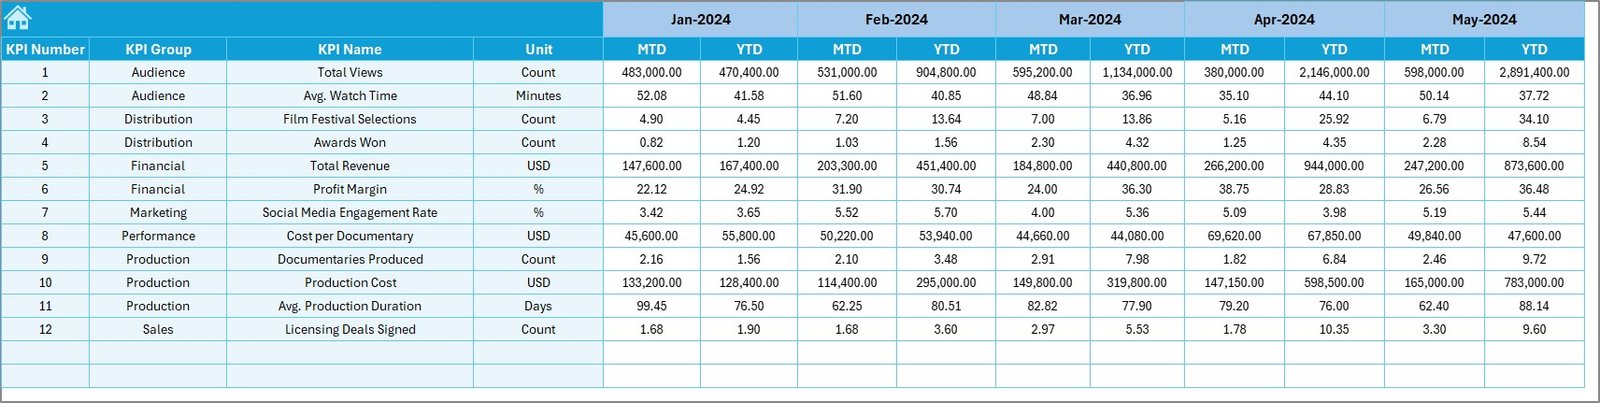
Actual Numbers Input Sheet
The Actual Numbers Input Sheet allows you to record real performance data.
Key steps:
- Set the first month of the year in cell E1
- Select months dynamically
- Enter MTD and YTD actual numbers for each KPI
Because the dashboard connects directly to this sheet, all visuals update automatically. Therefore, data entry stays simple and efficient.
Click to buy Documentary Filmmakers KPI Dashboard in Excel
the Target Sheet
The Target Sheet defines performance expectations.
Here, you:
- Enter MTD targets for each KPI
- Enter YTD targets for each KPI
This structure ensures clear benchmarks. Consequently, you always know whether performance meets expectations or not.
Click to buy Documentary Filmmakers KPI Dashboard in Excel
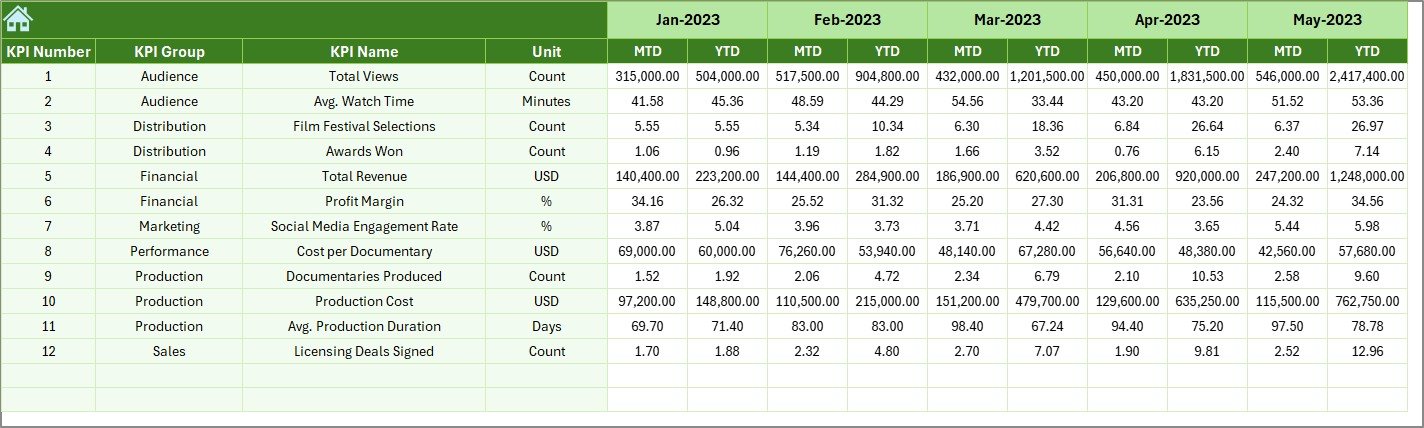
Previous Year Numbers Sheet
The Previous Year Numbers Sheet stores historical data.
Benefits of this sheet:
- Enables year-over-year comparison
- Shows growth or decline clearly
- Helps evaluate long-term progress
Therefore, filmmakers gain context instead of reviewing numbers in isolation.
Click to buy Documentary Filmmakers KPI Dashboard in Excel
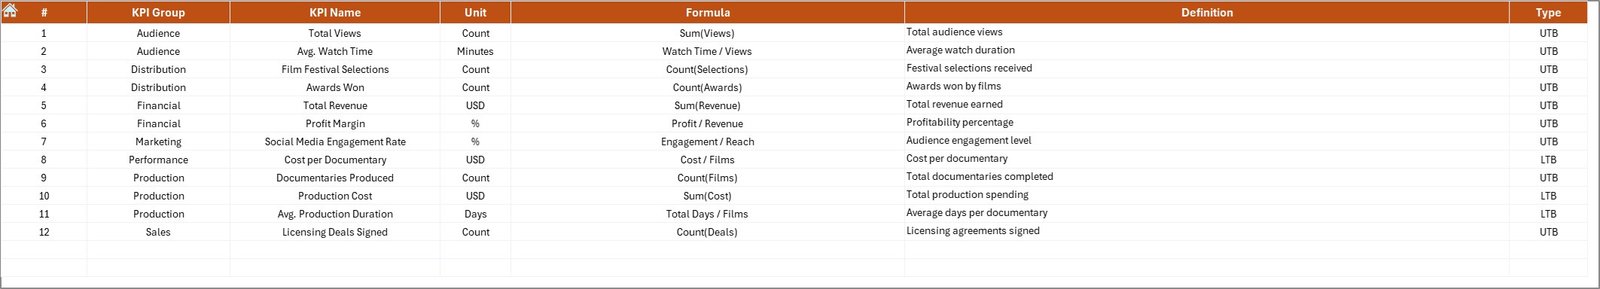
KPI Definition Sheet
The KPI Definition Sheet acts as a reference guide.
Information included:
- KPI Name
- KPI Group
- Unit of measurement
- KPI Formula
- KPI Definition
This sheet ensures consistency across teams. As a result, everyone interprets KPIs the same way.
Click to buy Documentary Filmmakers KPI Dashboard in Excel
Which KPIs Can Documentary Filmmakers Track Using This Dashboard?
This dashboard supports a wide range of KPIs, including:
- Production completion rate
- Budget utilization percentage
- Shooting days variance
- Post-production turnaround time
- Audience reach growth
- Festival selection rate
- Revenue vs cost ratio
- Engagement growth rate
Since the KPI Definition sheet remains flexible, you can easily add or modify KPIs.
What Are the Advantages of a Documentary Filmmakers KPI Dashboard in Excel?
Using this dashboard delivers several advantages.
Centralized Performance Tracking
You track all KPIs in one place. Therefore, you avoid scattered files and confusion.
Better Budget Control
You instantly see budget deviations. As a result, cost overruns reduce.
Improved Planning
Trend analysis highlights patterns. Consequently, future planning improves.
Time Savings
Automation reduces manual reporting. Therefore, you focus more on storytelling.
Clear Accountability
Targets vs actuals create ownership across teams.
What Opportunities for Improvement Does This Dashboard Offer?
Even though the dashboard already delivers value, you can enhance it further.
Opportunities include:
- Adding slicers for project or genre
- Integrating Power Query for automation
- Linking with Google Sheets or Power BI
- Adding charts for regional or platform analysis
As a result, the dashboard evolves with your growing needs.
Best Practices for Using a Documentary Filmmakers KPI Dashboard in Excel
To get maximum value, follow these best practices.
Define Clear KPIs
Always align KPIs with project goals. Otherwise, data loses meaning.
Update Data Regularly
Consistent updates ensure accurate insights. Therefore, avoid delays.
Review Trends Monthly
Monthly reviews reveal issues early. As a result, corrections stay easier.
Use Conditional Formatting Wisely
Visual cues accelerate decision-making. However, keep them simple.
Train Your Team
Ensure everyone understands KPIs. Consequently, collaboration improves.
How Can This Dashboard Support Decision-Making?
This KPI Dashboard supports decisions at every stage.
- During pre-production, it helps plan budgets.
- During production, it tracks timelines.
- During post-production, it monitors efficiency.
- During distribution, it evaluates impact.
Therefore, filmmakers gain confidence backed by data.
Who Should Use a Documentary Filmmakers KPI Dashboard in Excel?
This dashboard suits:
- Independent documentary filmmakers
- Production houses
- Film students
- Content creators
- Media agencies
- Non-profit storytellers
Since Excel remains widely accessible, adoption stays easy.
How Is Excel Better Than Manual Reporting for Filmmakers?
Manual reports consume time and increase errors. In contrast, Excel dashboards:
- Automate calculations
- Standardize reporting
- Provide instant visuals
- Reduce dependency on tools
As a result, filmmakers stay agile.
Conclusion: Why Every Documentary Filmmaker Should Use a KPI Dashboard in Excel
Documentary filmmaking combines art with execution. However, success requires clarity, structure, and measurement. A Documentary Filmmakers KPI Dashboard in Excel delivers exactly that.
By centralizing KPIs, enabling trend analysis, and comparing targets with actuals, this dashboard empowers filmmakers to make smarter decisions. Moreover, Excel’s flexibility ensures scalability without extra cost.
Therefore, if you want to improve efficiency, control budgets, and amplify impact, this KPI dashboard becomes a must-have tool.
Frequently Asked Questions About Documentary Filmmakers KPI Dashboard in Excel
What is a KPI Dashboard in Excel for documentary filmmakers?
It is a structured Excel tool that tracks production, budget, and impact KPIs in one place.
Can beginners use this dashboard?
Yes, the dashboard uses simple drop-downs and clear layouts.
Can I customize KPIs?
Absolutely. You can add, edit, or remove KPIs in the KPI Definition sheet.
Does the dashboard support MTD and YTD tracking?
Yes, it supports both Month-to-Date and Year-to-Date analysis.
Can I compare current performance with last year?
Yes, the Previous Year Numbers sheet enables year-over-year comparison.
Is Excel sufficient for KPI tracking?
Yes, Excel offers flexibility, affordability, and strong analytical capabilities.
How often should I update the dashboard?
You should update it monthly for best results.
Can this dashboard support multiple projects?
Yes, with minor customization, it can support multiple projects.
Visit our YouTube channel to learn step-by-step video tutorials
Watch the step-by-step video tutorial:
Click to buy Documentary Filmmakers KPI Dashboard in Excel