Logistics tech startups operate in a highly competitive and fast-evolving ecosystem. Funding pressure, customer expectations, rising fuel costs, and technology investments demand real-time visibility into performance. However, many startups still rely on disconnected reports and static spreadsheets. As a result, leaders miss trends, delay decisions, and lose growth opportunities.
That is exactly why a Logistics Tech Startups Dashboard in Power BI becomes a critical strategic tool.
In this in-depth blog post, you will learn what a Logistics Tech Startups Dashboard in Power BI is, why it matters, how it works, and how startups can use it to drive smarter decisions. Moreover, this article explains dashboard pages, advantages, best practices, real-world use cases, and frequently asked questions.
Click to Purchases Logistics Tech Startups Dashboard in Power BI
What Is a Logistics Tech Startups Dashboard in Power BI?
A Logistics Tech Startups Dashboard in Power BI is an interactive analytics solution designed to track funding, revenue, costs, customer performance, regional metrics, and growth trends for logistics-focused startups.
Instead of reviewing multiple reports, this dashboard consolidates all key metrics into a single Power BI file with interactive slicers, cards, and charts. As a result, founders, investors, and operations teams gain instant clarity on business health.
Additionally, Power BI enables dynamic filtering and visual storytelling, which helps startups move faster with confidence.
Why Do Logistics Tech Startups Need a Power BI Dashboard?
Logistics startups manage complex variables such as funding rounds, operational costs, customer segments, regional demand, and monthly growth. However, without a centralized dashboard, tracking these metrics becomes slow and error-prone.
A Power BI dashboard solves this challenge by:
-
Centralizing startup KPIs in one place
-
Providing real-time performance visibility
-
Highlighting cost drivers and profit gaps
-
Supporting investor-ready reporting
-
Enabling data-driven growth strategies
As a result, startups shift from reactive reporting to proactive leadership.
How Does the Logistics Tech Startups Dashboard in Power BI Work?
The dashboard connects structured data sources (such as Excel or databases) to Power BI. Once data refreshes, visuals update automatically across all pages.
Users interact with slicers to filter data by region, segment, or time. Consequently, decision-makers explore insights instantly without manual calculations.
What Pages Are Included in the Logistics Tech Startups Dashboard?
This dashboard contains five professionally designed pages, each focused on a specific analytical area.
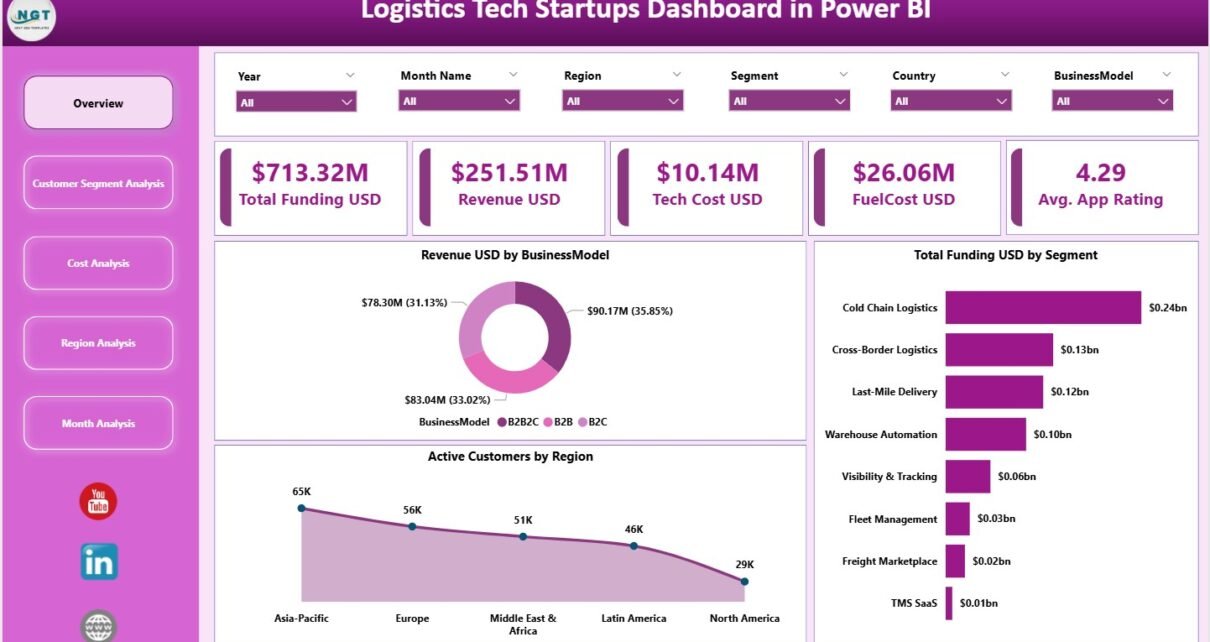
What Does the Overview Page Show?

The Overview Page acts as the executive summary of the dashboard.
What KPI Cards Are Displayed?
This page displays five high-impact KPI cards:
-
Total Funding (USD)
-
Revenue (USD)
-
Tech Cost (USD)
-
Fuel Cost (USD)
-
Average App Rating
These cards provide an instant snapshot of financial strength, cost structure, and customer perception.
What Charts Are Included on the Overview Page?
The overview page includes three strategic charts:
-
Revenue USD by Business Model – Understand which models drive income
-
Total Funding USD by Segment – Analyze funding allocation
-
Active Customers by Region – Identify regional demand patterns
Because of these visuals, leaders quickly understand where the startup stands.
How Does Customer Segment Analysis Help Startups?
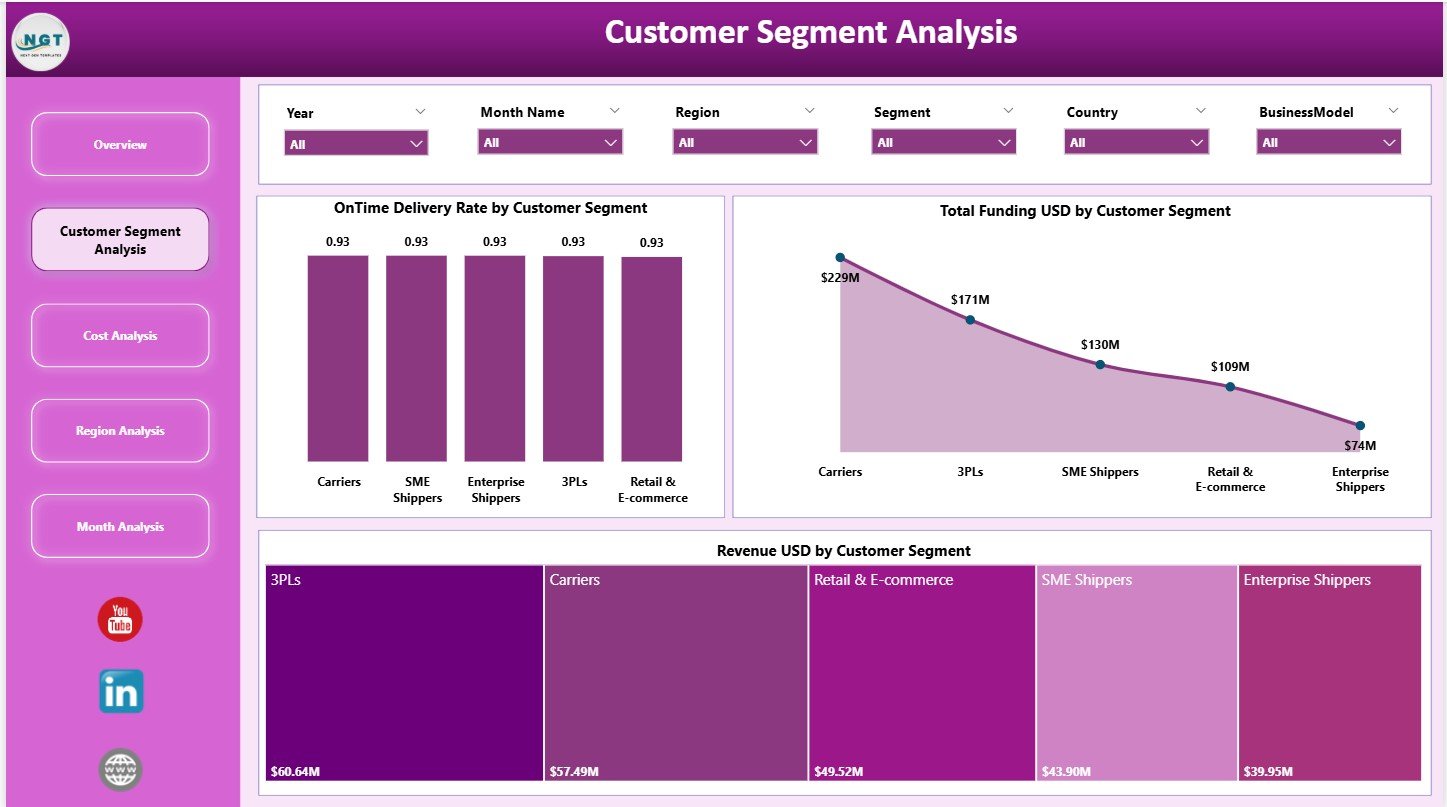
The Customer Segment Analysis Page focuses on customer-level performance.
What Metrics Are Analyzed by Customer Segment?
This page includes three insightful charts:
-
On-Time Delivery Rate by Customer Segment
-
Total Funding USD by Customer Segment
-
Revenue USD by Customer Segment
These insights help startups identify:
-
High-value customer segments
-
Delivery performance gaps
-
Revenue concentration risks
As a result, teams optimize service strategies and pricing models.
Click to Purchases Logistics Tech Startups Dashboard in Power BI
Why Is Cost Analysis Critical for Logistics Startups?
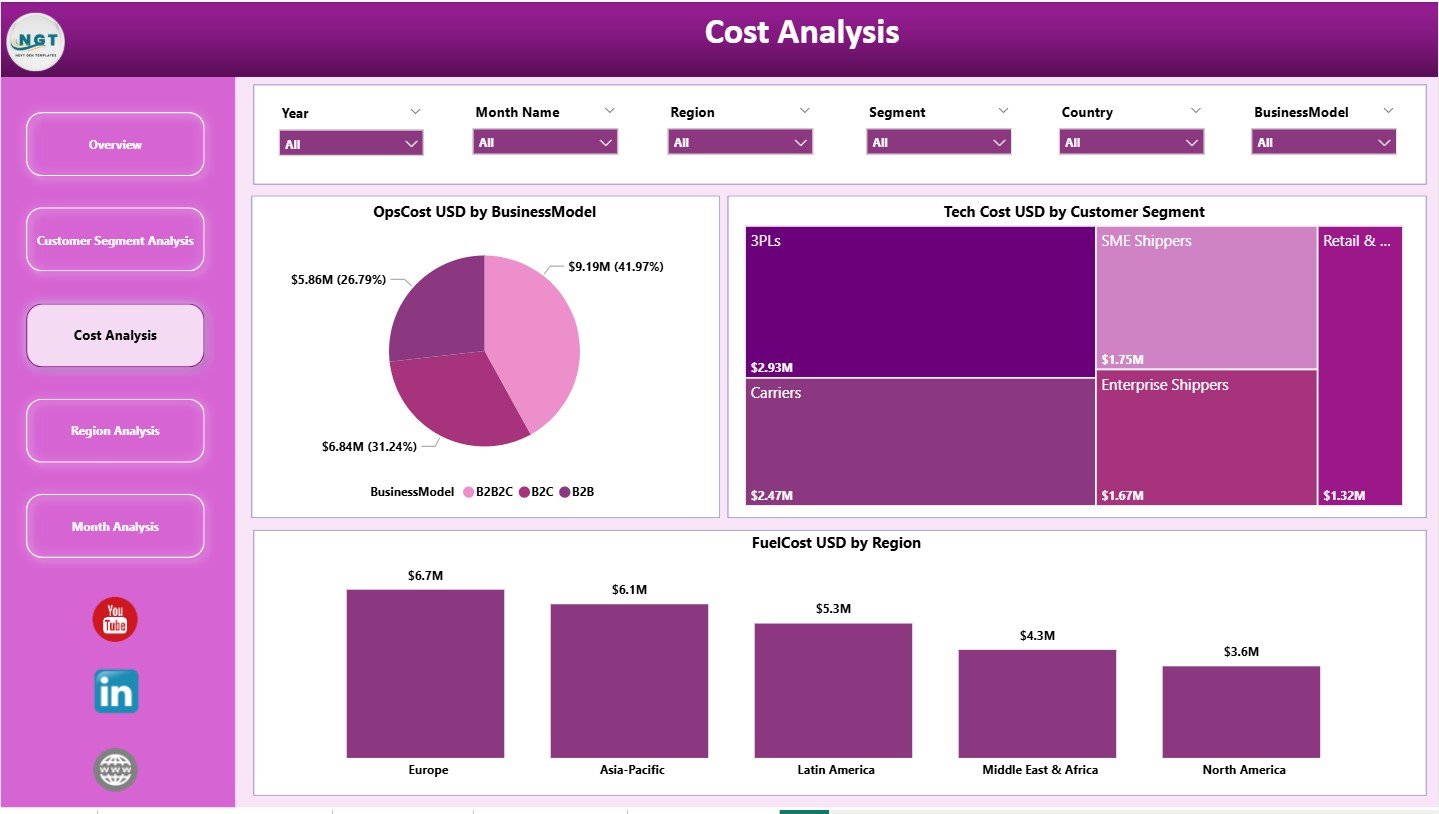
The Cost Analysis Page helps startups control expenses and protect margins.
What Cost Metrics Are Visualized?
This page includes three cost-focused charts:
-
Operational Cost USD by Business Model
-
Tech Cost USD by Customer Segment
-
Fuel Cost USD by Region
Because logistics startups face tight margins, this page highlights inefficiencies immediately. Consequently, leaders take corrective actions faster.
What Insights Does the Region Analysis Page Provide?

The Region Analysis Page focuses on geographic performance.
What Regional KPIs Are Displayed?
This page includes two key charts:
-
Gross Margin % by Region
-
Revenue USD by Region
These visuals help startups understand:
-
Which regions deliver higher profitability
-
Where expansion makes sense
-
Which regions require cost optimization
As a result, regional strategies become data-driven.
Click to Purchases Logistics Tech Startups Dashboard in Power BI
Why Is the Monthly Trends Page Important?

The Monthly Trends Page tracks growth over time.
What Monthly Trends Are Shown?
This page includes two trend charts:
-
Total Funding USD by Month
-
Revenue USD by Month
These trends help startups:
-
Track fundraising momentum
-
Monitor revenue growth consistency
-
Identify seasonality and growth patterns
Because investors value trends, this page becomes especially powerful during reviews.
Advantages of Logistics Tech Startups Dashboard in Power BI
Why Should Startups Use This Dashboard?
This dashboard delivers several strategic advantages.
-
Centralized startup performance tracking
-
Real-time financial and operational insights
-
Clear visibility into cost drivers
-
Better investor reporting and storytelling
-
Faster and smarter decision-making
-
Scalable analytics as the startup grows
Because of these benefits, startups gain a competitive edge.
How Does This Dashboard Improve Strategic Decision-Making?
The dashboard replaces assumptions with facts. Leaders instantly see what works and what does not. Moreover, visual insights highlight risks before they escalate.
As a result, decisions become faster, smarter, and more confident.
Who Can Benefit from a Logistics Tech Startups Dashboard?
This dashboard supports multiple stakeholders, including:
-
Startup founders and co-founders
-
Investors and venture capital firms
-
Operations and supply chain teams
-
Finance and strategy teams
-
Product and technology leaders
Each group accesses insights relevant to their goals.
Click to Purchases Logistics Tech Startups Dashboard in Power BI
Best Practices for Logistics Tech Startups Dashboard in Power BI
How Can Startups Maximize Dashboard Value?
Follow these best practices for long-term success.
-
Define KPIs clearly before implementation
-
Maintain consistent cost and revenue definitions
-
Refresh data regularly
-
Use slicers for focused analysis
-
Review monthly trends consistently
-
Align dashboard metrics with investor expectations
When startups follow these practices, the dashboard becomes a growth engine.
How Does This Dashboard Support Startup Scalability?
As startups scale, data complexity increases. This dashboard adapts easily by adding new segments, regions, or metrics.
Therefore, startups grow without rebuilding analytics from scratch.
Common Use Cases of Logistics Tech Startups Dashboard
Where Can This Dashboard Be Used?
This dashboard works well for:
-
Early-stage logistics tech startups
-
VC-backed growth-stage companies
-
Digital freight platforms
-
Last-mile delivery startups
-
Fleet and mobility technology firms
Each use case benefits from structured, visual insights.
Conclusion: Why Is a Logistics Tech Startups Dashboard in Power BI Essential?
A Logistics Tech Startups Dashboard in Power BI transforms complex startup data into clear, actionable insights. It improves transparency, strengthens cost control, and supports smarter growth decisions.
Because it combines powerful visuals with interactive analysis, the dashboard becomes an essential tool for founders and investors alike. In a competitive logistics tech landscape, data clarity defines success.
Therefore, adopting a Power BI dashboard is no longer optional—it is strategic.
Frequently Asked Questions (FAQs)
What metrics can be tracked in a Logistics Tech Startups Dashboard?
You can track funding, revenue, operational costs, tech costs, fuel costs, customer performance, margins, and regional trends.
Is this dashboard suitable for early-stage startups?
Yes. The dashboard works well for both early-stage and growth-stage startups.
Can investors use this dashboard?
Absolutely. The dashboard provides investor-ready insights and trends.
Can the dashboard be customized?
Yes. You can add new KPIs, segments, or regions easily.
How often should data be refreshed?
Monthly refresh works best, but fast-growing startups may refresh data weekly.
Click to Purchases Logistics Tech Startups Dashboard in Power BI
Visit our YouTube channel to learn step-by-step video tutorials