Fitness apps operate in one of the fastest-growing digital industries. Every day, users track workouts, calories, steps, heart rate, and progress through mobile apps. At the same time, app owners and product managers must track downloads, active users, retention, revenue, and engagement metrics. However, when this data remains scattered across tools and reports, teams lose clarity and speed.
That is exactly where a Fitness Apps KPI Dashboard in Excel becomes a powerful and practical solution.
In this detailed guide, you will learn what a Fitness Apps KPI Dashboard in Excel is, how it works, its worksheet-wise structure, advantages, best practices, and frequently asked questions. Moreover, this article uses simple language, active voice, and real-world logic, so you can easily understand and apply it without technical complexity.
Click to Purchases Fitness Apps KPI Dashboard in Excel
What Is a Fitness Apps KPI Dashboard in Excel?
A Fitness Apps KPI Dashboard in Excel is a ready-to-use performance monitoring and analytics tool designed to track the most important key performance indicators (KPIs) of fitness and wellness applications.
Instead of reviewing multiple reports from analytics tools, this dashboard consolidates actual performance, targets, and previous year data into a single Excel file. As a result, app owners, growth managers, and analysts gain a clear, centralized view of performance.
This dashboard helps track:
-
User acquisition and growth
-
User engagement and activity
-
Retention and churn
-
Revenue and monetization
-
Performance against targets
Because it runs fully in Excel, you do not need advanced technical skills or paid BI software.
Why Do Fitness Apps Need a KPI Dashboard in Excel?
Fitness apps face intense competition. Therefore, tracking performance regularly becomes critical.
Without a KPI dashboard:
-
Teams rely on assumptions instead of data
-
Growth problems remain hidden
-
Engagement issues go unnoticed
-
Targets lose visibility
However, when you use a Fitness Apps KPI Dashboard in Excel, you gain clarity, consistency, and control.
This dashboard allows you to:
-
Monitor MTD and YTD performance
-
Compare actual results with targets
-
Track growth against the previous year
-
Identify trends early
As a result, decision-making becomes faster and more accurate.
Click to Purchases Fitness Apps KPI Dashboard in Excel
How Does a Fitness Apps KPI Dashboard in Excel Work?
The dashboard works by connecting structured input sheets with automated calculations and visual outputs.
Here is how it works step by step:
-
You enter monthly actual KPI values
-
You define monthly and yearly targets
-
You input previous year data
-
Excel formulas calculate MTD and YTD values
-
Charts and indicators update automatically
Because of this flow, the dashboard always reflects the latest performance without manual calculations.
Click to Purchases Fitness Apps KPI Dashboard in Excel
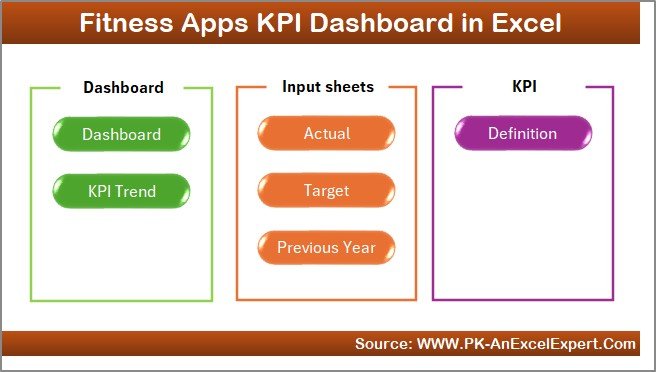
What Worksheets Are Included in the Fitness Apps KPI Dashboard in Excel?
This ready-to-use dashboard includes 7 structured worksheets, each designed for a specific function.
1. What Is the Home Sheet in the Fitness Apps KPI Dashboard?
The Home Sheet works as an index and navigation page.
Key Features of the Home Sheet:
-
Clean layout
-
6 clickable buttons
-
Quick navigation to all major sheets
Because of this design, users can move across the dashboard smoothly and efficiently.
2. What Does the Dashboard Sheet Show?
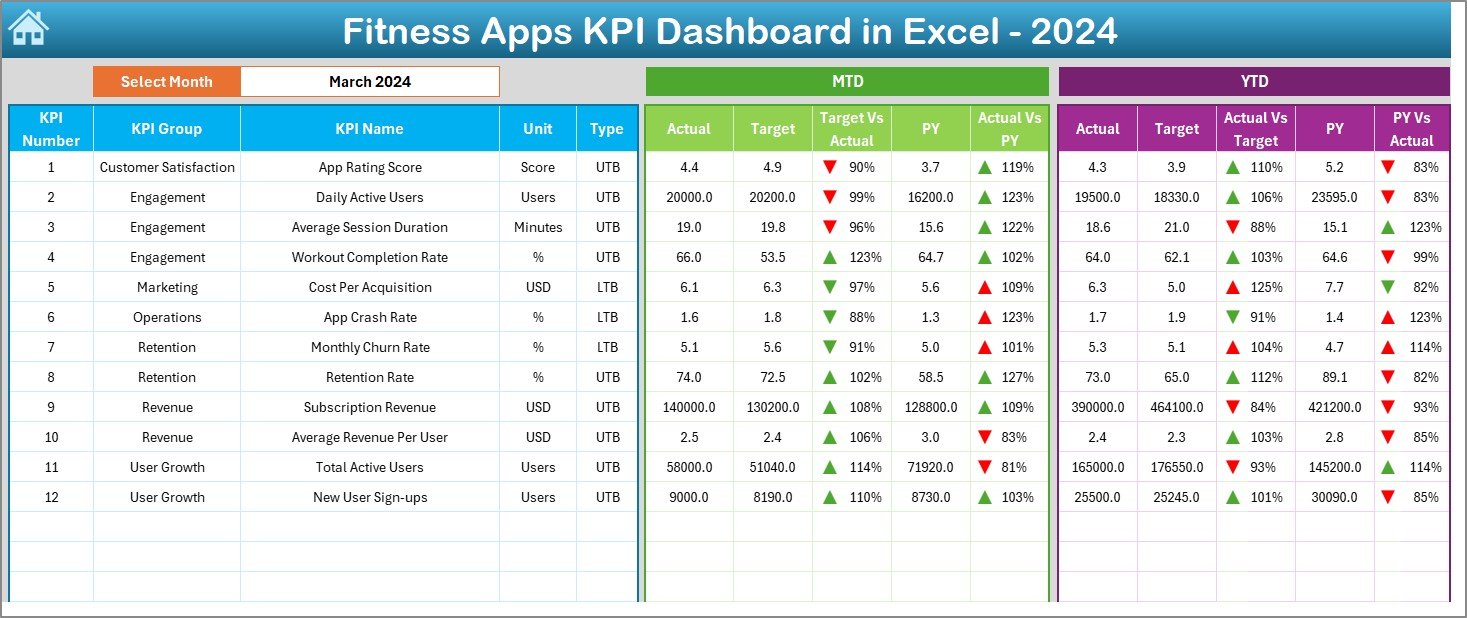
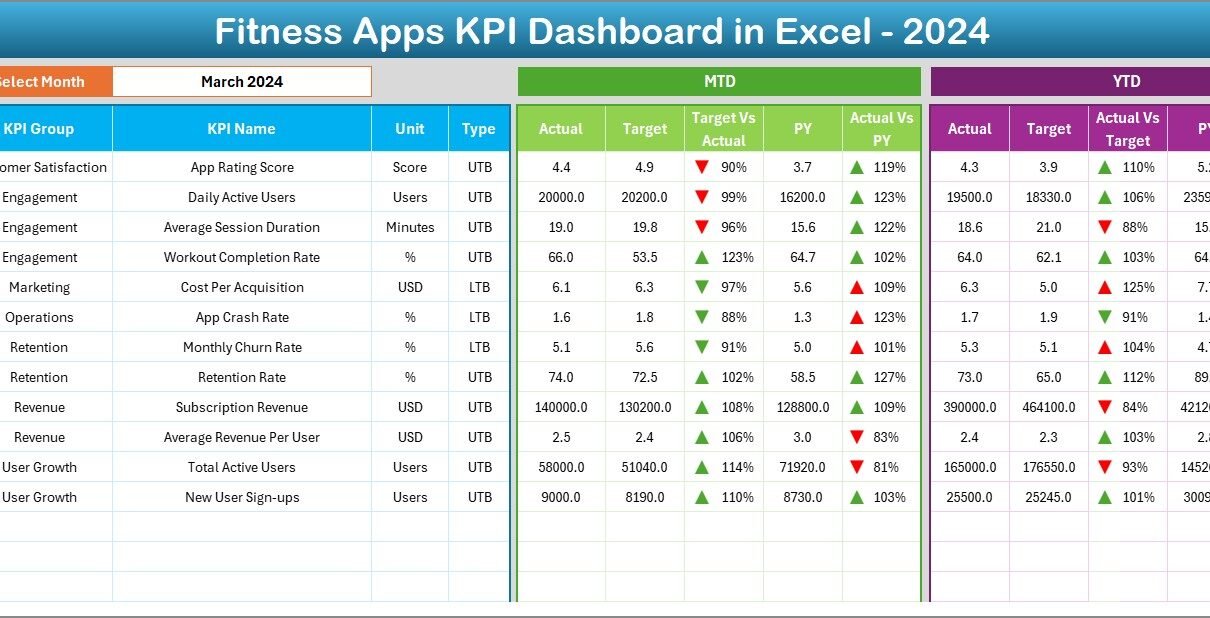
The Dashboard Sheet acts as the central performance overview of the Fitness Apps KPI Dashboard in Excel.
Key Features:
-
Month selection drop-down at cell D3
-
Automatic update of all KPIs
-
Clear KPI comparison visuals
Performance Metrics Displayed:
-
MTD Actual vs Target
-
MTD Actual vs Previous Year
-
YTD Actual vs Target
-
YTD Actual vs Previous Year
Additionally, the dashboard uses conditional formatting arrows:
-
Green upward arrows for positive performance
-
Red downward arrows for negative performance
Because of this, decision-makers can instantly identify areas that need attention.
Click to Purchases Fitness Apps KPI Dashboard in Excel
3. What Is the KPI Trend Sheet and Why Is It Important?
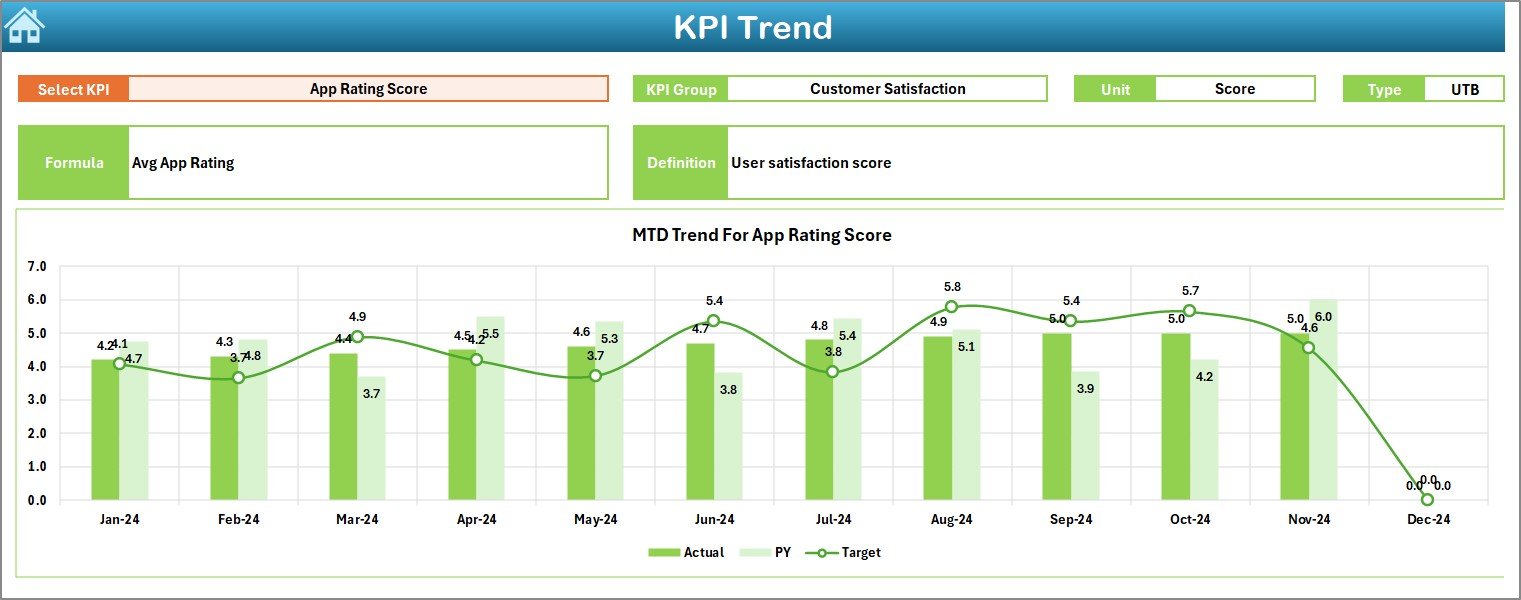
The KPI Trend Sheet helps you analyze performance behavior over time.
How This Sheet Works:
-
Select a KPI name from the drop-down at cell C3
-
View detailed KPI information:
-
KPI Group
-
KPI Unit
-
KPI Type (LTB or UTB)
-
KPI Formula
-
KPI Definition
-
Visual Analysis:
-
MTD trend chart for Actual, Target, and PY
-
YTD trend chart for Actual, Target, and PY
As a result, you understand whether performance improves, declines, or stays flat.
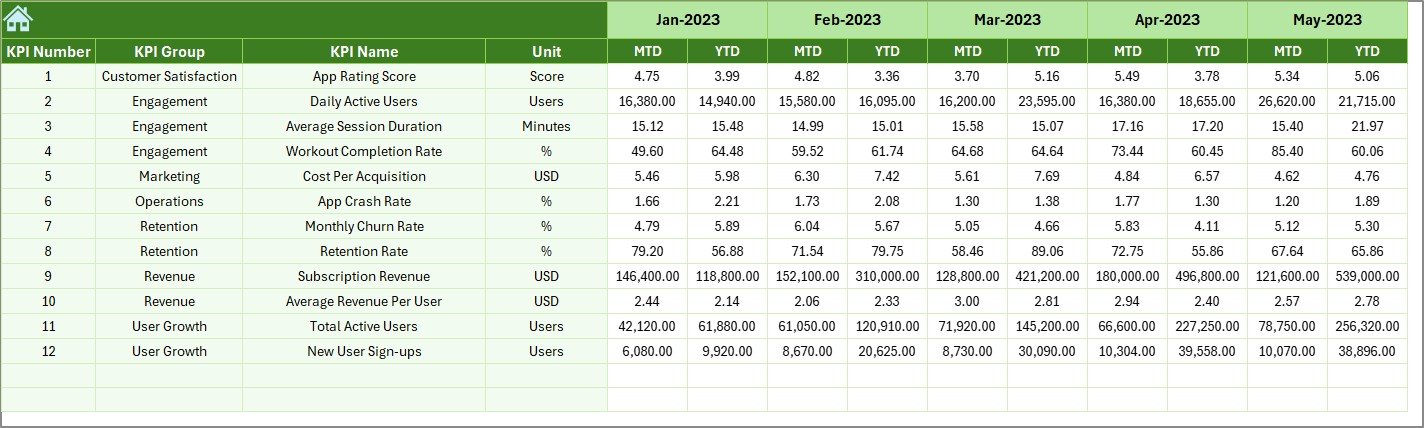
4. How Do You Use the Actual Numbers Input Sheet?
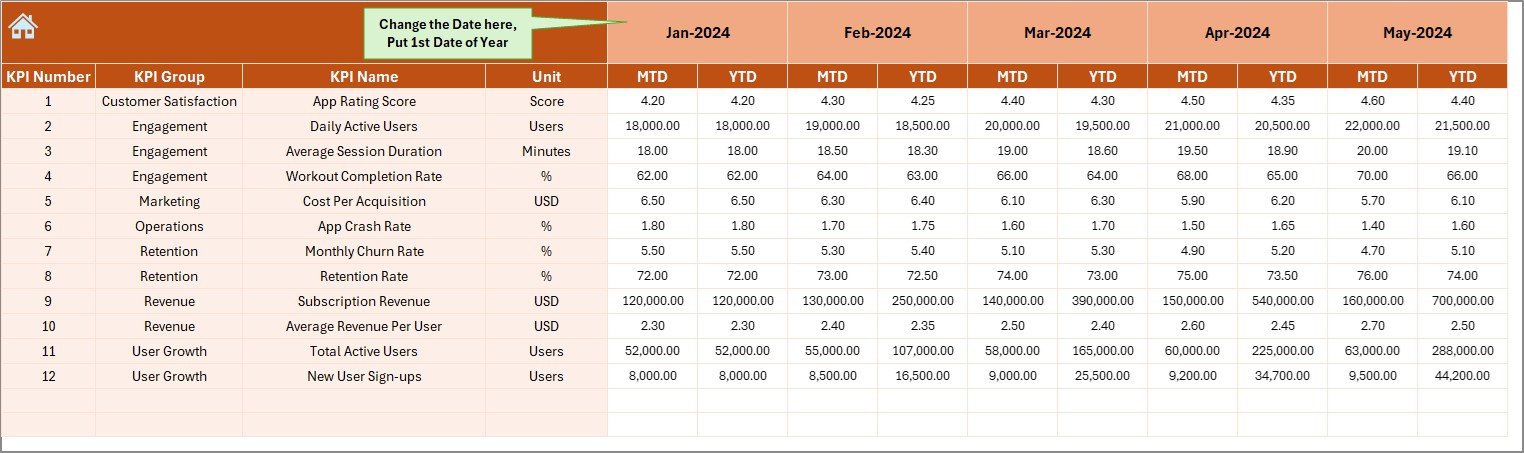
The Actual Numbers Input Sheet stores real performance data.
How to Use It:
-
Select the first month of the year in cell E1
-
Enter MTD and YTD actual values for each KPI
-
Update data monthly without touching formulas
Because the dashboard links directly to this sheet, all visuals refresh automatically.
Click to Purchases Fitness Apps KPI Dashboard in Excel
5. What Is the Purpose of the Target Sheet?
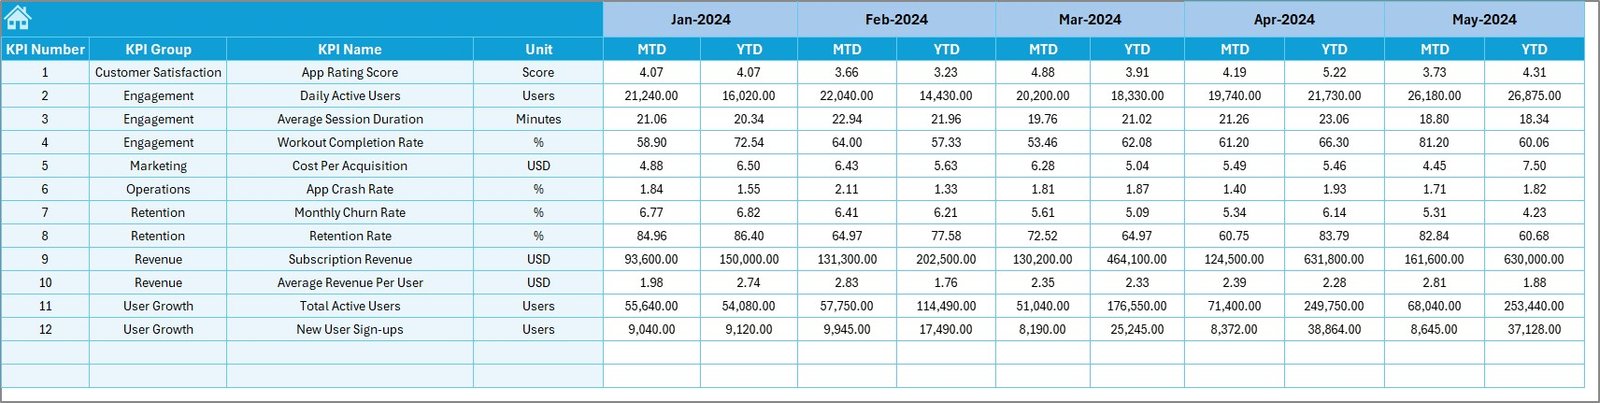
The Target Sheet stores planned performance goals.
What You Enter:
-
Monthly MTD targets
-
Yearly YTD targets
-
KPI-wise target values
This structure allows the dashboard to calculate Target vs Actual variance instantly.
6. Why Is the Previous Year Number Sheet Important?
The Previous Year Number Sheet enables historical comparison.
Benefits:
-
Year-over-Year (YoY) performance tracking
-
Growth analysis
-
Seasonal trend identification
You enter data in the same format as the current year, which keeps comparisons accurate.
7. What Is the KPI Definition Sheet?
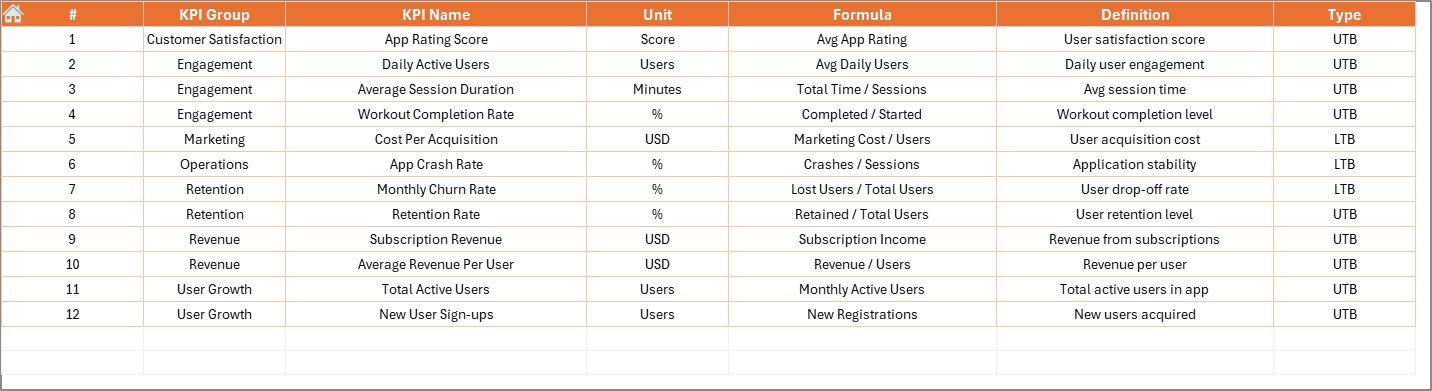
The KPI Definition Sheet acts as a reference guide.
Information Included:
-
KPI Name
-
KPI Group
-
Unit of measurement
-
Formula
-
KPI Definition
-
KPI Type (LTB / UTB)
Because of this sheet, teams stay aligned on KPI meaning and logic.
Click to Purchases Fitness Apps KPI Dashboard in Excel
What KPIs Can Fitness Apps Track Using This Dashboard?
A Fitness Apps KPI Dashboard in Excel can track KPIs such as:
-
App Downloads
-
Daily Active Users (DAU)
-
Monthly Active Users (MAU)
-
User Retention Rate
-
Churn Rate
-
Average Session Duration
-
Workout Completion Rate
-
Subscription Revenue
-
Conversion Rate
You can customize KPIs based on your app’s business model.
Click to Purchases Fitness Apps KPI Dashboard in Excel
Advantages of Fitness Apps KPI Dashboard in Excel
1. Centralized Performance View
You track all app KPIs from one Excel dashboard.
2. Easy to Use
You do not need coding or BI tools.
3. Automated Calculations
MTD, YTD, and variances calculate automatically.
4. Clear Visual Insights
Charts and arrows highlight performance clearly.
5. Cost-Effective
You avoid expensive analytics platforms.
6. Faster Decision-Making
You identify problems and opportunities early.
Who Should Use a Fitness Apps KPI Dashboard in Excel?
This dashboard is ideal for:
-
Fitness app founders
-
Product managers
-
Growth and marketing teams
-
Business analysts
-
Startup owners
-
Consultants
Because Excel is widely used, adoption remains easy.
Best Practices for the Fitness Apps KPI Dashboard in Excel
1. Update Data Consistently
Enter actual data every month without delay.
2. Track Meaningful KPIs
Focus on KPIs that drive growth and engagement.
3. Set Realistic Targets
Use historical data to define achievable goals.
4. Review Trends Regularly
Analyze KPI Trend Sheet before strategy changes.
5. Maintain Data Accuracy
Avoid overwriting formulas or formats.
6. Align Teams on KPI Definitions
Ensure everyone understands KPI logic.
How Does This Dashboard Improve Fitness App Growth?
This dashboard improves growth by:
-
Highlighting engagement drop-offs
-
Identifying retention issues
-
Tracking revenue trends
-
Monitoring user behavior
As a result, teams take data-driven actions instead of assumptions.
Click to Purchases Fitness Apps KPI Dashboard in Excel
Can You Customize the Fitness Apps KPI Dashboard in Excel?
Yes, you can customize:
-
KPIs
-
KPI groups
-
Targets
-
Reporting months
Because it uses standard Excel logic, customization remains simple and flexible.
Click to Purchases Fitness Apps KPI Dashboard in Excel
Conclusion: Why Use a Fitness Apps KPI Dashboard in Excel?
A Fitness Apps KPI Dashboard in Excel transforms complex app data into clear, actionable insights. Instead of relying on fragmented reports, you gain one structured view of performance.
This dashboard helps you:
-
Track growth consistently
-
Improve engagement
-
Compare performance year over year
-
Make faster, smarter decisions
If you want a practical and cost-effective analytics solution, this Excel dashboard becomes the perfect choice.
Frequently Asked Questions (FAQs)
1. What is a Fitness Apps KPI Dashboard in Excel?
It is an Excel-based tool that tracks fitness app KPIs using automated calculations and visuals.
2. Do I need advanced Excel skills?
No, basic Excel knowledge is enough.
3. Can I add new KPIs?
Yes, you can easily add or modify KPIs.
4. Does the dashboard support MTD and YTD analysis?
Yes, it tracks both automatically.
5. Is this dashboard suitable for startups?
Yes, it works well for startups and large apps.
6. How often should I update the dashboard?
You should update it monthly for best results.
Click to Purchases Fitness Apps KPI Dashboard in Excel
Visit our YouTube channel to learn step-by-step video tutorials