Managing duty-free retail operations requires speed, accuracy, and clear insights. However, many duty-free retailers still depend on multiple Excel files, manual reports, and delayed summaries. As a result, decision-makers struggle to track sales trends, customer behavior, and profitability in real time. Therefore, businesses now prefer modern analytics solutions to stay competitive.
That is exactly where a Duty-Free Retail Dashboard in Power BI becomes a powerful and reliable solution.
This article explains everything you need to know about a Duty-Free Retail Dashboard in Power BI. Moreover, it covers how the dashboard works, why it matters, its page-wise structure, advantages, best practices, and frequently asked questions. Additionally, the language remains simple and practical so you can understand and implement the dashboard easily.
Click to Purchases Duty-Free Retail Dashboard in Power BI
What Is a Duty-Free Retail Dashboard in Power BI?
A Duty-Free Retail Dashboard in Power BI is an interactive analytics solution designed to monitor, analyze, and visualize duty-free retail performance in real time. Instead of checking multiple reports, managers can view sales, costs, profit margins, customer types, store categories, regions, and monthly trends from a single dashboard.
Moreover, this dashboard connects with an Excel or database data source. As a result, once you update the data and refresh Power BI, all visuals update automatically. Therefore, you save time, reduce errors, and improve decision-making.
Most importantly, this dashboard helps airport retailers, duty-free store managers, finance teams, and business leaders gain instant clarity on retail performance.
Why Do Duty-Free Retailers Need a Power BI Dashboard?
Duty-free retail operates in a highly competitive and fast-moving environment. However, traditional reporting methods create several challenges.
Common Challenges Without a Dashboard
-
Retail data remains scattered across multiple files
-
Sales and cost analysis takes too much time
-
Profit margins remain unclear by category or region
-
Customer behavior becomes difficult to analyze
-
Monthly trends get identified too late
Therefore, businesses need a centralized solution that provides real-time insights.
How Does Power BI Solve These Problems?
Power BI transforms raw retail data into meaningful visuals. Consequently, managers can quickly identify profitable store categories, high-performing regions, and valuable customer segments. Moreover, they can take corrective actions before losses increase.
How Does a Duty-Free Retail Dashboard in Power BI Work?
A Duty-Free Retail Dashboard in Power BI works through a simple and effective process.
-
First, retail data gets stored in Excel or a database
-
Then, Power BI connects to the data source
-
Next, calculations such as profit, cost, net sales, and margins get applied
-
After that, interactive visuals display the insights
-
Finally, slicers allow users to filter data by category, region, customer type, or month
As a result, decision-makers gain instant insights with just a few clicks.
What Pages Are Included in a Duty-Free Retail Dashboard in Power BI?
This dashboard contains five powerful and well-structured pages. Each page focuses on a specific aspect of duty-free retail performance.
Let us explore each page in detail.
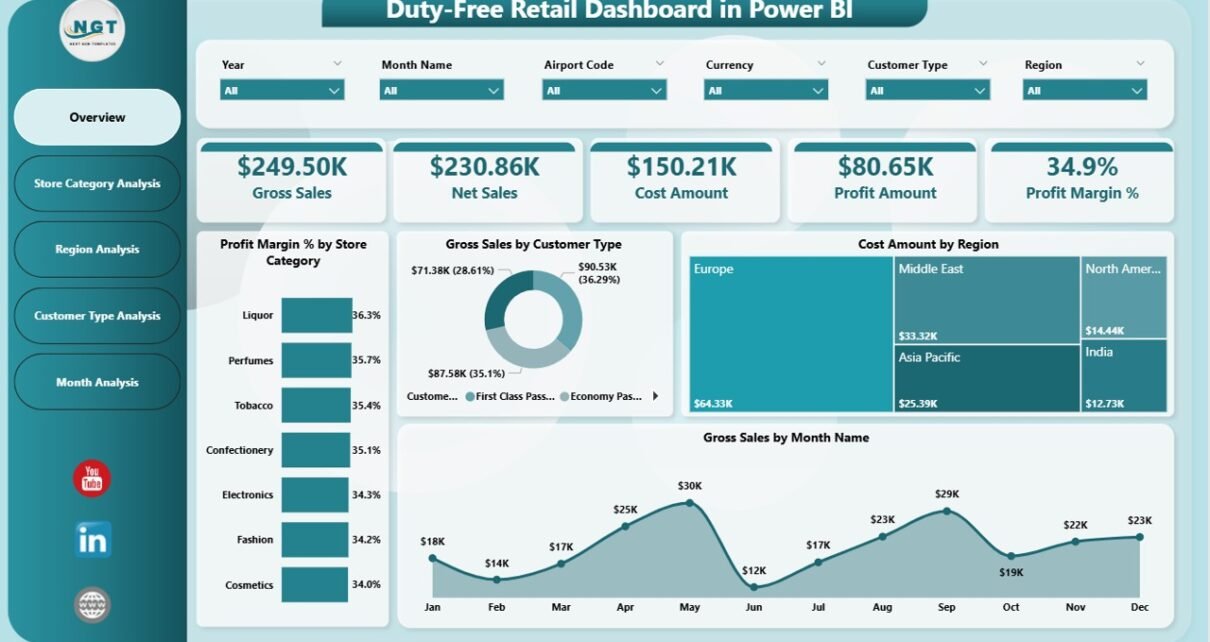
What Does the Overview Page Show in the Duty-Free Retail Dashboard?
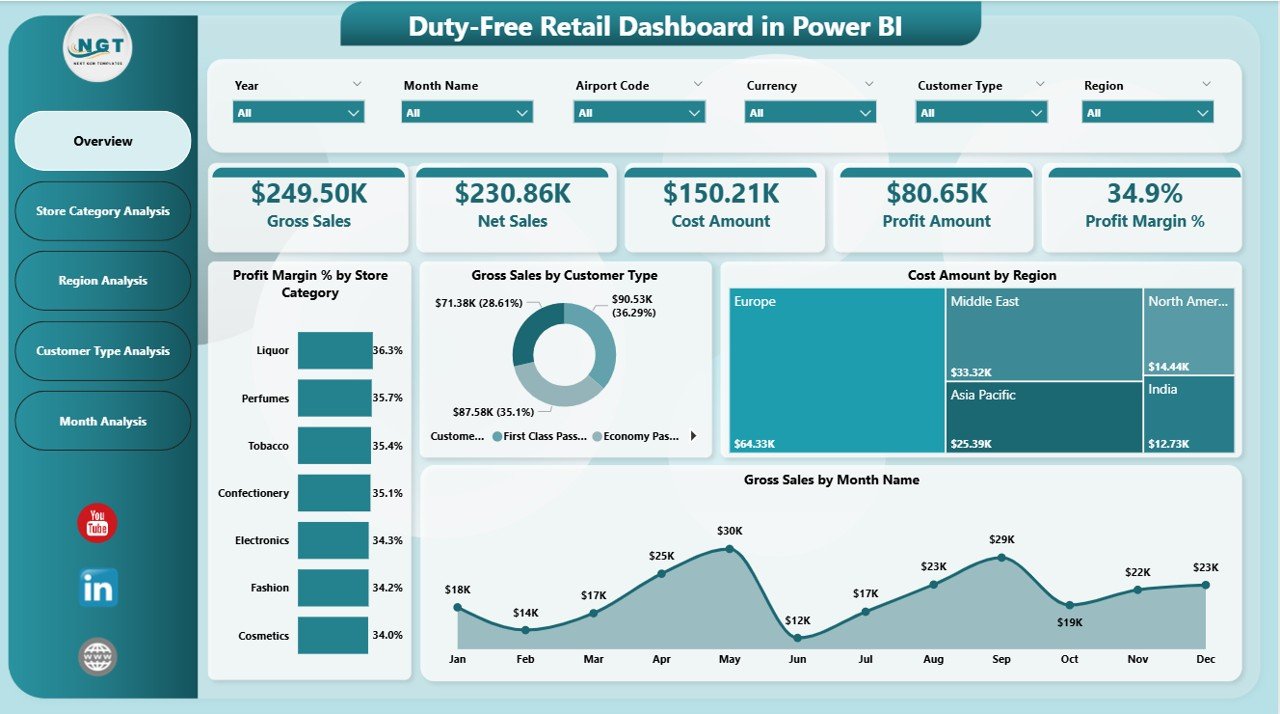
The Overview Page serves as the main entry point of the dashboard. It provides a high-level summary of overall retail performance.
Key Elements of the Overview Page
-
Interactive slicers for quick filtering
-
KPI cards for instant performance tracking
-
High-level charts for sales, cost, and profit trends
KPIs and Visuals on the Overview Page
The overview page includes four KPI cards:
-
Profit Margin (%)
-
Gross Sales
-
Cost Amount
-
Net Sales
Additionally, the page contains four powerful charts:
-
Profit Margin % by Store Category
-
Gross Sales by Customer Type
-
Cost Amount by Region
-
Gross Sales by Month
As a result, users can immediately understand how the business performs across different dimensions.
Click to Purchases Duty-Free Retail Dashboard in Power BI
How Does the Store Category Analysis Page Help Retail Managers?
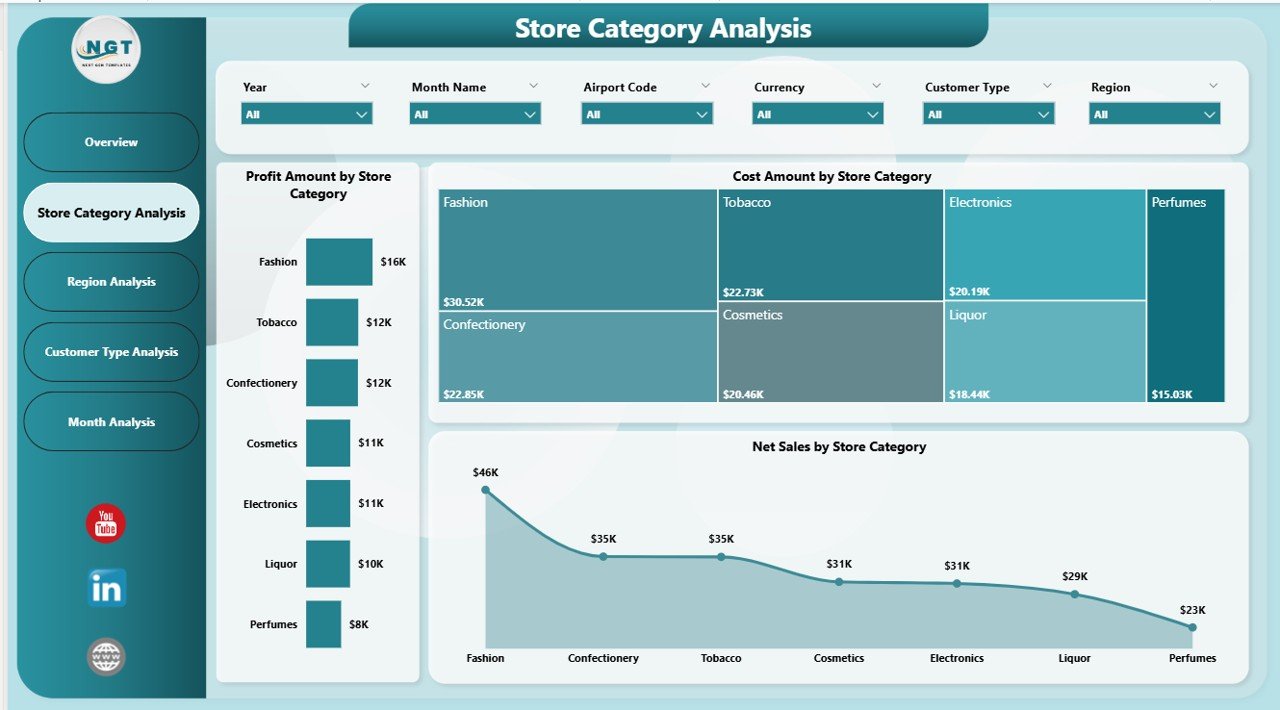
The Store Category Analysis Page focuses on performance comparison across different store categories.
Why Is Store Category Analysis Important?
Different store categories generate different profit margins. Therefore, understanding category-wise performance helps managers optimize inventory, pricing, and promotions.
Charts Included on the Store Category Analysis Page
This page includes three key visuals:
-
Profit Amount by Store Category
-
Cost Amount by Store Category
-
Net Sales by Store Category
Because of these visuals, managers can easily identify high-performing and underperforming categories. Consequently, they can focus on improving profitability.
What Insights Does the Region Analysis Page Provide?
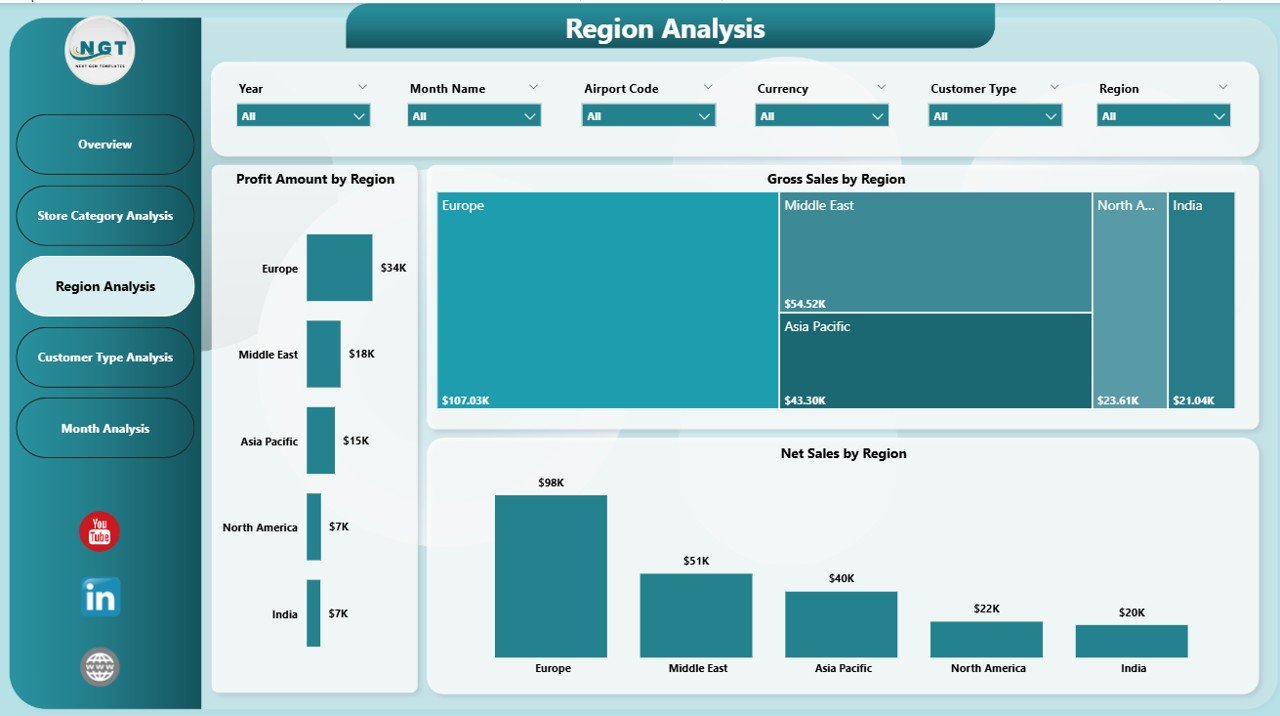
The Region Analysis Page evaluates retail performance across geographic regions.
Why Does Regional Analysis Matter?
Duty-free sales vary significantly by airport location and region. Therefore, analyzing region-wise performance helps allocate resources efficiently.
Charts Available on the Region Analysis Page
This page displays three important charts:
-
Profit Amount by Region
-
Gross Sales by Region
-
Net Sales by Region
As a result, managers can compare regions and identify growth opportunities quickly.
How Does the Customer Type Analysis Page Improve Business Strategy?
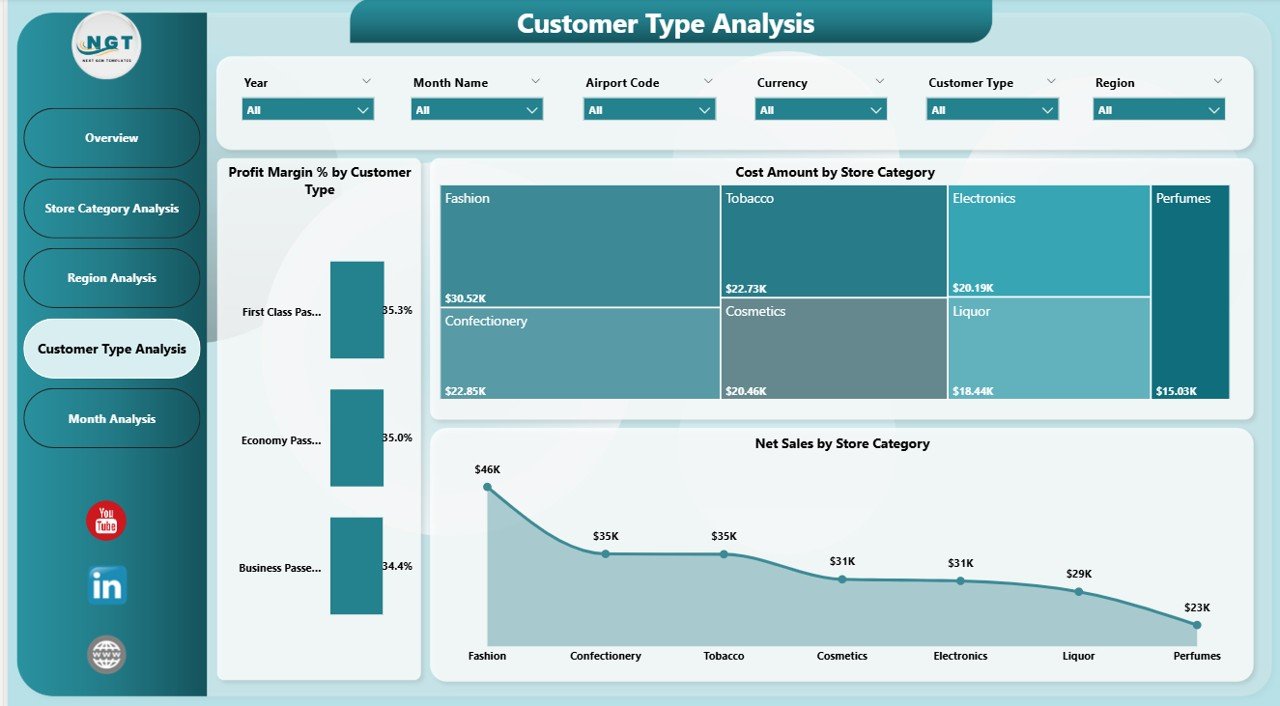
The Customer Type Analysis Page focuses on understanding customer behavior and spending patterns.
Why Should You Analyze Customer Types?
Different customer types behave differently. For example, international travelers, business travelers, and tourists show unique purchasing patterns. Therefore, customer analysis becomes critical for targeted marketing.
Visuals Included in Customer Type Analysis
This page includes three insightful charts:
-
Profit Margin % by Customer Type
-
Cost Amount by Customer Type
-
Net Sales by Customer Type
With these visuals, retailers can design better pricing, promotions, and loyalty programs.
What Does the Monthly Trends Page Reveal?
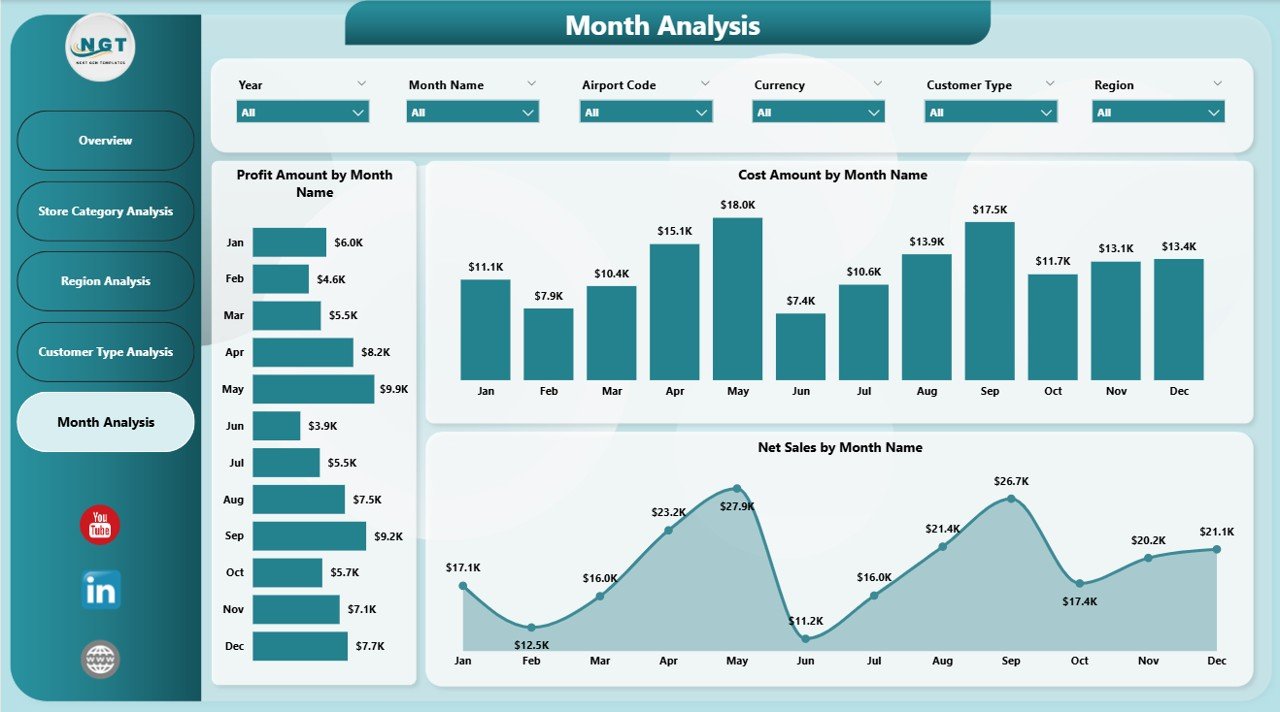
The Monthly Trends Page highlights time-based performance trends.
Why Are Monthly Trends Important?
Retail performance fluctuates due to seasonality, travel patterns, and promotions. Therefore, monthly analysis helps forecast demand and manage inventory.
Charts on the Monthly Trends Page
This page contains three essential visuals:
-
Profit Amount by Month
-
Cost Amount by Month
-
Net Sales by Month
Consequently, businesses can identify peak seasons and slow months easily.
Click to Purchases Duty-Free Retail Dashboard in Power BI
Advantages of Duty-Free Retail Dashboard in Power BI
A Duty-Free Retail Dashboard in Power BI offers numerous advantages for retail businesses.
1. Centralized Retail Performance Monitoring
This dashboard brings all key retail metrics into one place. Therefore, users no longer need multiple reports.
2. Faster and Smarter Decision-Making
Since Power BI updates visuals instantly, managers can take timely actions based on real-time data.
3. Improved Profitability Analysis
The dashboard clearly shows profit margins by category, region, and customer type. As a result, businesses can improve margins effectively.
4. Better Inventory and Cost Control
By tracking cost trends, managers can reduce wastage and control expenses.
5. Enhanced Customer Understanding
Customer type analysis helps businesses design personalized offers and increase sales.
6. Easy Data Refresh and Automation
Users only update the data source and refresh Power BI. Therefore, reporting becomes effortless.
Who Can Benefit from a Duty-Free Retail Dashboard in Power BI?
This dashboard benefits multiple stakeholders:
-
Duty-free store managers
-
Airport retail operations teams
-
Finance and accounting teams
-
Sales and marketing managers
-
Business owners and executives
Each user gains valuable insights tailored to their role.
How Does This Dashboard Improve Business Growth?
A Duty-Free Retail Dashboard in Power BI directly supports growth initiatives.
-
It highlights profitable categories
-
It identifies high-performing regions
-
It tracks customer preferences
-
It supports demand forecasting
-
It improves cost efficiency
As a result, businesses grow sustainably and competitively.
Best Practices for the Duty-Free Retail Dashboard in Power BI
Following best practices ensures maximum value from your dashboard.
1. Maintain Clean and Structured Data
Always keep data accurate and well-formatted. Clean data ensures reliable insights.
2. Use Consistent Naming Conventions
Consistent names help users understand visuals easily.
3. Update Data Regularly
Regular updates ensure that decisions rely on current information.
4. Focus on Business-Relevant KPIs
Avoid unnecessary visuals. Instead, focus on KPIs that drive decisions.
5. Use Slicers Effectively
Slicers allow users to filter data quickly. Therefore, design them carefully.
6. Train Users on Dashboard Navigation
Basic training improves adoption and usage across teams.
How Secure Is a Duty-Free Retail Dashboard in Power BI?
Power BI offers robust security features:
-
Role-based access control
-
Data-level security
-
Secure cloud storage
As a result, sensitive retail data remains protected.
Can This Dashboard Be Customized?
Yes, the Duty-Free Retail Dashboard in Power BI supports full customization.
-
Add new KPIs
-
Modify visuals
-
Include additional pages
-
Connect different data sources
Therefore, the dashboard grows with your business needs.
Conclusion: Why Should You Use a Duty-Free Retail Dashboard in Power BI?
A Duty-Free Retail Dashboard in Power BI transforms complex retail data into actionable insights. Instead of struggling with manual reports, businesses gain real-time visibility into sales, costs, profit margins, regions, categories, and customer behavior.
Moreover, this dashboard improves efficiency, profitability, and decision-making. Therefore, duty-free retailers who want to stay competitive should adopt this powerful analytics solution.
Frequently Asked Questions (FAQs)
What is a Duty-Free Retail Dashboard in Power BI?
A Duty-Free Retail Dashboard in Power BI is an interactive tool that visualizes sales, costs, profits, and trends for duty-free retail operations.
Who should use a Duty-Free Retail Dashboard?
Duty-free store managers, airport retailers, finance teams, and business leaders should use this dashboard.
Does this dashboard require advanced Power BI skills?
No, the dashboard remains user-friendly and easy to navigate.
Can I connect this dashboard to Excel?
Yes, Power BI easily connects to Excel data sources.
How often should I refresh the data?
You should refresh data daily or weekly based on business needs.
Can I customize the dashboard pages?
Yes, the dashboard supports full customization.
Visit our YouTube channel to learn step-by-step video tutorials