In today’s fast-changing business environment, data drives every important decision. However, many organizations still struggle to convert raw data into meaningful insights. As a result, managers waste time reviewing multiple Excel files, static reports, and delayed summaries. That is exactly where a Business Intelligence KPI Dashboard in Excel becomes a powerful and practical solution.
A Business Intelligence KPI Dashboard in Excel helps organizations track, anBusiness Intelligence (BI) KPI Dashboard in Excelalyze, and visualize key performance indicators in one centralized place. Instead of working with scattered sheets, decision-makers gain instant clarity. Moreover, Excel remains familiar, flexible, and easy to maintain. Therefore, businesses of all sizes prefer Excel-based KPI dashboards for performance monitoring.Business Intelligence (BI) KPI Dashboard in Excel
In this detailed guide, you will learn everything about the Business Intelligence (BI) KPI Dashboard in Excel, including how it works, its worksheet-wise structure, advantages, best practices, and frequently asked questions. Throughout this article, the language remains simple, actionable, and business-friendly so you can implement it easily.
Click to buy Business Intelligence (BI) KPI Dashboard in Excel
What Is a Business Intelligence KPI Dashboard in Excel?
A Business Intelligence(BI) KPI Dashboard in Excel is a ready-to-use analytical template designed to monitor, compare, and evaluate key business metrics. It converts raw operational data into meaningful visuals such as KPI tables, trend charts, and performance indicators.Business Intelligence (BI) KPI Dashboard in Excel
Instead of checking different reports, you can analyze MTD (Month-to-Date) and YTD (Year-to-Date) performance from a single dashboard. Additionally, the dashboard compares Actual, Target, and Previous Year values. As a result, managers identify trends, gaps, and opportunities quickly.
Most importantly, this dashboard does not require advanced technical skills. Since it runs completely in Excel, anyone with basic Excel knowledge can use it confidently.Business Intelligence (BI) KPI Dashboard in Excel
Why Do Businesses Need a Business Intelligence KPI Dashboard in Excel?
Every business generates data daily. However, data alone does not create value. You need structure, context, and comparison. Therefore, a Business Intelligence KPI Dashboard in Excel plays a critical role.
Here is why businesses rely on it:
- It provides a single source of truth
- It saves time by automating calculations
- It improves visibility across departments
- It supports faster and better decisions
- It eliminates manual reporting errors
Moreover, Excel dashboards remain cost-effective. Therefore, startups, SMEs, and enterprises all benefit from using Excel-based KPI dashboards.Business Intelligence (BI) KPI Dashboard in Excel
How Does a Business Intelligence KPI Dashboard in Excel Work?
The dashboard works by separating data input, definitions, and visual analysis into structured worksheets. You enter data once, and Excel calculates everything automatically.
Here is the simple workflow:
- Enter actual numbers
- Enter target values
- Enter previous year data
- Define KPIs
- Select month or KPI
- Review performance instantly
Because of this structured approach, the dashboard stays clean, flexible, and scalable.
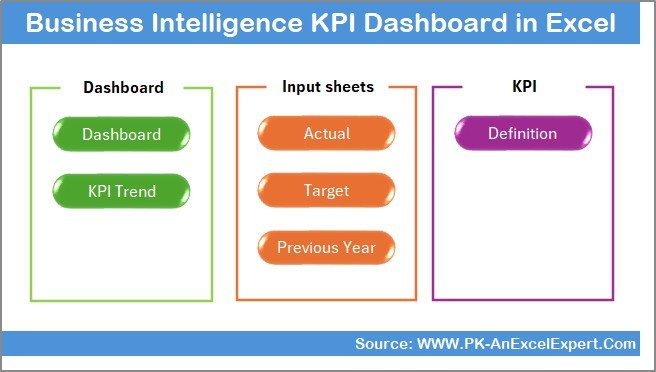
Worksheet-Wise Structure of the Business Intelligence KPI Dashboard in Excel
This Business Intelligence KPI Dashboard in Excel contains 7 well-organized worksheets. Each worksheet plays a specific role in performance tracking.
Let us explore each sheet in detail.
Summary Page – How Does the Index Sheet Improve Navigation?
The Summary Page acts as an index or home page for the entire dashboard. This sheet improves usability and navigation.
Key Highlights of the Summary Page
- It contains 6 navigation buttons
- Each button jumps to a specific worksheet
- It eliminates unnecessary scrolling
- It improves user experience
Because of this design, even first-time users can navigate the dashboard smoothly.
Click to buy Business Intelligence (BI) KPI Dashboard in Excel
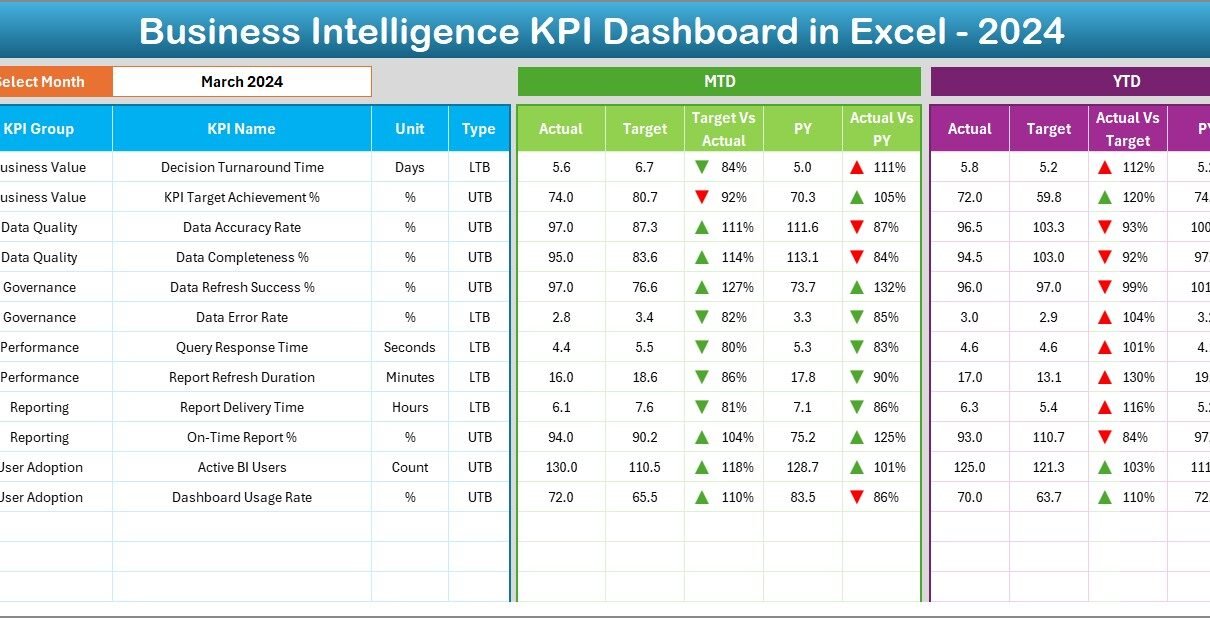
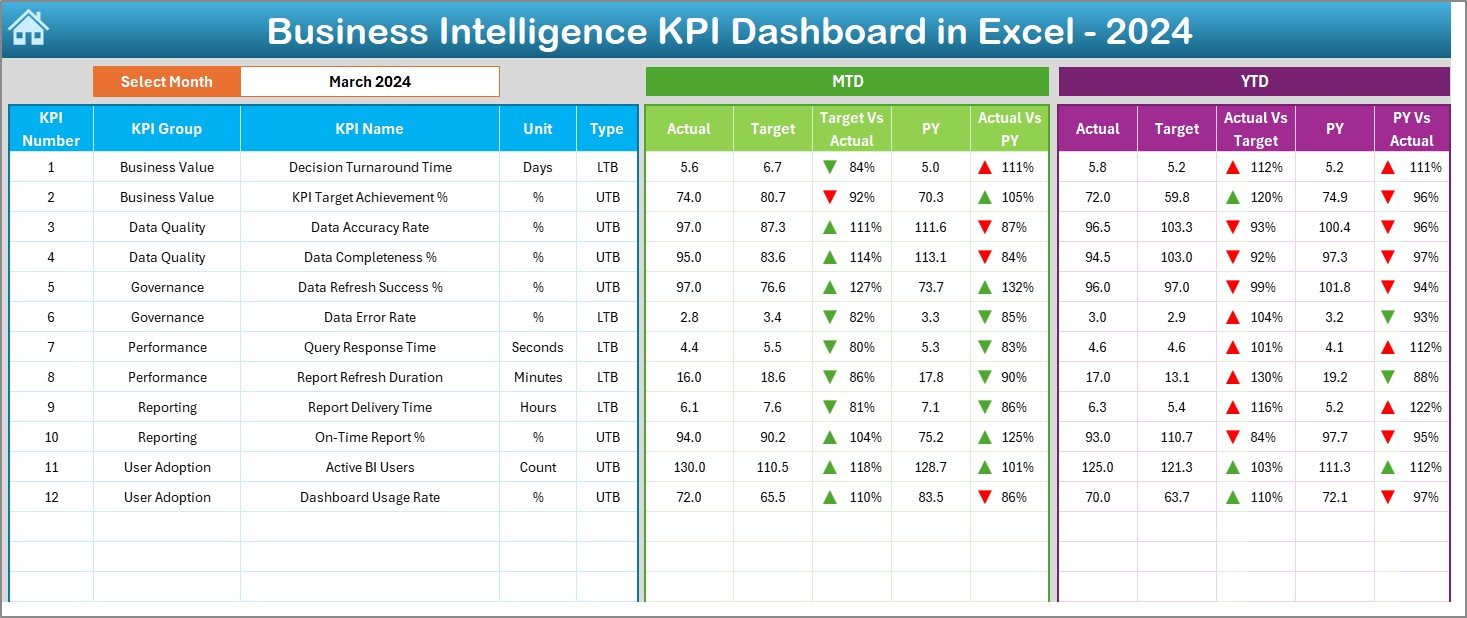
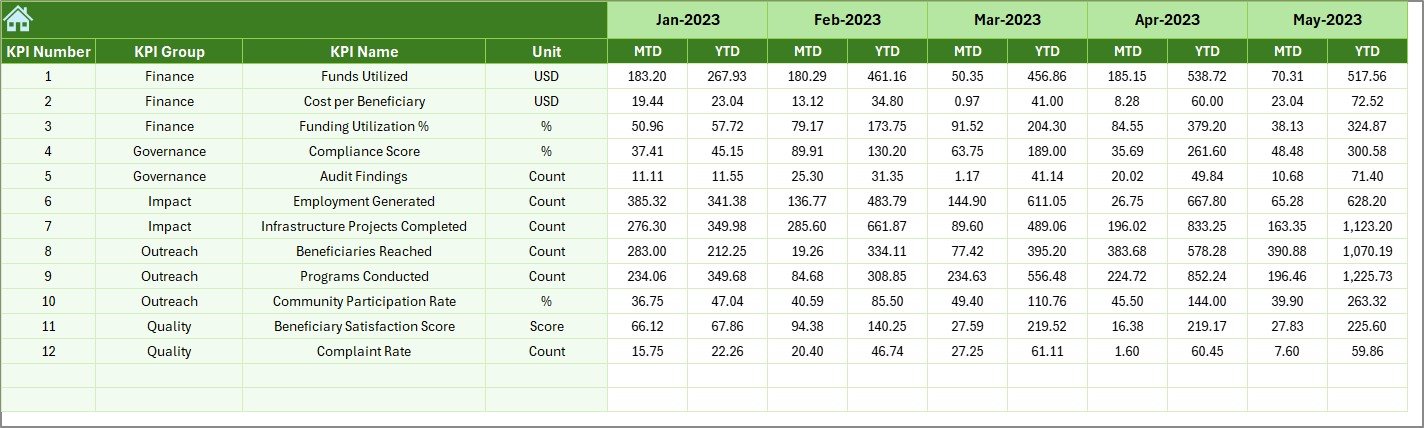
Dashboard Sheet – What Information Does the Main KPI Dashboard Show?
The Dashboard Sheet serves as the core of the Business Intelligence KPI Dashboard in Excel. It displays all KPIs and performance indicators in one view.
Month Selection Feature
- You select the month from cell D3
- The entire dashboard updates instantly
- All calculations adjust automatically
KPI Performance Details Displayed
This sheet shows:
- KPI Number
- KPI Group
- KPI Name
- Unit of Measurement
- KPI Type (LTB or UTB)
MTD Performance Analysis
For each KPI, the dashboard displays:
- MTD Actual
- MTD Target
- MTD Previous Year
- Target vs Actual (with arrows)
- Previous Year vs Actual (with arrows)
YTD Performance Analysis
Similarly, it shows:
- YTD Actual
- YTD Target
- YTD Previous Year
- Target vs Actual comparison
- Previous Year vs Actual comparison
The conditional formatting arrows instantly highlight whether performance improves or declines. Therefore, users identify problem areas quickly.
Click to buy Business Intelligence (BI) KPI Dashboard in Excel
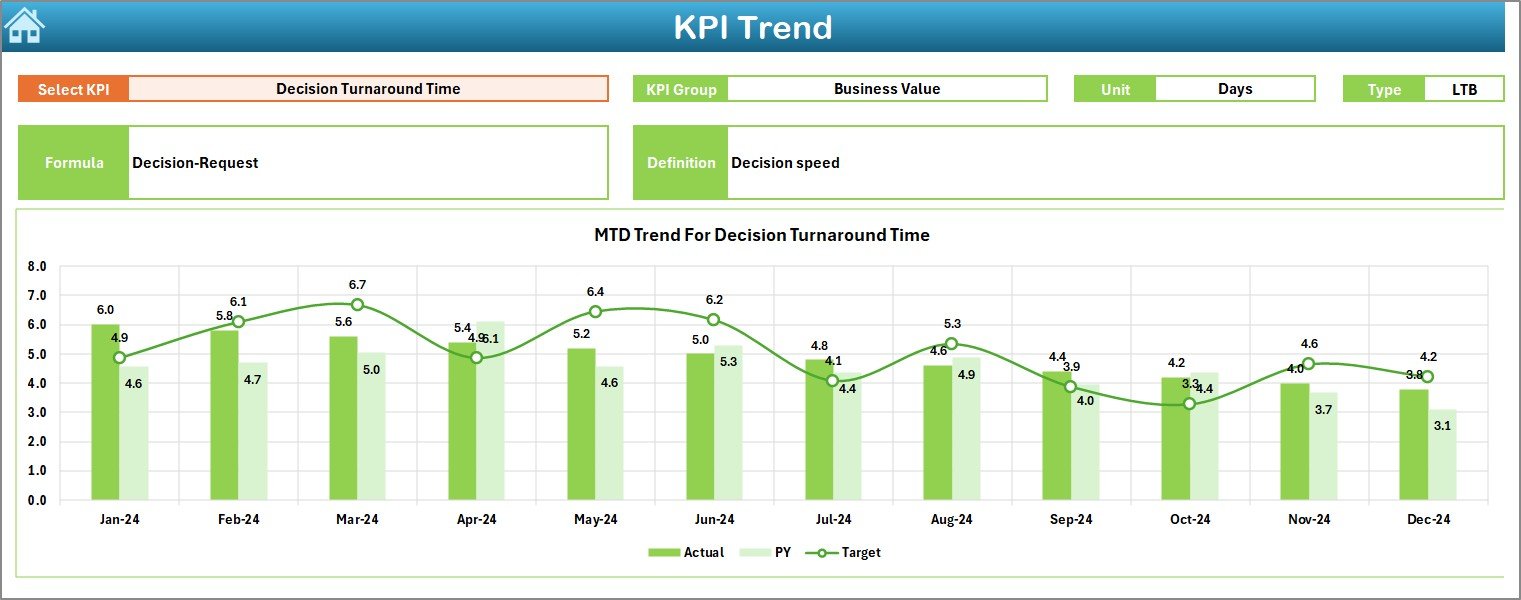
Trend Sheet – How Can You Analyze KPI Trends Over Time?
The Trend Sheet focuses on in-depth KPI analysis. It allows you to study individual KPIs across time.
KPI Selection
- Select KPI name from cell C3
- All related details update automatically
KPI Information Displayed
This sheet shows:
- KPI Group
- Unit of KPI
- KPI Type (Lower the Better or Upper the Better)
- KPI Formula
- KPI Definition
Trend Charts
The sheet displays:
- MTD Trend Chart (Actual, Target, PY)
- YTD Trend Chart (Actual, Target, PY)
Because of these charts, users clearly see performance movement over months.
Click to buy Business Intelligence (BI) KPI Dashboard in Excel
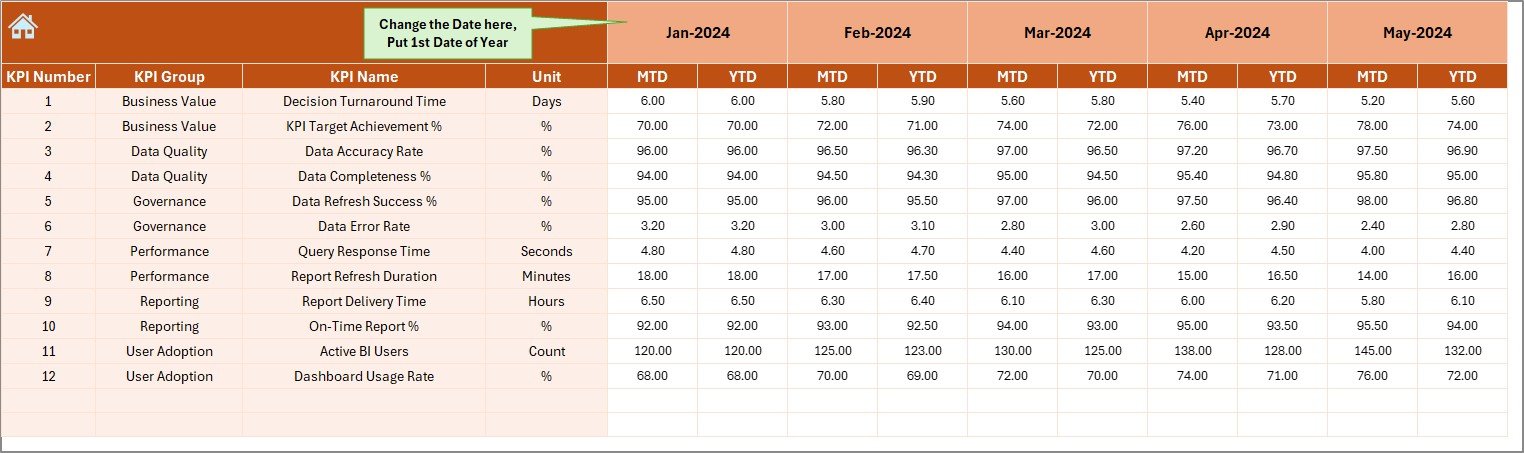
Actual Numbers Input Sheet – Where Do You Enter Actual KPI Data?
The Actual Numbers Input Sheet handles all current year data entry.
Key Features
- Enter MTD and YTD actual numbers
- Change the starting month from cell E1
- Maintain a clean data structure
Since data input remains separate, the dashboard stays error-free and reliable.
Click to buy Business Intelligence (BI) KPI Dashboard in Excel
Target Sheet – How Do You Set KPI Targets Effectively?
The Target Sheet stores target values for each KPI.
What You Enter Here
- Monthly MTD target values
- Monthly YTD target values
By separating targets from actual data, the dashboard ensures accurate comparisons.
Click to buy Business Intelligence (BI) KPI Dashboard in Excel
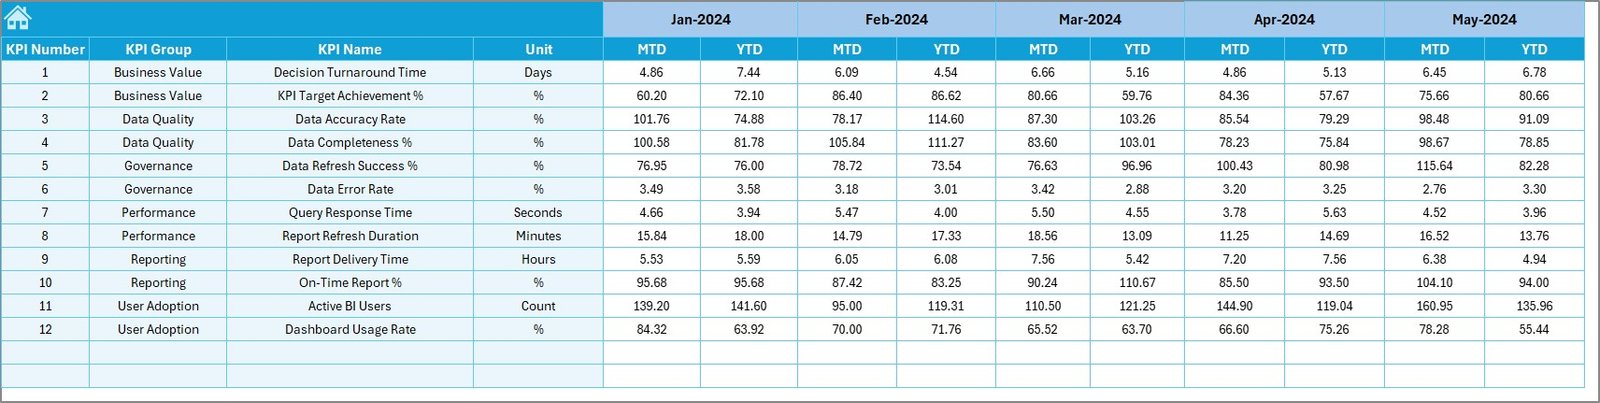
Previous Year Number Sheet – Why Is Historical Comparison Important?
The Previous Year Number Sheet captures historical KPI values.
Benefits of This Sheet
- Enables year-over-year comparison
- Highlights long-term growth trends
- Supports strategic planning
You enter values exactly as you did for the current year.
Click to buy Business Intelligence (BI) KPI Dashboard in Excel
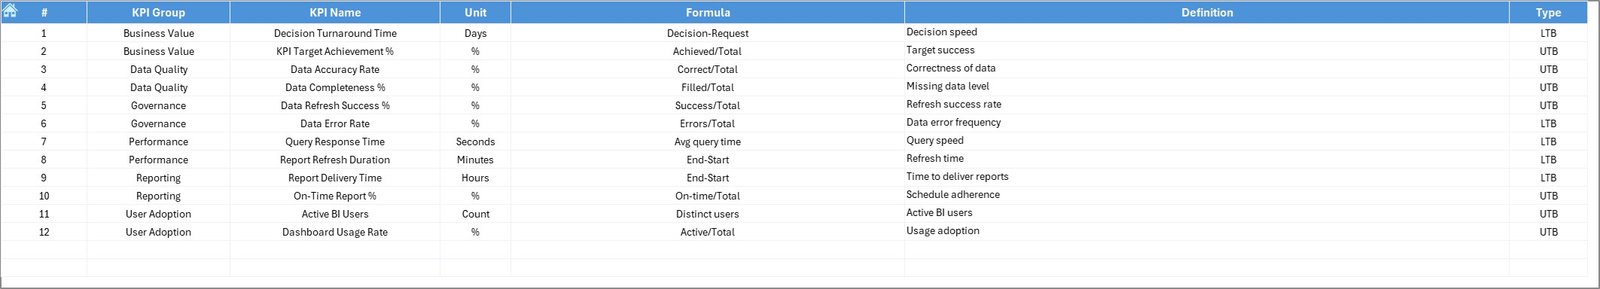
KPI Definition Sheet – How Do KPI Definitions Improve Clarity?
The KPI Definition Sheet documents every KPI clearly.
Information Stored
- KPI Name
- KPI Group
- Unit
- Formula
- KPI Definition
Because of this sheet, all users understand KPIs consistently. Therefore, misinterpretation never occurs.
Click to buy Business Intelligence (BI) KPI Dashboard in Excel
Advantages of Business Intelligence KPI Dashboard in Excel
A Business Intelligence KPI Dashboard in Excel delivers several powerful advantages.
- Centralized Performance Monitoring
You track all KPIs in one place. Therefore, decision-making becomes faster.
- Easy Customization
You can add or modify KPIs without technical complexity.
- Cost-Effective Solution
Excel eliminates expensive BI software costs.
- Improved Data Accuracy
Automated calculations reduce human errors.
- Better Strategic Planning
Trend analysis supports long-term planning.
- User-Friendly Design
Anyone can use the dashboard without advanced training.
Best Practices for the Business Intelligence KPI Dashboard in Excel
To get maximum value, follow these best practices.
- Define KPIs Clearly
Always write clear KPI definitions. As a result, everyone understands the metrics.
- Separate Data and Analysis
Keep input sheets separate from dashboard views.
- Use Consistent Units
Maintain uniform measurement units across KPIs.
- Update Data Regularly
Regular updates ensure accurate insights.
- Use Conditional Formatting Wisely
Visual cues improve decision-making speed.
- Limit KPI Count
Focus on meaningful KPIs instead of tracking too many metrics.
How Can Different Teams Use This Dashboard?
A Business Intelligence KPI Dashboard in Excel supports multiple teams.
Management Team
- Track overall performance
- Review strategic goals
- Monitor growth trends
Operations Team
- Analyze process efficiency
- Identify bottlenecks
- Improve productivity
Finance Team
- Track cost, revenue, and margins
- Compare targets vs actuals
- Improve budgeting accuracy
Sales and Marketing Teams
- Monitor sales KPIs
- Track conversion rates
- Measure campaign effectiveness
Why Choose Excel for Business Intelligence Dashboards?
Excel remains one of the most powerful BI tools because:
- It offers flexibility
- It supports automation
- It integrates with Power BI
- It requires minimal learning
Therefore, Excel dashboards remain relevant even in advanced analytics environments.
Conclusion: Is a Business Intelligence KPI Dashboard in Excel Worth Using?
A Business Intelligence KPI Dashboard in Excel transforms raw data into actionable insights. It simplifies performance tracking, improves visibility, and supports confident decision-making. Moreover, its structured design, flexible setup, and low cost make it ideal for any organization.
By using this dashboard, businesses move from reactive reporting to proactive management. Therefore, it becomes an essential tool for data-driven success.
Frequently Asked Questions (FAQs)
What Is the Purpose of a Business Intelligence KPI Dashboard in Excel?
The dashboard helps track, compare, and analyze KPIs in one centralized view for better decisions.
Can Beginners Use a Business Intelligence KPI Dashboard in Excel?
Yes, the dashboard uses simple Excel features. Therefore, beginners can use it easily.
How Often Should KPI Data Be Updated?
You should update data monthly or weekly depending on business needs.
Can I Add New KPIs to the Dashboard?
Yes, you can add KPIs by updating the definition and input sheets.
Does This Dashboard Support Year-Over-Year Comparison?
Yes, it includes previous year data for comparison.
Is Excel Enough for Business Intelligence Reporting?
Yes, Excel provides strong analytical capabilities for most business needs.
Visit our YouTube channel to learn step-by-step video tutorials
Watch the step-by-step video tutorial:
Click to buy Business Intelligence (BI) KPI Dashboard in Excel