In today’s highly regulated and competitive pharmaceutical industry, tracking performance accurately is no longer optional. Companies must monitor sales, production, quality, compliance, inventory, and financial metrics every single month. However, many pharmaceutical organizations still depend on scattered Excel sheets, manual reports, and delayed summaries. As a result, decision-makers lose visibility, accuracy, and time.
That is exactly why a Pharmaceutical KPI Dashboard in Excel becomes an essential management tool.
In this detailed, SEO-friendly guide, you will learn everything about the Pharmaceutical KPI Dashboard in Excel, including how it works, its worksheet-wise structure, key benefits, advantages, best practices, and common questions. Moreover, the language remains simple, practical, and business-focused so that anyone can use it confidently without technical complexity.
Click to Purchases Pharmaceutical KPI Dashboard in Excel
What Is a Pharmaceutical KPI Dashboard in Excel?
A Pharmaceutical KPI Dashboard in Excel is a ready-to-use performance tracking template designed to monitor key performance indicators (KPIs) across pharmaceutical operations. Instead of reviewing multiple reports, managers can view MTD (Month-to-Date) and YTD (Year-to-Date) performance from one centralized dashboard.
Moreover, this dashboard compares Actual vs Target and Actual vs Previous Year (PY) values. Therefore, teams can quickly identify trends, gaps, and improvement areas. Since the dashboard works entirely in Excel, it remains flexible, cost-effective, and easy to maintain.
Why Do Pharmaceutical Companies Need a KPI Dashboard in Excel?
Pharmaceutical businesses operate in a complex environment that includes regulatory compliance, strict quality standards, production planning, and sales performance. Because of this complexity, tracking KPIs manually often leads to errors and delays.
A Pharmaceutical KPI Dashboard in Excel solves these challenges because:
-
It centralizes all KPIs in one place
-
It provides real-time MTD and YTD visibility
-
It highlights performance gaps instantly
-
It improves data-driven decision-making
-
It reduces dependency on manual reporting
As a result, management teams gain clarity, speed, and control.
What Are the Key Features of the Pharmaceutical KPI Dashboard in Excel?
This Pharmaceutical KPI Dashboard in Excel comes as a ready-to-use template with a structured layout. It contains 7 well-designed worksheets, each serving a specific purpose. Let us explore them one by one.
1. What Is the Purpose of the Home Sheet?
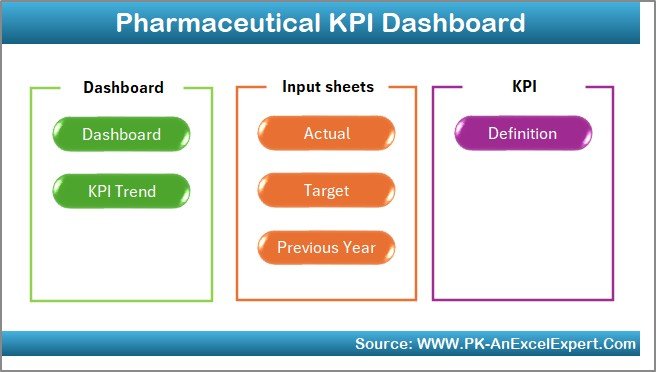
The Home Sheet acts as an index or navigation page for the entire dashboard.
Key Highlights of the Home Sheet
-
It contains 6 navigation buttons
-
Each button redirects users to a specific worksheet
-
It improves usability and navigation
-
It creates a professional dashboard experience
Because of this sheet, users can move between sections without scrolling through Excel tabs.
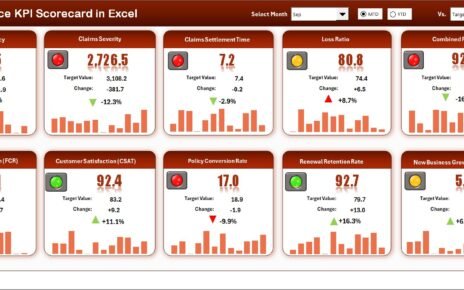
2. How Does the Dashboard Sheet Work?
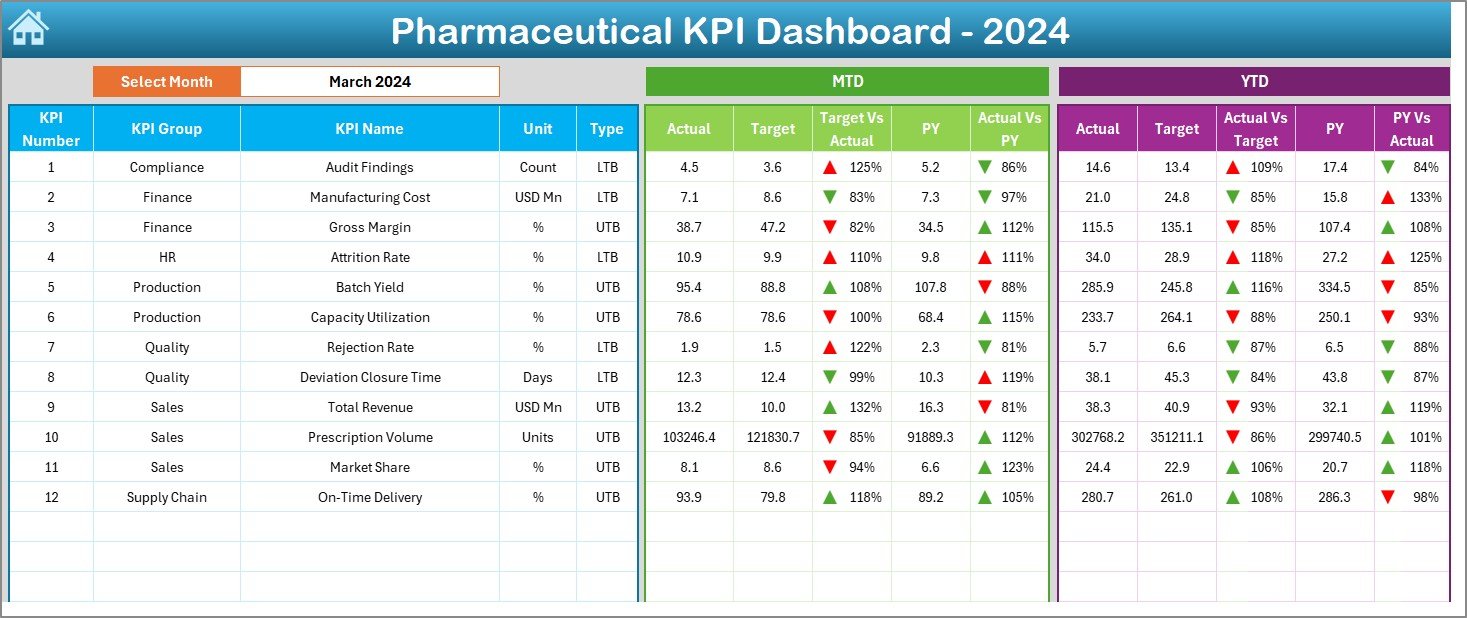
The Dashboard Sheet is the core of the Pharmaceutical KPI Dashboard in Excel. This sheet displays a complete performance snapshot for all KPIs.
Key Features of the Dashboard Sheet
-
Month selection dropdown available at Cell D3
-
Automatic update of all KPI values based on the selected month
-
Display of MTD Actual, Target, and Previous Year values
-
Display of YTD Actual, Target, and Previous Year values
-
Conditional formatting with up and down arrows
-
Clear visibility of Target vs Actual and PY vs Actual
Because of these features, users can quickly understand whether performance is improving or declining.
Click to Purchases Pharmaceutical KPI Dashboard in Excel
3. How Does the KPI Trend Sheet Help in Analysis?
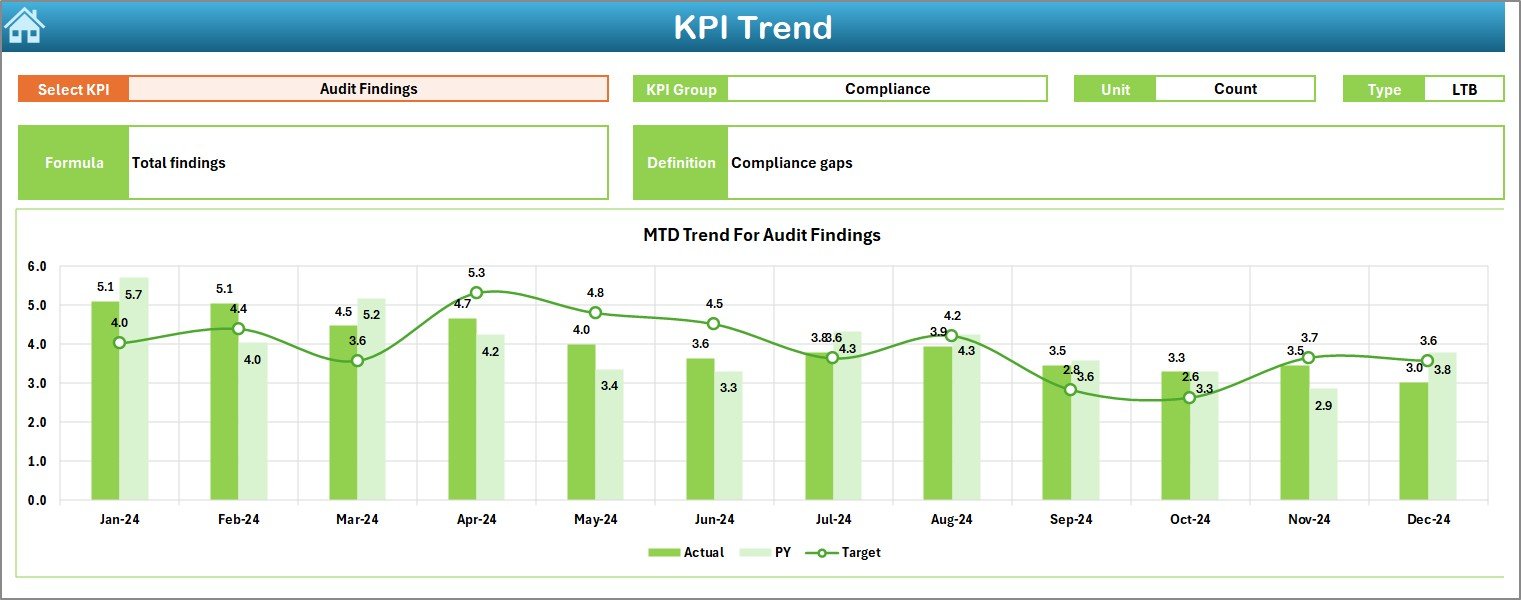
The KPI Trend Sheet focuses on individual KPI-level analysis.
Key Highlights of the KPI Trend Sheet
-
KPI selection dropdown available at Cell C3
-
Displays:
-
KPI Group
-
KPI Unit
-
KPI Type (Lower the Better or Upper the Better)
-
KPI Formula
-
KPI Definition
-
-
Shows MTD and YTD trend charts
-
Compares Actual, Target, and Previous Year values
Therefore, this sheet helps managers analyze trends over time and take corrective actions early.
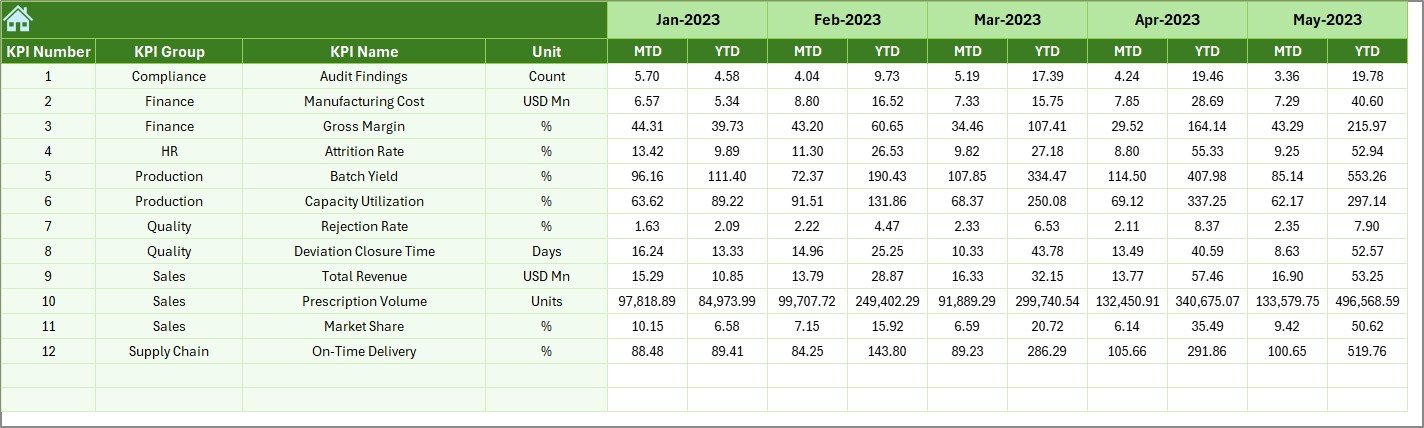
4. What Is the Role of the Actual Numbers Input Sheet?

The Actual Numbers Input Sheet is where users enter current-year performance data.
How This Sheet Works
-
Users enter MTD and YTD actual values
-
Month selection available at Cell E1
-
Users input the first month of the year at E1
-
All calculations update automatically
Because of this structured input, data entry becomes easy, consistent, and error-free.
5. Why Is the Target Sheet Important?

The Target Sheet stores planned KPI values for the year.
Key Features of the Target Sheet
-
Entry of MTD Target values
-
Entry of YTD Target values
-
KPI-wise target planning
-
Direct comparison with actual performance
As a result, management teams can track whether teams meet their goals or not.
Click to Purchases Pharmaceutical KPI Dashboard in Excel
6. How Does the Previous Year Number Sheet Support Comparison?
The Previous Year Number Sheet stores last year’s KPI values.
Why This Sheet Matters
-
Enables year-over-year comparison
-
Highlights performance improvement or decline
-
Helps in trend analysis
-
Supports strategic planning
Because of this sheet, the dashboard offers deeper historical insights.
7. What Is the Purpose of the KPI Definition Sheet?

The KPI Definition Sheet acts as a reference guide.
Information Captured in This Sheet
-
KPI Name
-
KPI Group
-
Unit of Measurement
-
Formula
-
KPI Definition
Therefore, even new users can understand KPIs without confusion.
Which KPIs Can You Track Using a Pharmaceutical KPI Dashboard in Excel?
You can customize this dashboard to track various pharmaceutical KPIs, such as:
-
Sales Growth %
-
Production Yield %
-
Inventory Turnover
-
Batch Rejection Rate
-
On-Time Delivery %
-
Quality Compliance %
-
Cost per Unit
-
Regulatory Audit Findings
-
Customer Complaint Rate
-
R&D Efficiency
Because the dashboard remains flexible, you can add or modify KPIs easily.
Advantages of Pharmaceutical KPI Dashboard in Excel
Using a Pharmaceutical KPI Dashboard in Excel delivers multiple business advantages.
Key Advantages
-
✅ Centralized KPI tracking
-
✅ Easy-to-use Excel interface
-
✅ No additional software cost
-
✅ Clear MTD and YTD visibility
-
✅ Faster decision-making
-
✅ Improved accountability
-
✅ Customizable and scalable
As a result, pharmaceutical organizations improve performance transparency and operational control.
How Does a Pharmaceutical KPI Dashboard Improve Decision-Making?
A Pharmaceutical KPI Dashboard in Excel improves decisions because:
-
It shows real-time performance status
-
It highlights deviations instantly
-
It simplifies complex data
-
It enables proactive actions
-
It supports management reviews
Therefore, leadership teams can act faster and smarter.
Best Practices for the Pharmaceutical KPI Dashboard in Excel
To get maximum value from your dashboard, follow these best practices.
Best Practices You Should Follow
-
✔ Define KPIs clearly before implementation
-
✔ Update actual numbers regularly
-
✔ Validate data accuracy every month
-
✔ Keep KPI definitions simple and consistent
-
✔ Review dashboard in monthly meetings
-
✔ Use color coding carefully
-
✔ Avoid overcrowding the dashboard
By following these practices, your dashboard will remain reliable and effective.
How Often Should You Update the Pharmaceutical KPI Dashboard?
Click to Purchases Pharmaceutical KPI Dashboard in Excel
You should update the dashboard:
-
Monthly for strategic KPIs
-
Weekly for operational KPIs (if required)
-
Immediately after closing monthly data
Consistent updates ensure accurate insights.
Who Can Use a Pharmaceutical KPI Dashboard in Excel?
This dashboard suits multiple roles, such as:
-
Pharmaceutical managers
-
Operations teams
-
Quality assurance teams
-
Sales leaders
-
Finance teams
-
Senior executives
Because of its simplicity, both technical and non-technical users can use it easily.
Conclusion: Why You Should Use a Pharmaceutical KPI Dashboard in Excel
A Pharmaceutical KPI Dashboard in Excel transforms raw data into actionable insights. Instead of spending hours on manual reports, teams gain instant visibility into performance. Moreover, the structured worksheet design, MTD and YTD analysis, and trend charts support better planning and faster decisions.
If you want clarity, control, and confidence in pharmaceutical performance tracking, this dashboard becomes the perfect solution.
Frequently Asked Questions (FAQs)
What is a Pharmaceutical KPI Dashboard in Excel?
A Pharmaceutical KPI Dashboard in Excel is a performance tracking tool that monitors key pharmaceutical metrics using Excel-based visuals, tables, and charts.
Can I customize the Pharmaceutical KPI Dashboard in Excel?
Yes, you can easily customize KPIs, targets, formulas, and formats according to your business needs.
Do I need advanced Excel skills to use this dashboard?
No, basic Excel knowledge is enough to use and maintain this dashboard effectively.
Does the dashboard support MTD and YTD analysis?
Yes, the dashboard displays both Month-to-Date and Year-to-Date values for actual, target, and previous year data.
Is the Pharmaceutical KPI Dashboard suitable for small pharma companies?
Yes, this dashboard works well for small, medium, and large pharmaceutical organizations.
How does the dashboard compare actual performance with targets?
The dashboard uses automated calculations and conditional formatting to show Target vs Actual differences clearly.
Visit our YouTube channel to learn step-by-step video tutorials