In today’s highly regulated and competitive pharmaceutical industry, tracking performance accurately and consistently matters more than ever. However, many pharmaceutical companies still depend on scattered Excel sheets, manual reports, and delayed summaries. As a result, decision-makers struggle to gain real-time insights. Moreover, teams waste valuable time compiling data instead of analyzing it.
That is exactly where a Pharmaceutical KPI Dashboard in Power BI becomes a powerful and practical solution.
This detailed, SEO-friendly guide explains everything you need to know about a Pharmaceutical KPI Dashboard in Power BI. Throughout this article, you will learn what it is, why it matters, how it works, its page-wise structure, advantages, best practices, and frequently asked questions. Additionally, the language remains simple, clear, and business-focused so you can apply it easily without technical complexity.
Click to Purchases Pharmaceutical KPI Dashboard in Power BI
What Is a Pharmaceutical KPI Dashboard in Power BI?
A Pharmaceutical KPI Dashboard in Power BI is a ready-to-use analytical and reporting solution that tracks key performance indicators (KPIs) across pharmaceutical operations. Instead of reviewing multiple reports, managers view MTD (Month-to-Date), YTD (Year-to-Date), target, and previous-year comparisons from one centralized dashboard.
Moreover, this dashboard captures data in an Excel file and connects it directly to Power BI. Therefore, you only need to update Excel and refresh Power BI. As a result, reporting becomes faster, accurate, and reliable.
Most importantly, this dashboard helps pharmaceutical companies monitor sales performance, production efficiency, quality compliance, and operational effectiveness in one place.
Why Do Pharmaceutical Companies Need a KPI Dashboard in Power BI?
Pharmaceutical organizations operate in a complex environment with strict regulations, high competition, and narrow margins. Therefore, they must monitor performance continuously.
Here is why a Pharmaceutical KPI Dashboard in Power BI becomes essential:
-
It provides real-time visibility into key metrics
-
It reduces dependency on manual reporting
-
It improves decision-making speed
-
It ensures data accuracy and consistency
-
It supports regulatory and compliance monitoring
Moreover, Power BI offers interactive visuals, slicers, and drill-down features. As a result, managers can analyze data deeply without technical expertise.
How Does a Pharmaceutical KPI Dashboard in Power BI Work?
The working model of a Pharmaceutical KPI Dashboard in Power BI remains simple and effective.
-
First, users enter or update data in an Excel data file
-
Then, Power BI connects to the Excel file as a data source
-
Next, users refresh the Power BI report
-
Finally, all KPIs update automatically across the dashboard
Because of this structure, organizations maintain flexibility. At the same time, they ensure centralized reporting.
What Are the Key Features of a Pharmaceutical KPI Dashboard in Power BI?
A Pharmaceutical KPI Dashboard in Power BI includes several powerful features designed for clarity and control.
Key Highlights of the Dashboard
-
Excel-based data source for easy updates
-
Power BI interactive visuals
-
Month and KPI Group slicers
-
MTD and YTD performance tracking
-
Target vs Actual and CY vs PY comparisons
-
Visual status indicators using icons
-
Clear KPI categorization and grouping
Together, these features create a single source of truth for pharmaceutical performance management.
What Pages Are Included in the Pharmaceutical KPI Dashboard in Power BI?
This ready-to-use dashboard includes three structured pages in the Power BI Desktop file. Each page serves a specific purpose and improves analysis.
Click to Purchases Pharmaceutical KPI Dashboard in Power BI
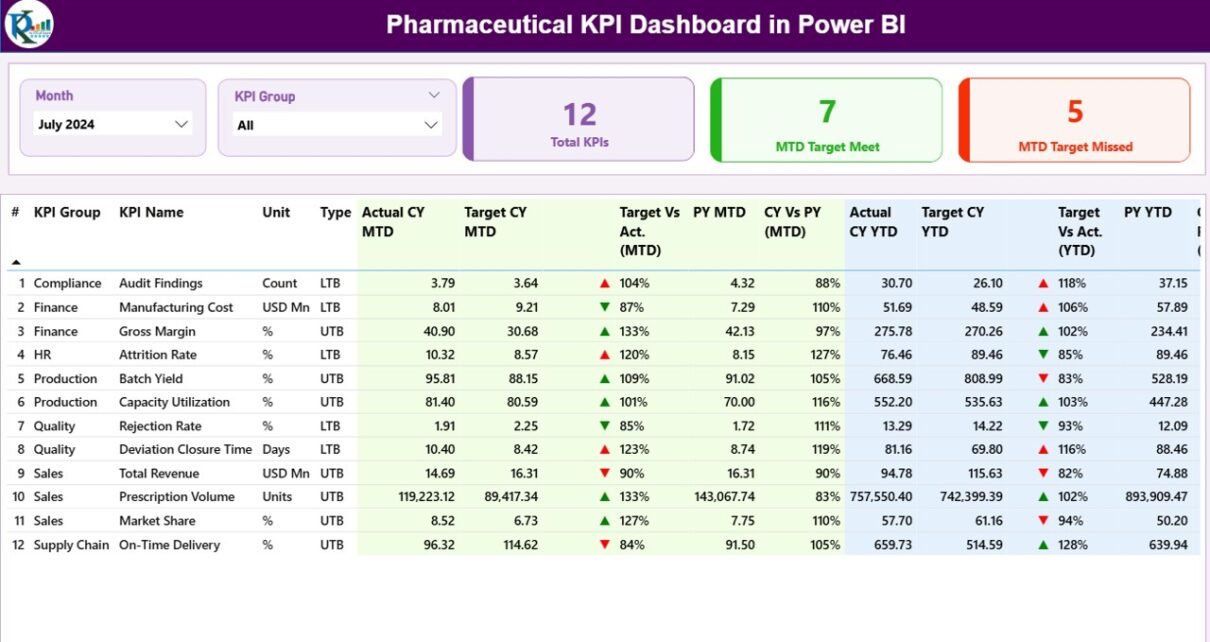
What Is the Summary Page in the Pharmaceutical KPI Dashboard?
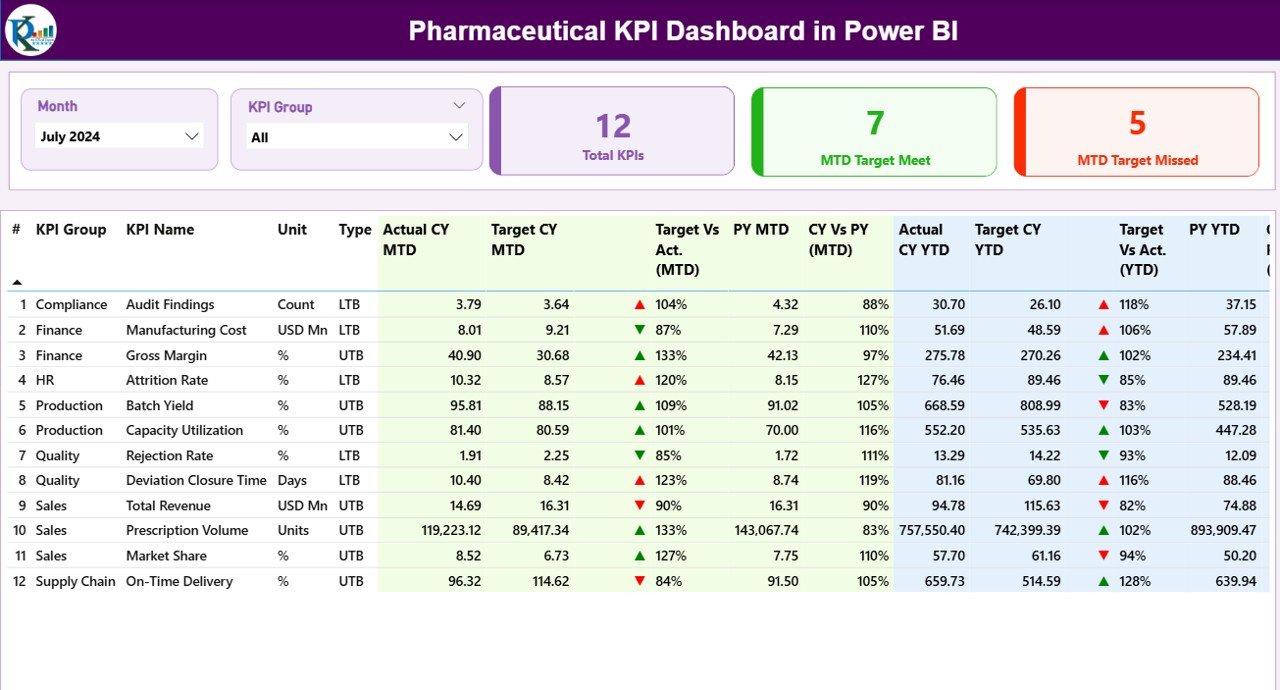
The Summary Page acts as the central control panel of the dashboard. It provides a complete snapshot of all KPIs at once.
Key Elements of the Summary Page
Slicers for Dynamic Analysis
-
Month Slicer to select the reporting month
-
KPI Group Slicer to filter KPIs by category
Because of these slicers, users can analyze performance quickly and interactively.
KPI Cards for Quick Insights
At the top of the page, the dashboard shows three KPI cards:
-
Total KPIs Count
-
MTD Target Meet Count
-
MTD Target Missed Count
These cards instantly highlight overall performance status.
What Information Does the Detailed KPI Table Show?
Below the KPI cards, the Summary Page displays a detailed KPI table. This table provides in-depth information for each KPI.
Columns Included in the KPI Table
-
KPI Number: Sequence number of the KPI
-
KPI Group: Category or functional group of the KPI
-
KPI Name: Name of the KPI
-
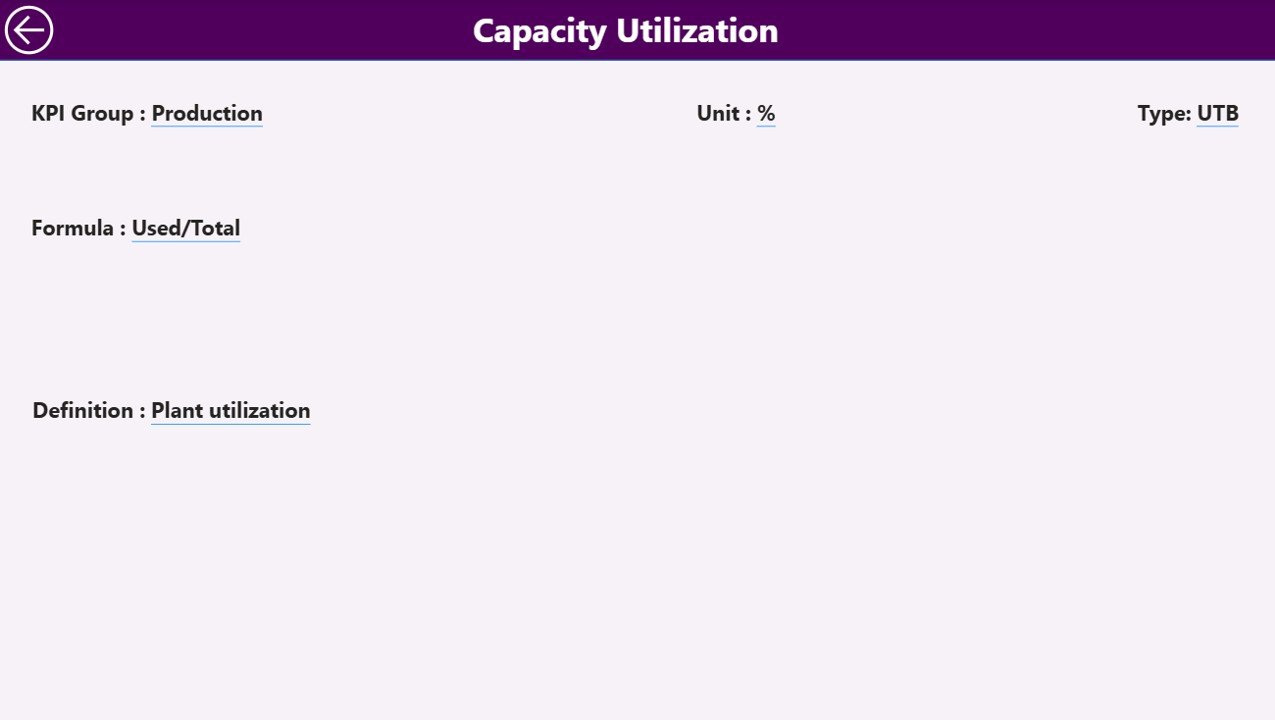
Unit: Unit of measurement
-
Type: KPI type such as LTB (Lower the Better) or UTB (Upper the Better)
These columns help users understand KPI context clearly.
How Does the Dashboard Track MTD Performance?
The dashboard tracks Month-to-Date (MTD) performance using multiple columns.
MTD Performance Columns Explained
-
Actual CY MTD: Current Year actual MTD value
-
Target CY MTD: Current Year target MTD value
-
MTD Icon: ▲ or ▼ icon with green or red color to show target status
-
Target vs Actual (MTD): Percentage calculation using Actual / Target
-
PY MTD: Previous Year MTD value
-
CY vs PY (MTD): Percentage comparison of CY MTD vs PY MTD
Because of these metrics, managers immediately identify underperforming KPIs.
How Does the Dashboard Track YTD Performance?
Click to Purchases Pharmaceutical KPI Dashboard in Power BI
In addition to MTD analysis, the dashboard provides Year-to-Date (YTD) tracking.
YTD Performance Columns Explained
-
Actual CY YTD: Current Year actual YTD value
-
Target CY YTD: Current Year target YTD value
This structure allows users to monitor long-term performance trends easily.
How Do Visual Indicators Improve KPI Analysis?
Visual indicators play a major role in this dashboard.
-
Green ▲ icons highlight positive performance
-
Red ▼ icons highlight negative performance
-
Percentage values show performance gaps clearly
As a result, users understand KPI status without reading complex numbers.
Advantages of Pharmaceutical KPI Dashboard in Power BI
A Pharmaceutical KPI Dashboard in Power BI offers multiple advantages for pharma organizations of all sizes.
Key Advantages Explained
-
Centralized Reporting
All KPIs appear in one dashboard, which eliminates data silos. -
Faster Decision-Making
Real-time visuals help leaders act quickly. -
Improved Data Accuracy
Automated refresh reduces manual errors. -
Enhanced Visibility
MTD and YTD trends show performance clearly. -
User-Friendly Design
Even non-technical users navigate the dashboard easily. -
Scalability
Organizations can add new KPIs anytime.
Because of these advantages, pharmaceutical companies gain better control over operations.
Who Can Use a Pharmaceutical KPI Dashboard in Power BI?
This dashboard supports a wide range of users across pharmaceutical organizations.
Ideal Users Include
-
Senior management
-
Sales and marketing teams
-
Production managers
-
Quality assurance teams
-
Compliance officers
-
Business analysts
Each user benefits from role-based insights and interactive analysis.
How Does Power BI Improve Pharmaceutical KPI Reporting?
Power BI enhances pharmaceutical KPI reporting in several ways.
-
Interactive dashboards replace static reports
-
Slicers allow dynamic filtering
-
Visuals simplify complex data
-
Drill-down features enable deep analysis
Therefore, organizations move from reporting to insight-driven decision-making.
How to Maintain and Update the Dashboard Easily?
Maintaining this dashboard remains simple.
-
Update KPI data in the Excel file
-
Open the Power BI file
-
Click the Refresh button
-
Review updated insights instantly
Because of this workflow, teams save time every month.
Best Practices for the Pharmaceutical KPI Dashboard in Power BI
Click to Purchases Pharmaceutical KPI Dashboard in Power BI
Following best practices ensures maximum value from the dashboard.
Best Practices You Should Follow
-
Define clear and measurable KPIs
-
Keep KPI definitions consistent
-
Update data regularly
-
Review KPIs monthly and quarterly
-
Use slicers wisely for focused analysis
-
Train users on dashboard interpretation
-
Avoid overcrowding the dashboard
By following these practices, organizations improve KPI adoption and effectiveness.
How to Choose the Right KPIs for Pharmaceutical Dashboards?
Selecting the right KPIs remains critical.
Tips for KPI Selection
-
Align KPIs with business goals
-
Focus on actionable metrics
-
Avoid too many KPIs
-
Balance financial and operational KPIs
-
Review KPIs periodically
This approach ensures meaningful performance tracking.
Common Mistakes to Avoid in Pharmaceutical KPI Dashboards
Avoiding common mistakes improves dashboard success.
-
Tracking too many KPIs
-
Ignoring data validation
-
Using unclear KPI definitions
-
Failing to update targets
-
Overloading visuals
When you avoid these mistakes, dashboards remain effective and trusted.
How Does This Dashboard Support Compliance and Quality Monitoring?
Pharmaceutical companies must maintain strict compliance. This dashboard helps by:
-
Tracking quality KPIs consistently
-
Monitoring deviations early
-
Supporting audit preparation
-
Improving documentation accuracy
Therefore, compliance teams gain better visibility and control.
Future Scope of Pharmaceutical KPI Dashboards in Power BI
The future of pharmaceutical dashboards looks promising.
-
Integration with ERP systems
-
Automated data pipelines
-
Advanced analytics using AI
-
Predictive KPI trends
-
Mobile-friendly dashboards
As Power BI evolves, pharmaceutical dashboards will become even more powerful.
Conclusion: Why Should You Use a Pharmaceutical KPI Dashboard in Power BI?
A Pharmaceutical KPI Dashboard in Power BI transforms how pharmaceutical organizations track and manage performance. It replaces manual reporting with real-time, interactive insights. Moreover, it improves accuracy, transparency, and decision-making speed.
By using this dashboard, pharmaceutical companies gain a single source of truth for KPIs. As a result, leaders focus on strategy instead of spreadsheets. Ultimately, this dashboard supports growth, compliance, and operational excellence.
Frequently Asked Questions (FAQs)
What is a Pharmaceutical KPI Dashboard in Power BI?
A Pharmaceutical KPI Dashboard in Power BI is an interactive reporting solution that tracks pharmaceutical KPIs using Power BI visuals connected to Excel data.
Can I update the dashboard without technical skills?
Yes, you only update the Excel file and refresh Power BI.
Does this dashboard support MTD and YTD analysis?
Yes, it tracks both MTD and YTD performance clearly.
Can I customize KPIs in the dashboard?
Yes, you can add, remove, or modify KPIs easily.
Is Power BI suitable for pharmaceutical compliance reporting?
Yes, Power BI improves data accuracy and consistency, which supports compliance needs.
Who benefits most from this dashboard?
Management, analysts, sales teams, production teams, and compliance teams benefit the most.
Visit our YouTube channel to learn step-by-step video tutorials