Managing export compliance without a structured system often creates confusion, delays, and compliance risks. Many organizations still rely on scattered Excel files, emails, and manual checks. As a result, compliance teams struggle to track violations, audit readiness, documentation accuracy, and regulatory performance.
That is exactly where an Export Compliance KPI Dashboard in Excel becomes a powerful and practical solution.
In this detailed guide, you will learn what an Export Compliance KPI Dashboard in Excel is, why it matters, how it works, its worksheet structure, key KPIs, advantages, best practices, and frequently asked questions. Moreover, this article uses clear language, active voice, and real business logic so you can easily apply the concepts in your organization.
Click to Purchases Export Compliance KPI Dashboard in Excel
What Is an Export Compliance KPI Dashboard in Excel?
An Export Compliance KPI Dashboard in Excel is a centralized performance monitoring tool that tracks key export compliance metrics using structured KPIs, trends, and comparisons.
Instead of checking multiple reports, compliance officers, export managers, and audit teams monitor everything from one interactive Excel dashboard. Because the dashboard runs in Microsoft Excel, it remains easy to use, flexible, and cost-effective.
Most importantly, the dashboard helps organizations:
-
Monitor compliance performance month-by-month
-
Compare actual vs target vs previous year values
-
Identify compliance risks early
-
Improve audit readiness
-
Ensure adherence to export regulations
Why Do Businesses Need an Export Compliance KPI Dashboard in Excel?
Export compliance failures lead to penalties, shipment delays, license revocations, and reputational damage. Therefore, organizations must track compliance performance consistently and accurately.
An Export Compliance KPI Dashboard in Excel solves this challenge by providing:
-
Centralized visibility of all compliance KPIs
-
MTD and YTD performance tracking
-
Trend analysis for early risk detection
-
Data-driven decision support
-
Audit-ready reporting structure
Moreover, Excel makes the solution accessible to organizations of all sizes without investing in expensive compliance software.
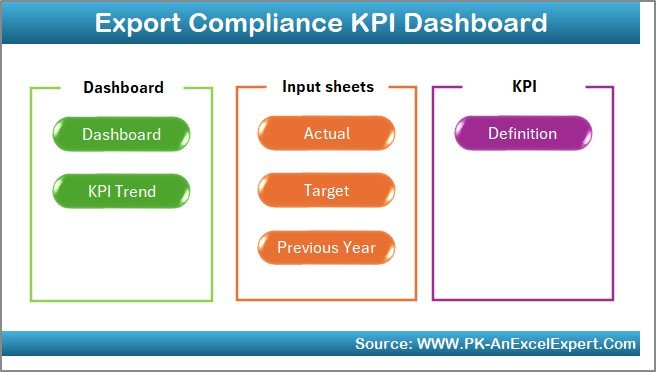
How Does an Export Compliance KPI Dashboard in Excel Work?
The dashboard works on a structured and logical flow. First, users enter data in dedicated input sheets. Then, formulas automatically calculate MTD and YTD results. Finally, the dashboard visualizes performance using tables, indicators, and charts.
Here is how the flow works:
-
Enter Actual Numbers for each KPI
-
Enter Target Values
-
Enter Previous Year Data
-
Excel calculates comparisons automatically
-
Dashboard displays KPI performance visually
Because of this structure, users update data once and analyze everything instantly.
What Worksheets Are Included in the Export Compliance KPI Dashboard in Excel?
This ready-to-use Export Compliance KPI Dashboard in Excel contains 7 well-designed worksheets. Each worksheet plays a specific role in the compliance monitoring process.
1️⃣ Home Sheet – Central Navigation Hub
The Home Sheet works as an index page.
Key Highlights:
-
Contains 6 navigation buttons
-
Allows one-click movement to any worksheet
-
Improves user experience and usability
-
Makes the dashboard business-friendly
As a result, even non-technical users navigate the dashboard easily.
2️⃣ Dashboard Sheet – Main KPI Performance View
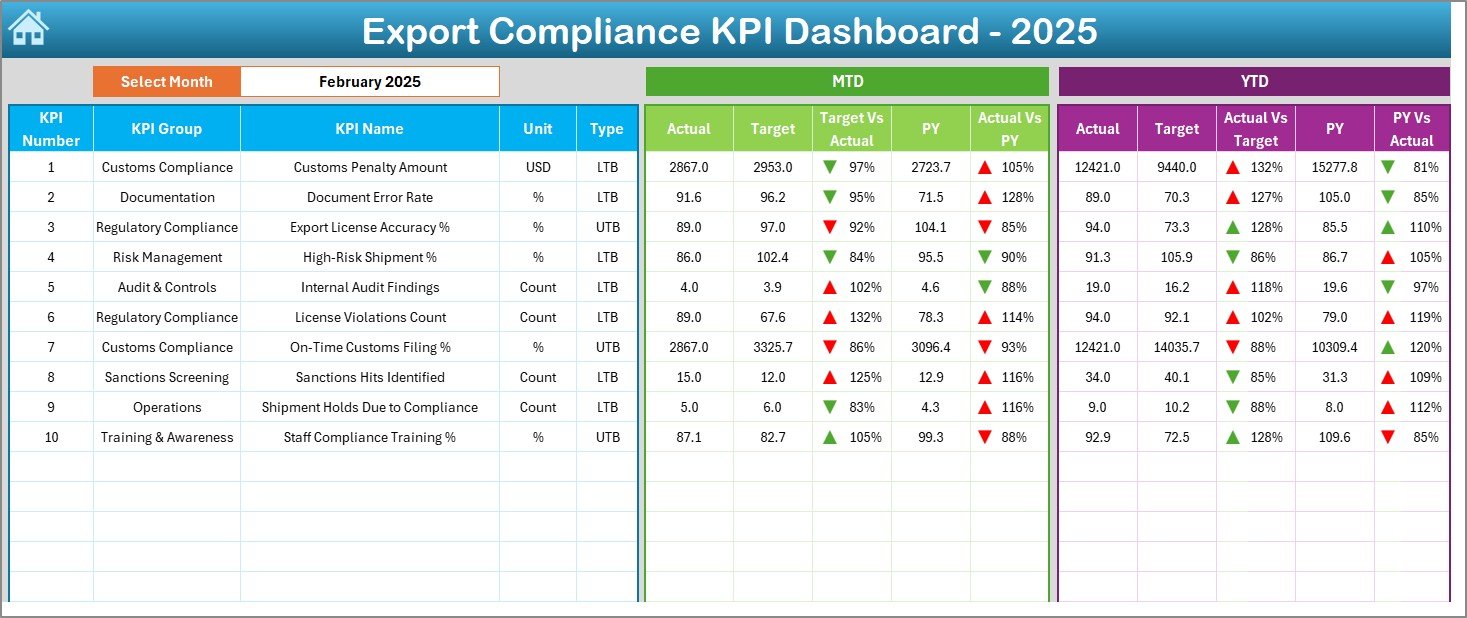
The Dashboard Sheet acts as the heart of the Export Compliance KPI Dashboard in Excel.
What Does This Sheet Show?
-
Month selection using a dropdown at cell D3
-
Automatic refresh of all dashboard values based on the selected month
-
Clean and structured KPI performance table
KPI Metrics Displayed:
MTD Section
-
Actual
-
Target
-
Previous Year
-
Target vs Actual (with up/down arrows)
-
Previous Year vs Actual (with up/down arrows)
YTD Section
-
Actual
-
Target
-
Previous Year
-
Target vs Actual (with up/down arrows)
-
Previous Year vs Actual (with up/down arrows)
Because of conditional formatting arrows, users immediately identify compliance risks and improvements.
3️⃣ KPI Trend Sheet – KPI-Wise Performance Analysis
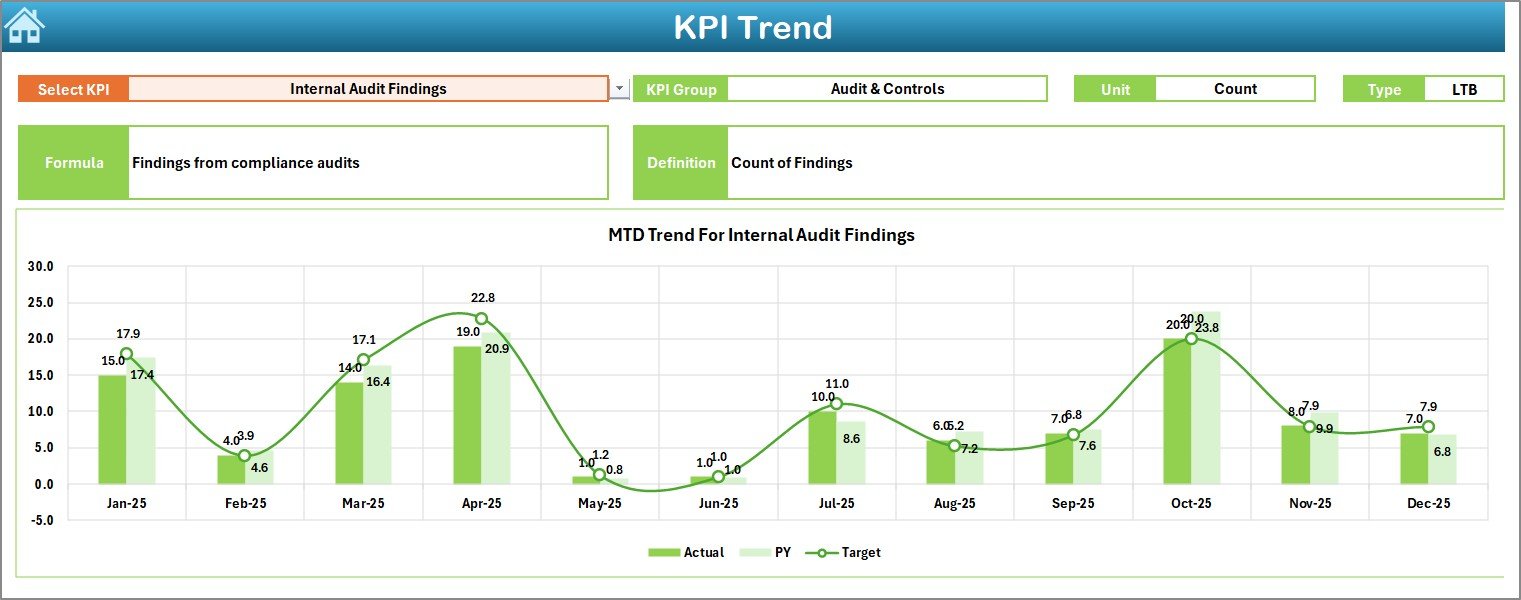
The KPI Trend Sheet focuses on deep-dive analysis of individual KPIs.
How Does It Work?
-
Select the KPI Name from the dropdown in cell C3
-
Dashboard displays:
-
KPI Group
-
Unit
-
KPI Type (LTB or UTB)
-
KPI Formula
-
KPI Definition
-
Visual Insights:
-
MTD trend chart (Actual, Target, PY)
-
YTD trend chart (Actual, Target, PY)
As a result, compliance managers understand how each KPI performs over time.
Click to Purchases Export Compliance KPI Dashboard in Excel
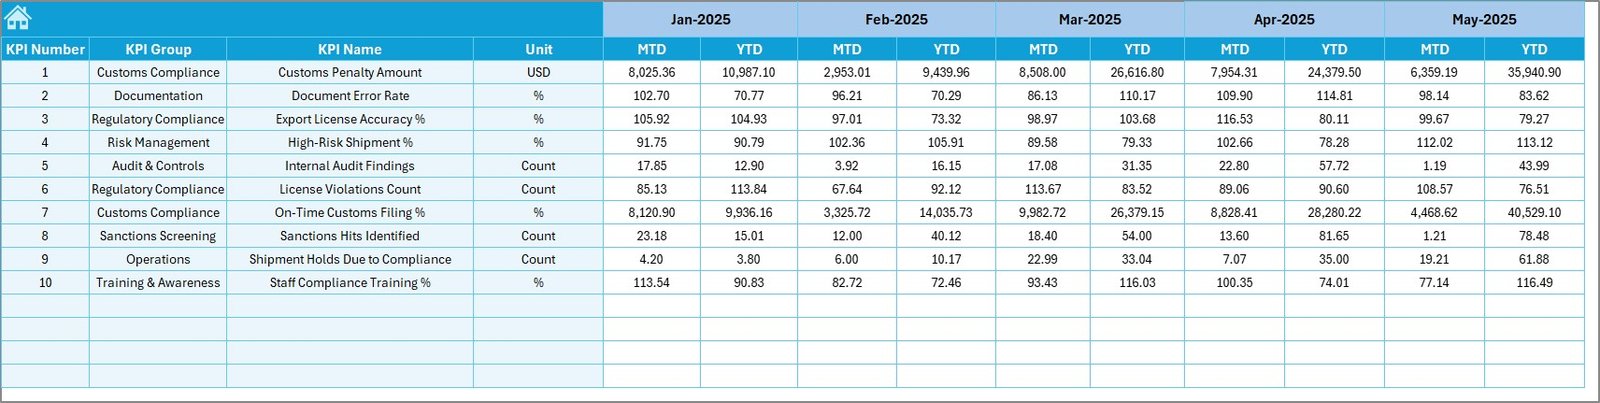
4️⃣ Actual Numbers Input Sheet – Data Entry for Current Year
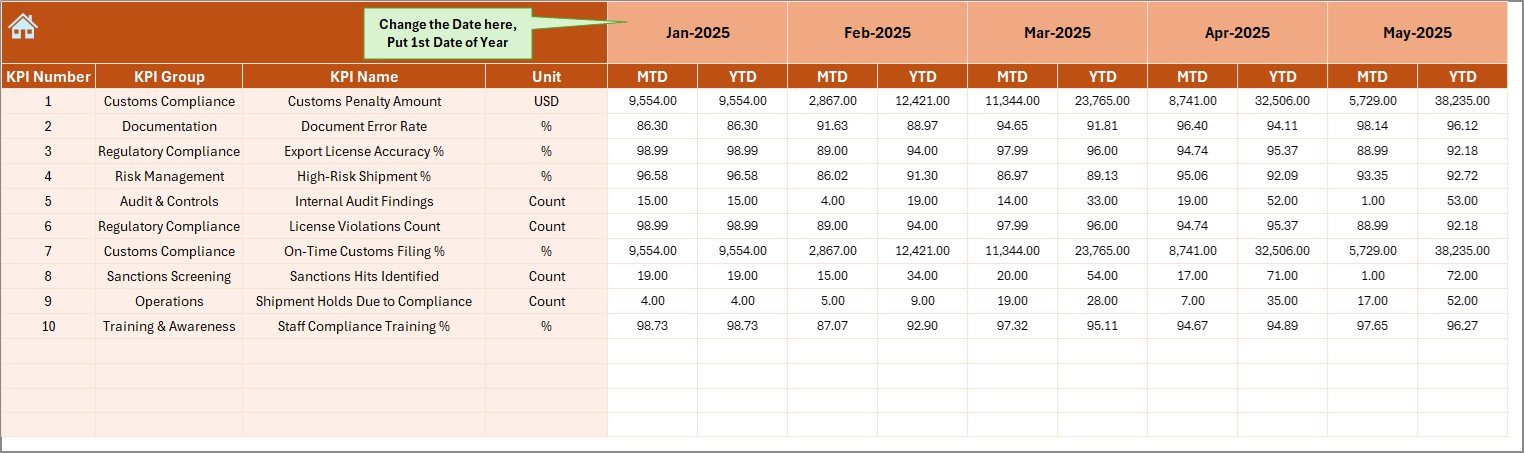
The Actual Numbers Input Sheet stores actual compliance performance data.
How to Use This Sheet?
-
Enter MTD and YTD actual values
-
Change the month using cell E1
-
Input only the first month of the year in E1
-
Excel automatically adjusts calculations
Because of this design, data entry remains simple and controlled.
5️⃣ Target Sheet – Compliance Goal Setting
The Target Sheet stores planned compliance goals.
Key Points:
-
Enter MTD target values
-
Enter YTD target values
-
Define expected compliance performance
-
Support benchmarking and accountability
Therefore, organizations track whether compliance goals stay on track.
6️⃣ Previous Year Number Sheet – Year-on-Year Comparison
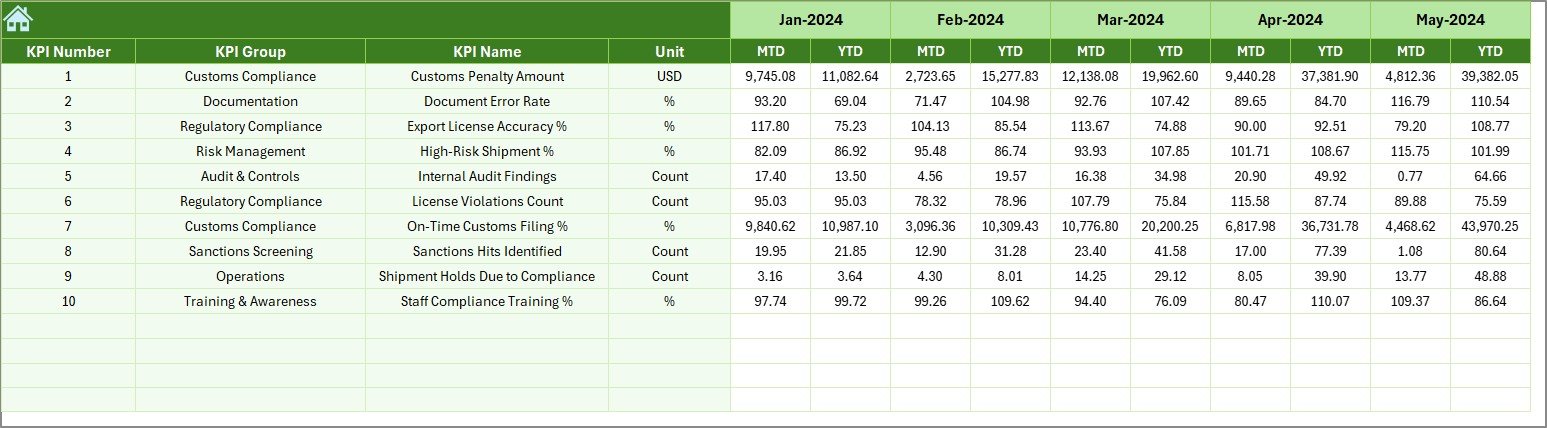
The Previous Year Number Sheet enables historical comparison.
Why Is This Sheet Important?
-
Enter last year’s MTD and YTD data
-
Compare current performance with past trends
-
Identify long-term compliance improvements or risks
As a result, decision-makers gain context, not just numbers.
7️⃣ KPI Definition Sheet – KPI Governance & Documentation
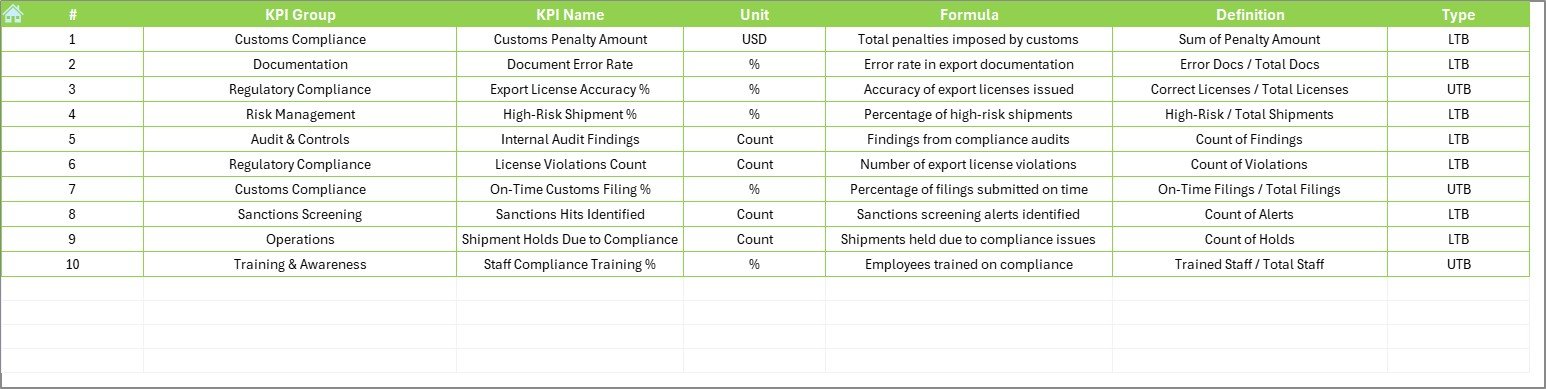
The KPI Definition Sheet ensures clarity and consistency.
Information Captured:
-
KPI Name
-
KPI Group
-
Unit
-
Formula
-
KPI Definition
Because of this sheet, everyone interprets KPIs the same way, which improves governance and audit readiness.
What Types of KPIs Can You Track in an Export Compliance KPI Dashboard in Excel?
This dashboard supports multiple compliance-focused KPIs, such as:
-
Export License Compliance Rate
-
Documentation Accuracy Percentage
-
Shipment Screening Completion Rate
-
Denied Party Screening Errors
-
Export Audit Findings Count
-
Regulatory Filing Timeliness
-
Training Completion Rate
-
Compliance Incident Frequency
You can easily customize KPIs based on country-specific or industry-specific regulations.
Advantages of Export Compliance KPI Dashboard in Excel
Using an Export Compliance KPI Dashboard in Excel delivers measurable business value.
Key Advantages:
-
📊 Centralized compliance visibility
-
⏱️ Faster decision-making
-
🚨 Early risk identification
-
📈 MTD and YTD performance tracking
-
📑 Audit-ready documentation
-
💰 Cost-effective solution
-
🔄 Fully customizable
-
🧠 No advanced technical skills required
Therefore, organizations improve compliance maturity without complexity.
Opportunities for Improvement in Export Compliance KPI Tracking
Even strong compliance programs benefit from structured improvement.
Improvement Opportunities:
-
🔧 Standardize KPI definitions across regions
-
🔍 Add automated validation checks
-
📊 Expand trend analysis depth
-
🧩 Integrate risk scoring logic
-
📅 Improve reporting frequency
The Export Compliance KPI Dashboard in Excel provides a strong foundation for these enhancements.
Best Practices for the Export Compliance KPI Dashboard in Excel
Following best practices ensures long-term success and accuracy.
Best Practices:
-
✅ Define KPIs clearly in the KPI Definition Sheet
-
✅ Update actual data on a fixed schedule
-
✅ Review MTD performance weekly
-
✅ Analyze YTD trends monthly
-
✅ Use conditional formatting consistently
-
✅ Limit manual formula changes
-
✅ Maintain version control
-
✅ Train users on data entry rules
As a result, the dashboard remains reliable and audit-ready.
Click to Purchases Export Compliance KPI Dashboard in Excel
Who Can Benefit from an Export Compliance KPI Dashboard in Excel?
This dashboard supports a wide range of users.
Ideal For:
-
Export Compliance Officers
-
Trade Compliance Managers
-
Supply Chain Leaders
-
Risk & Audit Teams
-
Logistics Managers
-
Export Documentation Teams
-
SMEs and large enterprises
Because Excel remains universal, adoption stays fast and easy.
How Does This Dashboard Support Audit and Regulatory Requirements?
Auditors expect structured, consistent, and historical compliance data.
This dashboard supports audits by:
-
Maintaining KPI definitions
-
Tracking historical performance
-
Showing variance analysis
-
Demonstrating control effectiveness
-
Providing documentation transparency
As a result, audit preparation becomes faster and less stressful.
Conclusion: Why You Should Use an Export Compliance KPI Dashboard in Excel
Export compliance requires accuracy, visibility, and accountability. Manual tracking increases risk and delays decisions. However, an Export Compliance KPI Dashboard in Excel transforms raw compliance data into actionable insights.
Because the dashboard offers MTD and YTD tracking, trend analysis, historical comparison, and KPI governance, organizations gain control over export compliance performance. Moreover, Excel keeps the solution simple, flexible, and affordable.
If you want better compliance visibility, reduced risk, and stronger audit readiness, this dashboard becomes an essential tool.
Frequently Asked Questions (FAQs)
What is the purpose of an Export Compliance KPI Dashboard in Excel?
The purpose is to track, analyze, and improve export compliance performance using structured KPIs, trends, and comparisons in Excel.
Can small businesses use this Export Compliance KPI Dashboard in Excel?
Yes, small businesses benefit greatly because Excel provides a low-cost and easy-to-use compliance tracking solution.
Does the dashboard support MTD and YTD analysis?
Yes, the dashboard tracks both Month-to-Date and Year-to-Date performance automatically.
Can I customize KPIs in this dashboard?
Absolutely. You can add, remove, or modify KPIs easily using the KPI Definition Sheet.
Does the dashboard help during audits?
Yes, it supports audits by maintaining historical data, KPI definitions, and variance analysis in a structured format.
Do I need advanced Excel skills to use this dashboard?
No. Basic Excel knowledge is sufficient to update data and analyze results.
Can this dashboard work for different countries’ export regulations?
Yes. You can customize KPIs and targets based on country-specific export compliance rules.
Visit our YouTube channel to learn step-by-step video tutorials
