Managing territories effectively plays a vital role in achieving consistent growth, balanced performance, and clear accountability. However, many organizations still struggle with scattered reports, delayed insights, and manual tracking methods. As a result, leaders often lose visibility into how each territory performs against targets.
This is exactly where a Territory Management KPI Dashboard in Power BI delivers exceptional value.
In this detailed and SEO-friendly article, you will learn what a Territory Management KPI Dashboard in Power BI is, why it matters, how it works, its complete page-wise structure, advantages, best practices, challenges, and frequently asked questions. Moreover, this guide uses simple language, clear explanations, and real-world logic so you can apply it immediately.
Click to buy Territory Management KPI Dashboard in Power BI
What Is a Territory Management KPI Dashboard in Power BI?
A Territory Management KPI Dashboard in Power BI is a ready-to-use, interactive performance monitoring solution designed to track key performance indicators across different territories.
Instead of relying on multiple Excel files, emails, and static reports, this dashboard consolidates all territory-related KPIs into a single Power BI report. As a result, decision-makers gain instant visibility into performance trends, target achievements, and year-over-year comparisons.
More importantly, this dashboard allows users to monitor MTD (Month-to-Date) and YTD (Year-to-Date) performance while comparing actuals with targets and previous-year values.
Why Do Organizations Need a Territory Management KPI Dashboard?
Territory-based operations involve sales teams, service regions, distribution zones, or operational clusters. Therefore, performance visibility becomes critical.
Without a structured dashboard:
- Managers spend hours compiling reports
- Performance gaps remain hidden
- Decision-making slows down
- Accountability weakens
On the other hand, a Territory Management KPI Dashboard in Power BI:
- Centralizes all KPI data
- Highlights underperforming territories
- Supports faster, data-driven decisions
- Improves transparency and ownership
How Does a Territory Management KPI Dashboard in Power BI Work?
This dashboard uses Power BI as the visualization layer and Excel as the data source. Because of this setup, it remains flexible, user-friendly, and easy to maintain.
Data Flow Overview
- Users update KPI data in Excel
- Power BI refreshes the data model
- Visuals update automatically
- Users analyze performance using slicers and charts
As a result, the entire reporting process becomes faster and more reliable.
Data Source Structure: Excel-Based Input Sheets
The dashboard uses an Excel file with three structured worksheets. This design keeps data entry simple while maintaining reporting accuracy.
Input_Actual Sheet
This sheet captures actual KPI performance values.
You need to fill:
- KPI Name
- Month (use the first date of the month)
- MTD Actual
- YTD Actual
Click to buy Territory Management KPI Dashboard in Power BI
Input_Target Sheet
This sheet stores target values for each KPI.
You need to fill:
- KPI Name
- Month
- MTD Target
- YTD Target
KPI Definition Sheet
This sheet defines the KPIs used in the dashboard.
You need to fill:
- KPI Number
- KPI Group
- KPI Name
- Unit
- Formula
- Definition
- Type (LTB or UTB)
Because of this clear structure, users can maintain data easily without technical complexity.
Dashboard Structure: 3 Powerful Pages Explained
The Territory Management KPI Dashboard in Power BI contains three interactive pages, each designed for a specific purpose.
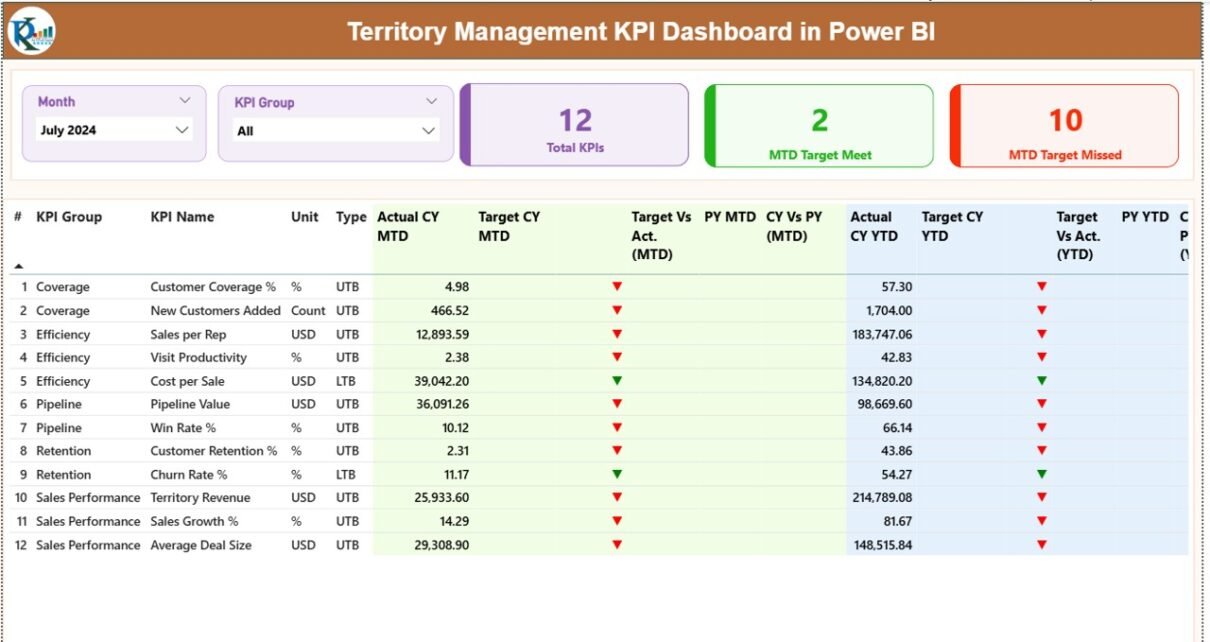
Summary Page: The Performance Control Center
The Summary Page acts as the main decision-making interface of the dashboard.
Top-Level Filters
At the top, users can filter data using:
- Month slicer
- KPI Group slicer
Because of these slicers, the entire dashboard updates instantly based on user selection.
KPI Cards on the Summary Page
This page includes three high-impact KPI cards:
- Total KPIs Count
- MTD Target Met Count
- MTD Target Missed Count
These cards provide a quick snapshot of overall performance health.
Detailed KPI Performance Table
Below the cards, the dashboard displays a detailed KPI table with the following fields:
- KPI Number – Sequence number of the KPI
- KPI Group – Category of the KPI
- KPI Name – Name of the KPI
- Unit – Unit of measurement
- Type – LTB (Lower the Better) or UTB (Upper the Better)
MTD Performance Metrics
For Month-to-Date analysis, the table shows:
- Actual CY MTD – Current year actual MTD value
- Target CY MTD – Current year target MTD value
- MTD Icon – ▲ or ▼ with green/red color to indicate status
- Target vs Actual (MTD) – Actual ÷ Target
- PY MTD – Previous year MTD value
- CY vs PY (MTD) – CY MTD ÷ PY MTD
These metrics help managers identify short-term performance gaps quickly.
YTD Performance Metrics
For Year-to-Date analysis, the table shows:
- Actual CY YTD – Current year actual YTD value
- Target CY YTD – Current year target YTD value
- YTD Icon – ▲ or ▼ with green/red color
- Target vs Actual (YTD) – Actual ÷ Target
- PY YTD – Previous year YTD value
- CY vs PY (YTD) – CY YTD ÷ PY YTD
As a result, leaders can track long-term progress with confidence.

Click to buy Territory Management KPI Dashboard in Power BI
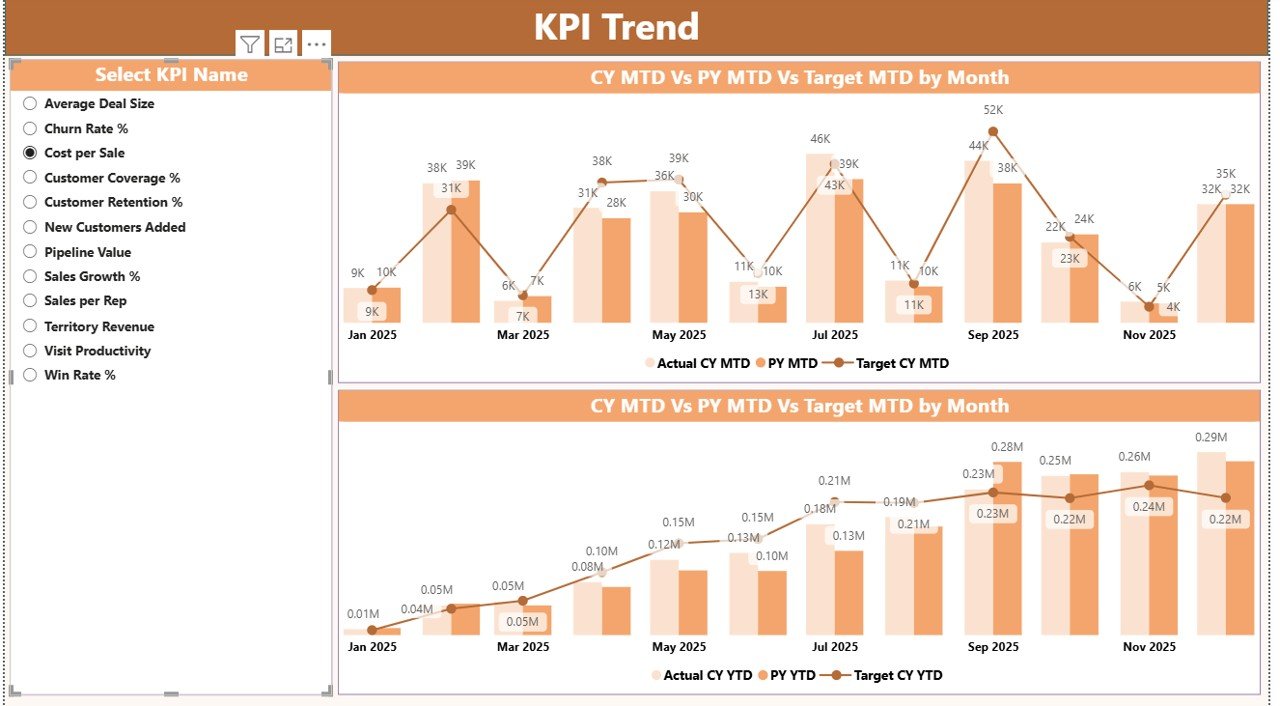
KPI Trend Page: Visual Performance Analysis
The KPI Trend Page focuses on trend-based analysis.
Key Features of the Trend Page
- KPI Name slicer on the left
- Two interactive combo charts
- Clear comparison of Actual, Target, and Previous Year
Combo Charts Explained
The dashboard includes:
- MTD Trend Combo Chart
- YTD Trend Combo Chart
Each chart shows:
- Current Year Actual
- Previous Year Actual
- Target Values
Because of this setup, users can easily spot trends, seasonality, and performance deviations over time.
Click to buy Territory Management KPI Dashboard in Power BI
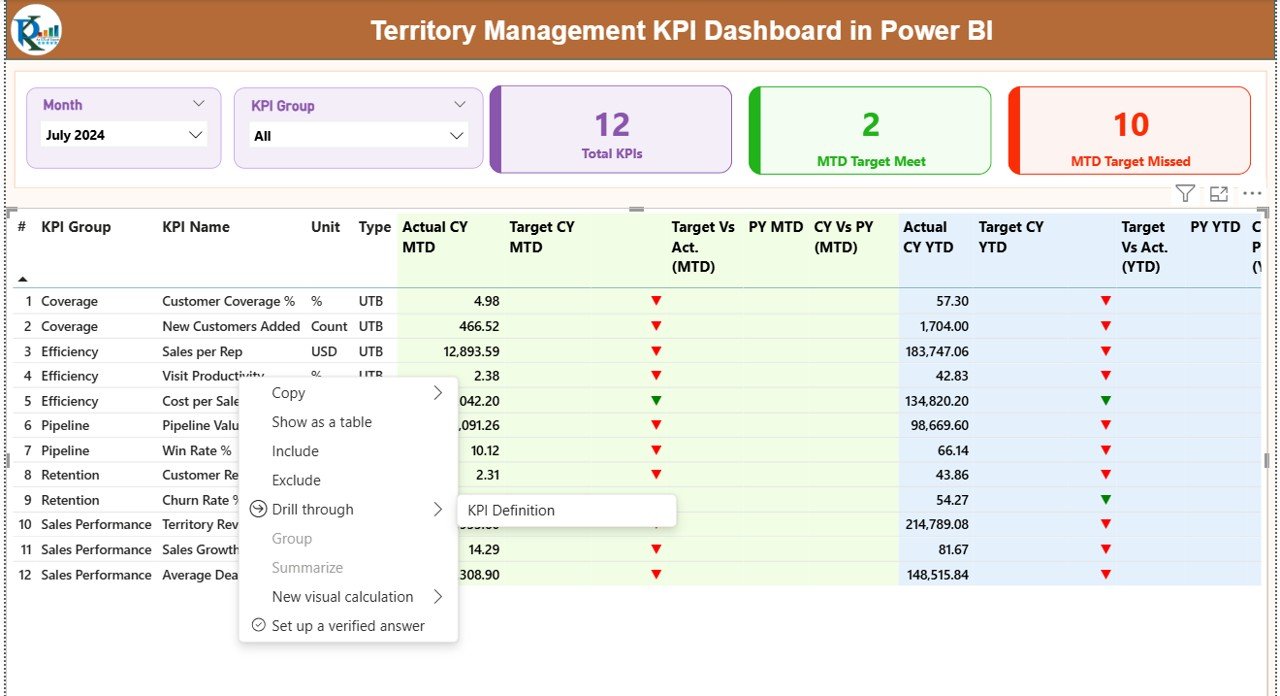
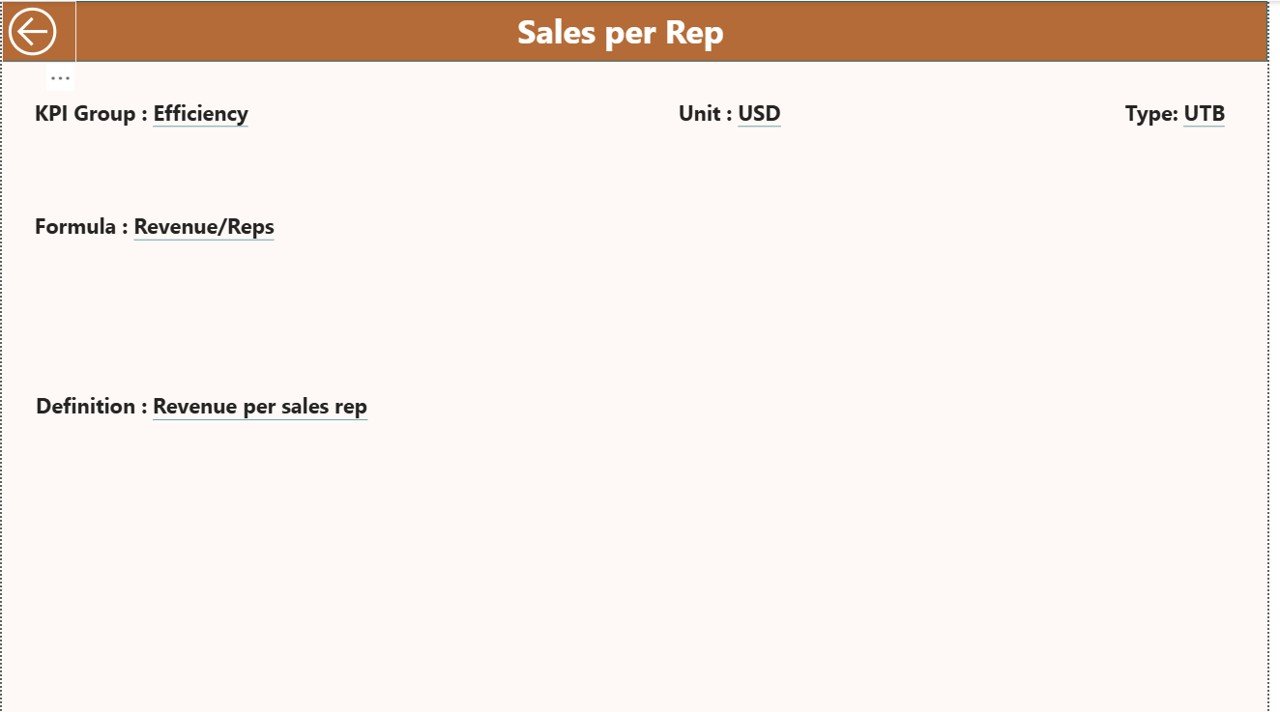
KPI Definition Page: Deep KPI Understanding
The KPI Definition Page works as a drill-through page.
Key Characteristics
- Hidden from the main navigation
- Accessible via drill-through from the Summary Page
- Displays KPI Formula and Definition
This design ensures that users understand what each KPI measures and how calculations work.
To return to the Summary Page, users simply click the Back button available on the top-left corner.
Click to buy Territory Management KPI Dashboard in Power BI
Advantages of Territory Management KPI Dashboard in Power BI
Using a Territory Management KPI Dashboard in Power BI delivers several strategic advantages.
Key Benefits
- Centralized performance monitoring
- Real-time MTD and YTD insights
- Clear comparison with targets and previous year
- Visual performance indicators
- Easy Excel-based data input
- Drill-through capability for KPI clarity
Because of these benefits, organizations improve both speed and quality of decision-making.
Who Can Use This Dashboard?
This dashboard suits multiple roles and industries.
Ideal Users Include:
- Sales managers
- Regional heads
- Territory managers
- Business analysts
- Strategy teams
- Senior leadership
Moreover, any organization managing performance across regions can benefit from this solution.
Best Practices for the Territory Management KPI Dashboard in Power BI
Following best practices ensures accuracy and long-term value.
Data Management Best Practices
- Update Excel data regularly
- Use consistent KPI names
- Avoid leaving blank months
- Validate targets before refresh
Dashboard Usage Best Practices
- Review MTD performance weekly
- Analyze YTD trends monthly
- Use KPI Groups for focused analysis
- Drill through KPIs when results look unusual
Governance Best Practices
- Define clear KPI ownership
- Document KPI formulas
- Train users on LTB and UTB logic
As a result, the dashboard remains reliable and actionable.
Common Challenges and How to Overcome Them
Even the best dashboards face challenges. However, smart planning helps overcome them.
Challenge 1: Inconsistent Data Entry
Solution: Use standardized Excel templates and validation rules.
Challenge 2: Misinterpretation of KPIs
Solution: Maintain clear KPI definitions on the drill-through page.
Challenge 3: Overloaded Dashboards
Solution: Group KPIs logically and focus on decision-critical metrics.
How Does This Dashboard Support Better Decision-Making?
This dashboard supports decisions by:
- Highlighting underperforming territories
- Comparing targets vs actuals instantly
- Tracking growth against previous year
- Identifying trends before issues escalate
As a result, managers move from reactive reporting to proactive management.
Conclusion
A Territory Management KPI Dashboard in Power BI transforms how organizations track, analyze, and improve territory performance. Instead of struggling with manual reports and delayed insights, teams gain a single source of truth that delivers clarity, speed, and confidence.
Because of its structured Excel data model, interactive Power BI visuals, and clear KPI logic, this dashboard becomes a powerful performance management tool. When used correctly, it helps organizations drive accountability, optimize territories, and achieve consistent results.
Frequently Asked Questions (FAQs)
1) What is a Territory Management KPI Dashboard in Power BI used for?
It tracks and analyzes performance KPIs across different territories using interactive visuals and comparisons.
2) Can I update data without Power BI expertise?
Yes. You only need to update Excel input sheets. Power BI refreshes the visuals automatically.
3) What does LTB and UTB mean?
LTB means Lower the Better, while UTB means Upper the Better. These types define KPI evaluation logic.
4) Does this dashboard support MTD and YTD analysis?
Yes. It provides detailed MTD and YTD performance with target and previous-year comparisons.
5) Can I add more KPIs later?
Yes. You can add new KPIs by updating the Excel sheets and KPI definition table.
6) Is this dashboard suitable for non-sales territories?
Absolutely. You can use it for operations, service regions, logistics zones, or any territory-based structure.
Visit our YouTube channel to learn step-by-step video tutorials
Watch the step-by-step video tutorial:
Click to buy Territory Management KPI Dashboard in Power BI