Construction sites operate in high-risk environments. Workers handle heavy machinery. Teams work at heights. Materials move constantly. Therefore, safety must remain the top priority.
However, many construction companies still track safety performance using scattered sheets and manual reports. As a result, they miss early warning signs. They fail to compare targets properly. They struggle to identify trends in incidents.
So, how can you monitor accident rates, lost time injuries, safety training hours, compliance scores, and near-miss reports in one structured system?
The answer is simple.
You need a Construction Safety KPI Scorecard in Excel.
In this complete guide, you will learn:
-
What a Construction Safety KPI Scorecard in Excel is
-
Why construction companies need it
-
Detailed explanation of all 4 worksheets
-
Important safety KPIs for construction projects
-
Advantages of Construction Safety KPI Scorecard in Excel
-
Best Practices for the Construction Safety KPI Scorecard
-
Frequently Asked Questions with Answers
Let us explore everything step by step.
Click to Purchases Construction Safety KPI Scorecard in Excel
What Is a Construction Safety KPI Scorecard in Excel?
A Construction Safety KPI Scorecard in Excel is a ready-to-use performance tracking tool designed to monitor safety metrics across construction sites.
It allows you to:
-
Track safety incidents
-
Compare actual vs target performance
-
Monitor Month-to-Date (MTD) and Year-to-Date (YTD) results
-
Analyze trends visually
-
Maintain clear KPI definitions
Instead of relying on manual safety reports, you can use one structured Excel template to evaluate safety performance in real time.
Moreover, Excel offers flexibility and customization. Therefore, you can adapt the scorecard based on your project size and safety standards.
Why Do Construction Companies Need a Safety KPI Scorecard?
Construction remains one of the highest-risk industries worldwide. Even a small mistake can lead to serious injury, project delays, or financial penalties.
Therefore, companies must:
-
Monitor incident frequency
-
Track lost time injuries
-
Measure safety training hours
-
Evaluate compliance levels
-
Analyze near-miss reports
If you do not track these numbers regularly, safety performance may decline.
Additionally, regulatory authorities expect strict compliance. Consequently, companies must maintain accurate safety records.
A KPI Scorecard helps you:
-
Identify risk trends early
-
Improve worker awareness
-
Reduce accident rates
-
Strengthen compliance
-
Protect company reputation
In short, it turns safety data into actionable decisions.
Click to Purchases Construction Safety KPI Scorecard in Excel
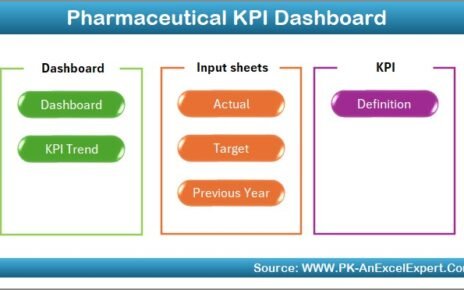
What Are the Key Features of the Construction Safety KPI Scorecard in Excel?
This ready-to-use template includes 4 powerful worksheets:
-
Scorecard Sheet
-
KPI Trend Sheet
-
Input Data Sheet
-
KPI Definition Sheet
Let us understand each sheet in detail.
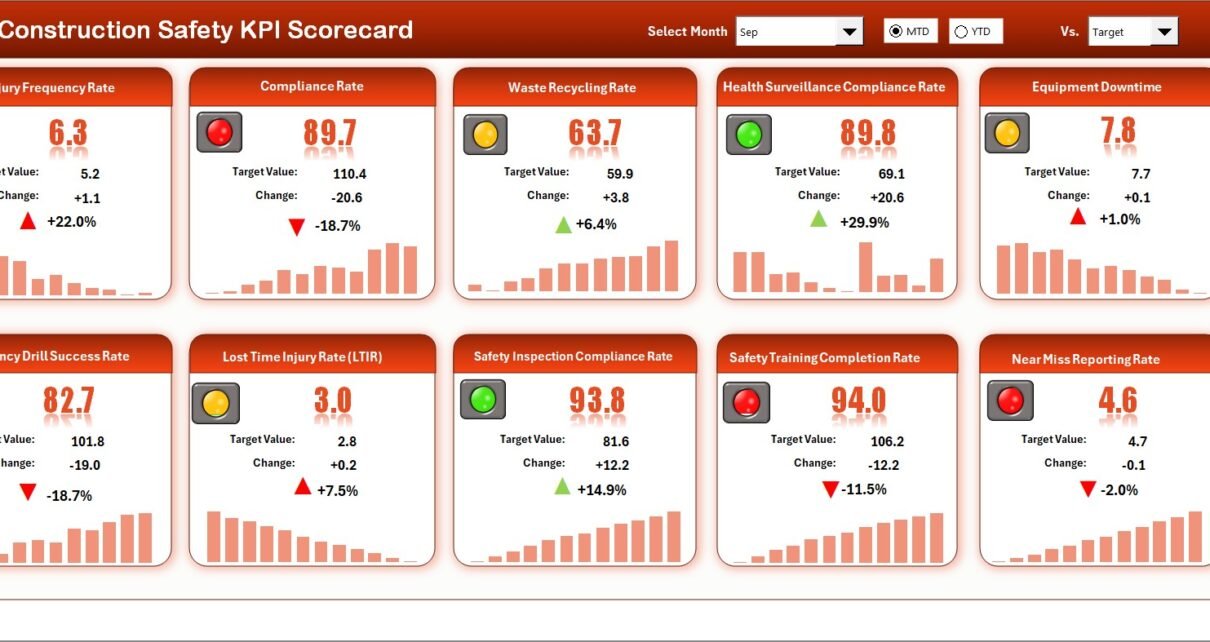
1️⃣ Scorecard Sheet – Main Safety Dashboard
The Scorecard Sheet serves as the main performance interface. Here, you can view all safety KPIs in one place.
Key Features of the Scorecard Sheet
✔ Dropdown Menus
You can select:
-
Month
-
MTD (Month-to-Date)
-
YTD (Year-to-Date)
Once you select a month or view type, the dashboard updates automatically.
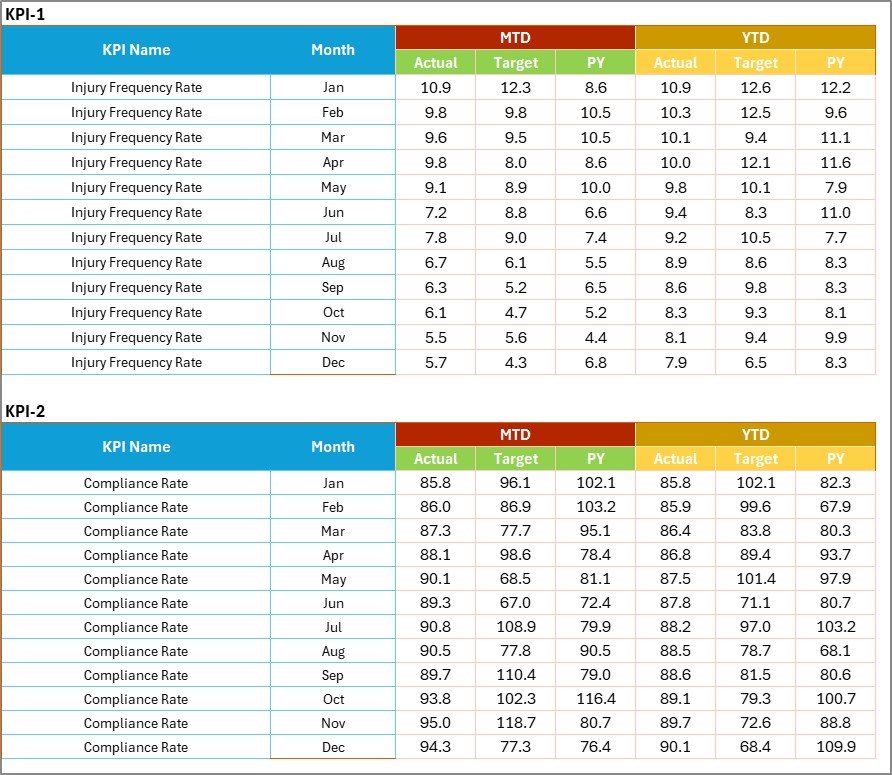
✔ Actual vs Target Values
You can compare:
-
Actual safety performance
-
Target safety levels
-
Previous Year (PY) values
Therefore, you can quickly identify whether safety performance improves or declines.
✔ Visual Indicators
The scorecard uses:
-
Color-coded indicators
-
Conditional formatting
-
Up and down arrows
As a result, managers can understand safety status instantly.
✔ Comprehensive KPI Overview
The dashboard displays:
-
KPI Name
-
KPI Group
-
Unit
-
MTD performance
-
YTD performance
-
Variance from target
Thus, you gain full visibility without switching sheets.
Click to Purchases Construction Safety KPI Scorecard in Excel
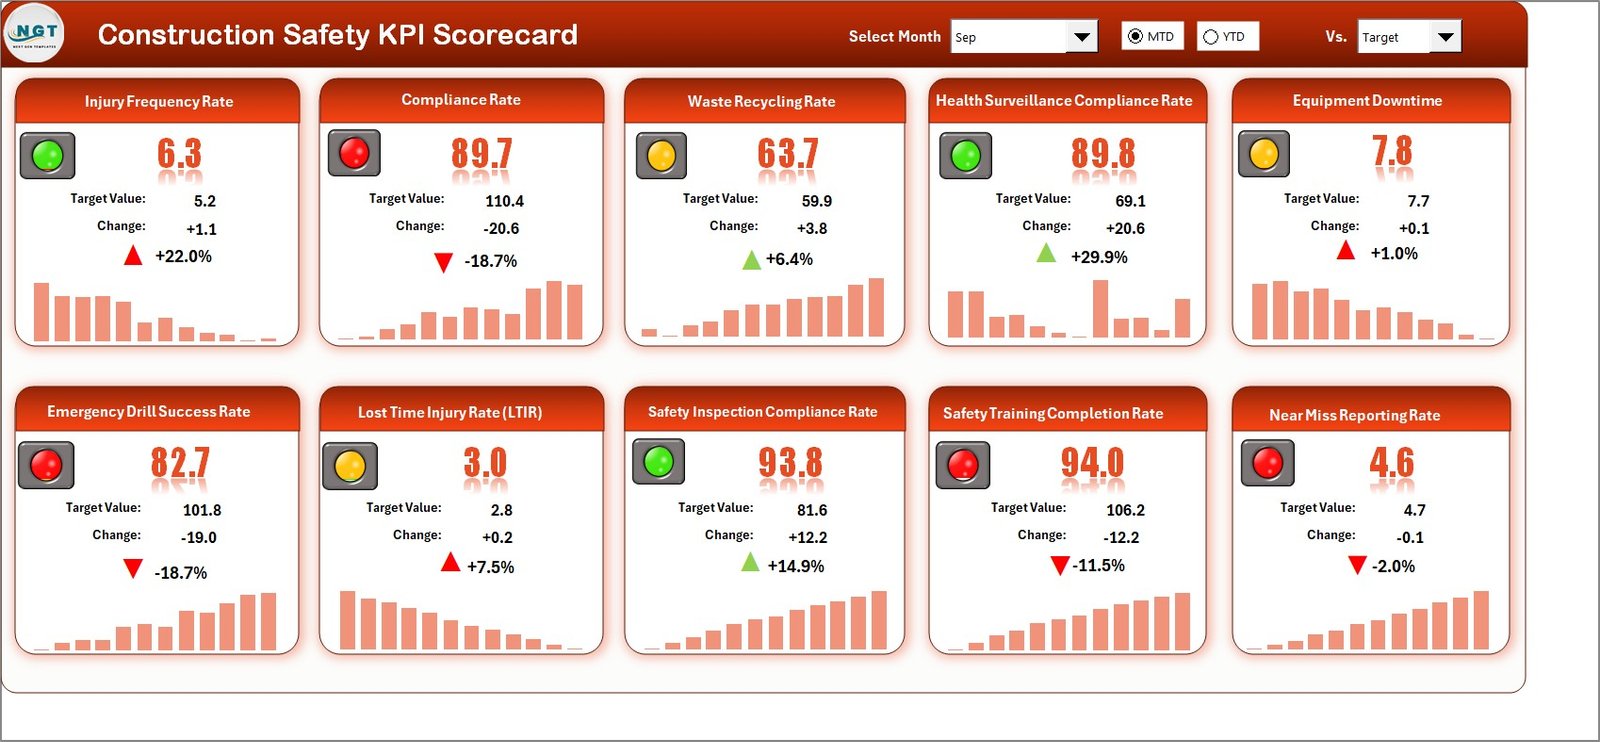
2️⃣ KPI Trend Sheet – Detailed Safety Analysis
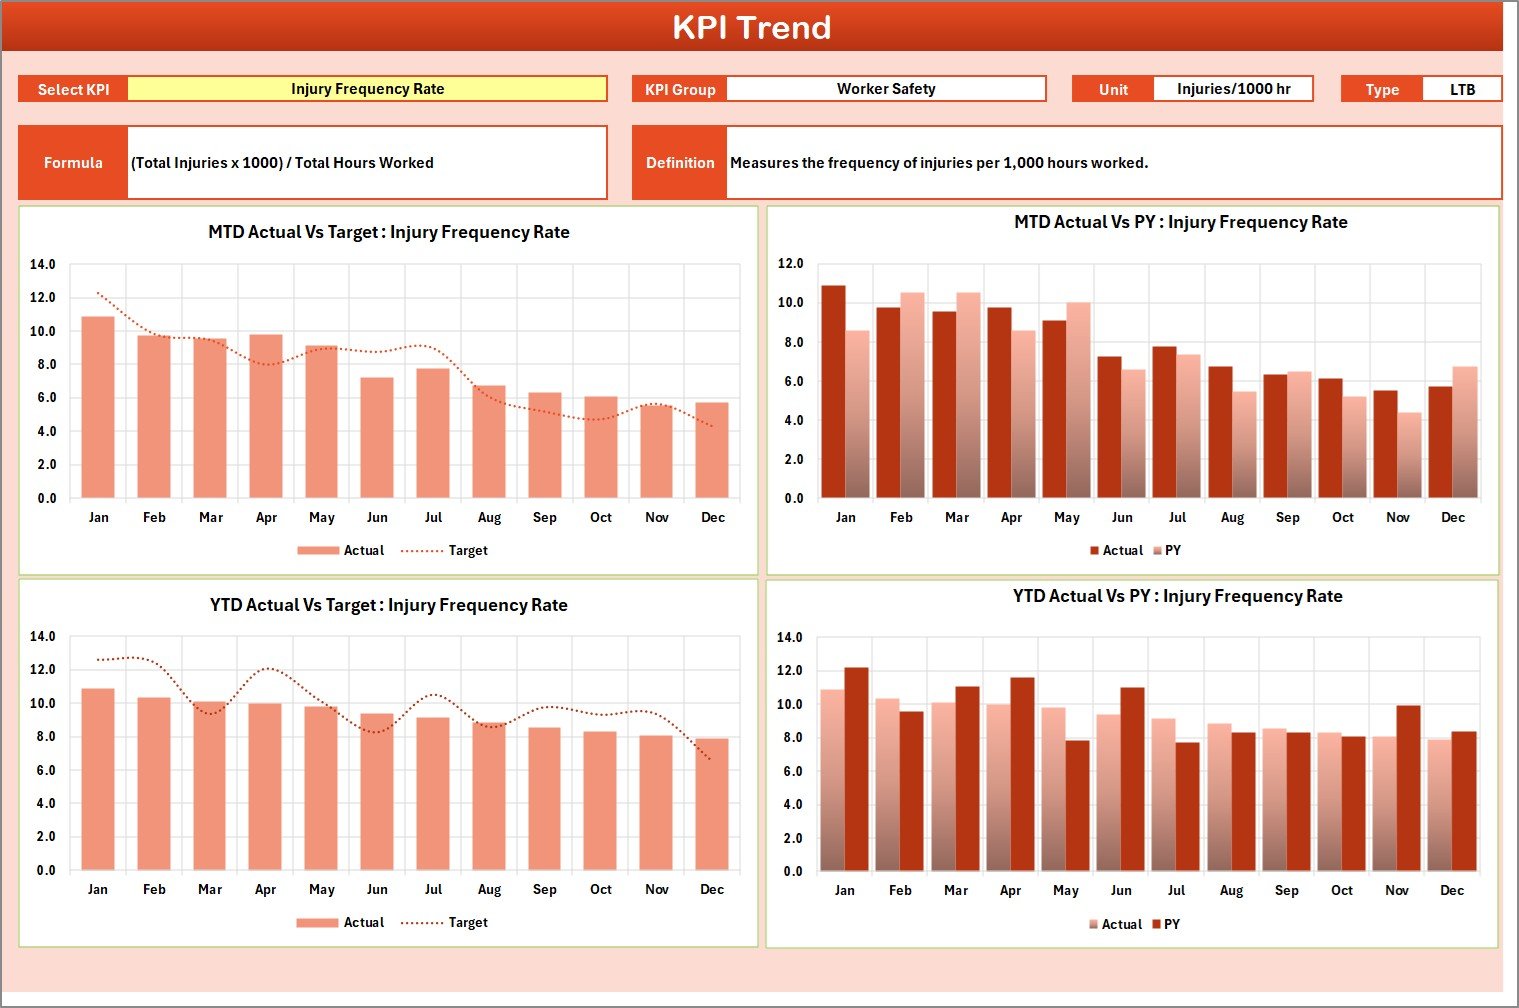
While the Scorecard Sheet shows summary results, the KPI Trend Sheet provides detailed trend analysis.
How Does It Work?
You can select the KPI name from the dropdown available in cell C3.
Once selected, the sheet displays:
-
KPI Group
-
Unit of KPI
-
Type of KPI (Lower the Better or Upper the Better)
-
Formula
-
Definition
Additionally, the sheet shows:
-
MTD Trend Chart
-
YTD Trend Chart
-
Actual vs Target vs Previous Year comparison
Therefore, you can analyze safety performance over time.
For example, if the Lost Time Injury Frequency Rate increases for two consecutive months, you can immediately implement corrective measures.
Click to Purchases Construction Safety KPI Scorecard in Excel
3️⃣ Input Data Sheet – Central Data Entry Area
The Input Data Sheet acts as the foundation of the scorecard.
What Can You Do Here?
-
Enter actual safety data
-
Set targets
-
Record monthly metrics
-
Update compliance scores
Once you update the data, the scorecard reflects changes automatically.
Therefore, you always maintain up-to-date safety performance reports.
Click to Purchases Construction Safety KPI Scorecard in Excel
4️⃣ KPI Definition Sheet – Standardized Safety Metrics
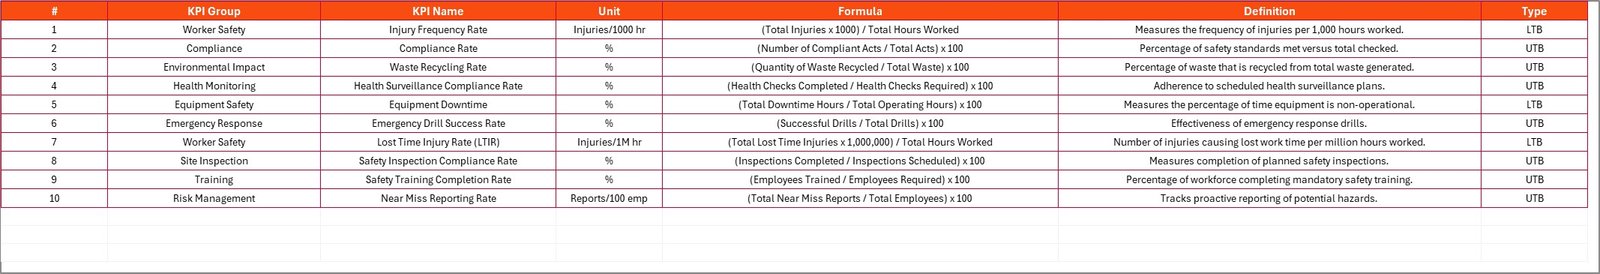
Clear KPI definitions ensure consistency across sites.
In this sheet, you enter:
-
KPI Name
-
KPI Group
-
Unit
-
Formula
-
KPI Definition
For example:
-
Incident Rate = (Total Incidents / Total Work Hours) × 200,000
-
Safety Training Hours per Worker = Total Training Hours / Number of Workers
When you define KPIs clearly, all departments follow the same measurement standards.
What Are the Most Important Construction Safety KPIs?
Construction projects require monitoring across multiple safety dimensions.
🔹 Incident KPIs
-
Total Recordable Incident Rate (TRIR)
-
Lost Time Injury Frequency Rate (LTIFR)
-
Near Miss Reports
-
First Aid Cases
-
Fatality Rate
🔹 Compliance KPIs
-
Safety Audit Score
-
PPE Compliance Rate
-
Toolbox Talk Completion Rate
-
Inspection Completion Rate
🔹 Training KPIs
-
Safety Training Hours
-
Training Attendance Rate
-
Certification Compliance Rate
🔹 Operational Safety KPIs
-
Equipment Inspection Compliance
-
Hazard Reporting Rate
-
Corrective Action Closure Rate
Tracking these KPIs helps reduce accidents and improve site safety culture.
Click to Purchases Construction Safety KPI Scorecard in Excel
Advantages of Construction Safety KPI Scorecard in Excel
A structured KPI scorecard provides several benefits.
1️⃣ Improved Safety Visibility
You can monitor all safety metrics in one centralized dashboard.
2️⃣ Faster Decision Making
When you view performance instantly, you can act quickly.
3️⃣ Reduced Incident Rates
Regular monitoring encourages proactive safety management.
4️⃣ Better Regulatory Compliance
Accurate tracking helps maintain compliance with safety regulations.
5️⃣ Increased Worker Awareness
When teams review KPIs regularly, they stay more alert and responsible.
6️⃣ Cost Savings
Fewer accidents mean fewer compensation claims and project delays.
Click to Purchases Construction Safety KPI Scorecard in Excel
Best Practices for the Construction Safety KPI Scorecard
To maximize results, follow these best practices.
✔ Define KPIs Clearly
Ensure each KPI includes a simple formula and definition.
✔ Update Data Regularly
Enter data weekly or monthly to maintain accuracy.
✔ Set Realistic Safety Targets
Base targets on historical performance and industry benchmarks.
✔ Conduct Monthly Safety Reviews
Review KPI trends during safety meetings.
✔ Encourage Worker Participation
Promote hazard reporting and near-miss documentation.
✔ Use Data to Take Action
Do not track numbers only. Implement corrective actions based on trends.
How Does This Scorecard Improve Construction Project Performance?
When you track safety KPIs regularly:
-
You reduce accident frequency
-
You improve site discipline
-
You increase worker morale
-
You avoid regulatory penalties
-
You protect company reputation
Consequently, projects run smoothly and efficiently.
Conclusion
Construction safety requires constant monitoring. Without structured tracking, risks increase quickly.
The Construction Safety KPI Scorecard in Excel provides:
-
Centralized safety monitoring
-
MTD and YTD comparison
-
Trend analysis
-
Visual performance indicators
-
Customizable KPI structure
Instead of relying on manual safety logs, you can use one organized system to manage safety performance effectively.
If you want to reduce incidents, strengthen compliance, and build a strong safety culture, this scorecard offers a practical and powerful solution.
Click to Purchases Construction Safety KPI Scorecard in Excel
Frequently Asked Questions with Answers
1. What is a Construction Safety KPI Scorecard?
It is an Excel-based tool designed to track safety performance metrics such as incident rates, compliance scores, and training hours.
2. Can small contractors use this template?
Yes. Small and large construction companies can use this scorecard easily.
3. Does it support MTD and YTD tracking?
Yes. The template allows Month-to-Date and Year-to-Date performance analysis.
4. Can I add new safety KPIs?
Yes. You can add or modify KPIs according to your project needs.
5. Do I need advanced Excel skills?
No. Basic Excel knowledge is enough to use the template effectively.
Click to Purchases Construction Safety KPI Scorecard in Excel
Visit our YouTube channel to learn step-by-step video tutorials