Modern manufacturing industries increasingly depend on data to stay competitive. Synthetic fiber manufacturers must continuously monitor production efficiency, quality metrics, operational performance, and business outcomes. However, many organizations still rely on disconnected spreadsheets and manual reporting systems. As a result, decision-makers often struggle to identify performance issues quickly.
Therefore, companies now adopt intelligent dashboards that transform raw operational data into meaningful insights. One powerful solution is the Synthetic Fibers KPI Dashboard in Power BI — a ready-to-use analytics dashboard designed to monitor manufacturing KPIs using interactive visuals and automated calculations.
In this detailed guide, you will learn everything about the Synthetic Fibers KPI Dashboard in Power BI, including its features, structure, advantages, implementation steps, best practices, and frequently asked questions.
Click to Purchases Synthetic Fibers KPI Dashboard in Power BI
What Is a Synthetic Fibers KPI Dashboard in Power BI?
A Synthetic Fibers KPI Dashboard in Power BI is an interactive business intelligence solution that tracks manufacturing performance using Key Performance Indicators (KPIs).
Instead of reviewing multiple Excel files or static reports, managers can monitor all KPIs in one centralized dashboard. Consequently, teams gain real-time visibility into performance trends and take faster corrective actions.
Moreover, the dashboard captures data from an Excel data source, which makes implementation simple and flexible. Because Power BI converts data into dynamic visuals, organizations analyze performance more effectively.
Why Do Synthetic Fiber Manufacturers Need KPI Dashboards?
Synthetic fiber production includes complex processes such as polymer preparation, spinning, stretching, finishing, and packaging. Each stage generates performance data that influences productivity and quality.
Without structured monitoring:
-
Performance gaps remain hidden
-
Targets become difficult to track
-
Historical comparisons take longer
-
Decision-making slows down
However, a KPI dashboard solves these challenges by presenting insights visually and instantly.
Key Benefits of KPI Monitoring
-
Faster operational analysis
-
Improved production planning
-
Clear performance accountability
-
Data-driven management decisions
-
Continuous performance improvement
Therefore, KPI dashboards become essential tools for modern manufacturing organizations.
Click to Purchases Synthetic Fibers KPI Dashboard in Power BI
Key Features of the Synthetic Fibers KPI Dashboard in Power BI
This ready-to-use dashboard contains three interactive pages inside the Power BI Desktop application. Each page serves a specific analytical purpose.
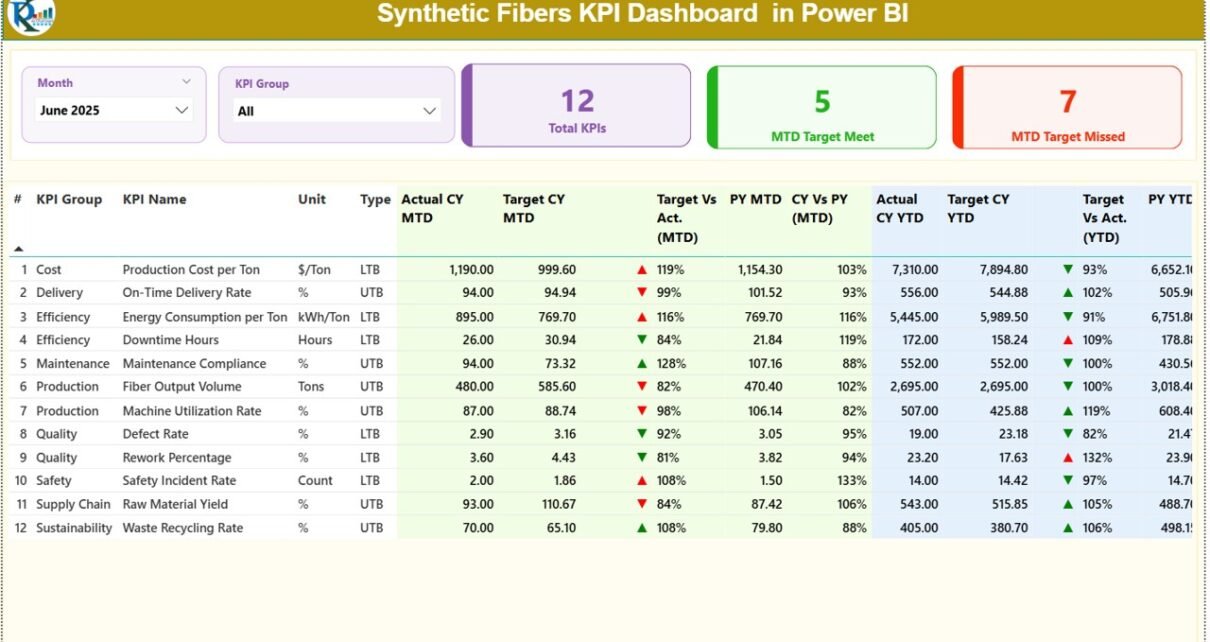
1️⃣ Summary Page – Central Performance Overview
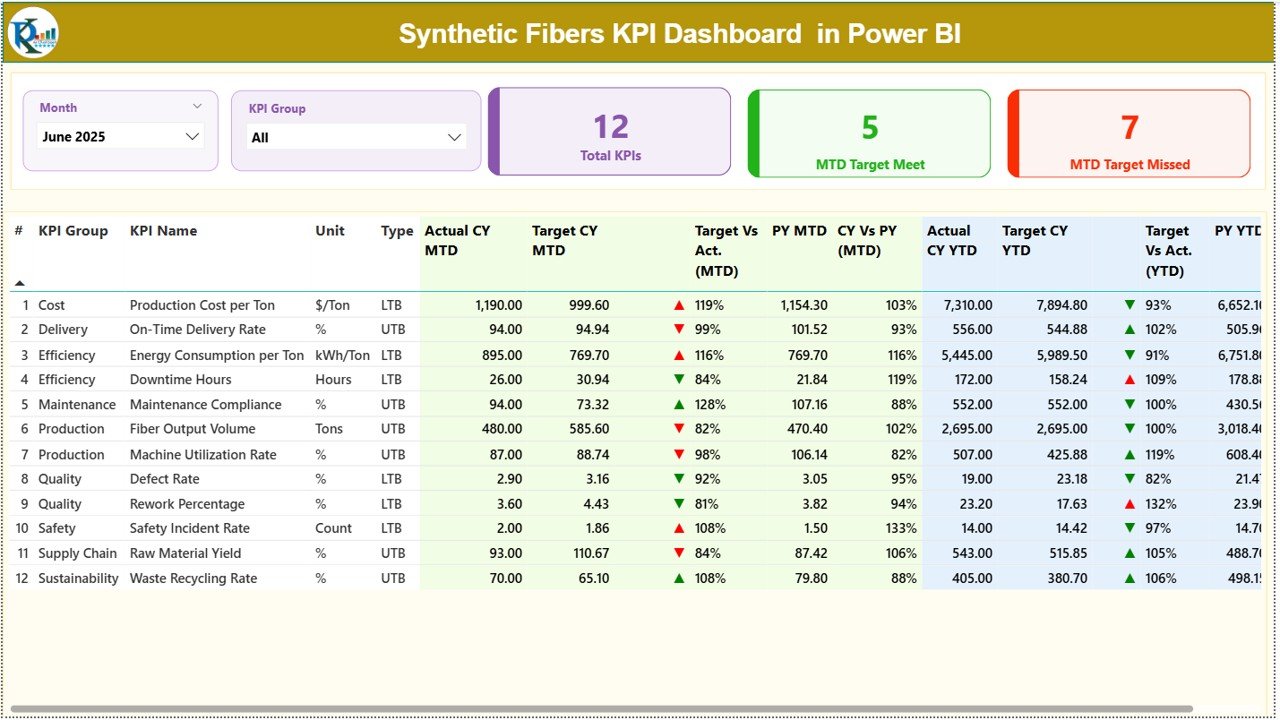
The Summary Page acts as the main interface of the dashboard. Users can analyze overall KPI performance at a glance.
Interactive Controls
At the top of the dashboard, users find:
-
Month Slicer
-
KPI Group Slicer
These filters allow dynamic analysis based on selected criteria.
KPI Performance Cards
Three KPI cards display quick performance insights:
-
Total KPI Count
-
MTD Target Meet Count
-
MTD Target Missed Count
Because these cards summarize performance instantly, managers quickly understand operational health.
Detailed KPI Performance Table
Below the cards, a structured table displays comprehensive KPI information.
KPI Details Included
-
KPI Number – Sequential identifier
-
KPI Group – Category of KPI
-
KPI Name – Performance metric name
-
Unit – Measurement unit
-
Type – LTB (Lower the Better) or UTB (Upper the Better)
MTD Performance Metrics
The dashboard tracks Month-to-Date performance using:
-
Actual CY MTD
-
Target CY MTD
-
MTD Status Icons (▲ Green / ▼ Red)
-
Target vs Actual Percentage
-
Previous Year MTD
-
Current Year vs Previous Year Comparison
The system calculates performance using:
Actual ÷ Target (MTD)
As a result, users instantly identify whether KPIs meet targets.
YTD Performance Metrics
Similarly, the dashboard evaluates Year-to-Date performance.
Displayed metrics include:
-
Actual CY YTD
-
Target CY YTD
-
YTD Status Icons
-
Target vs Actual (YTD %)
-
Previous Year YTD
-
CY vs PY Comparison
Because both MTD and YTD views exist together, users analyze short-term and long-term performance simultaneously.
Click to Purchases Synthetic Fibers KPI Dashboard in Power BI
2️⃣ KPI Trend Page – Performance Trend Analysis
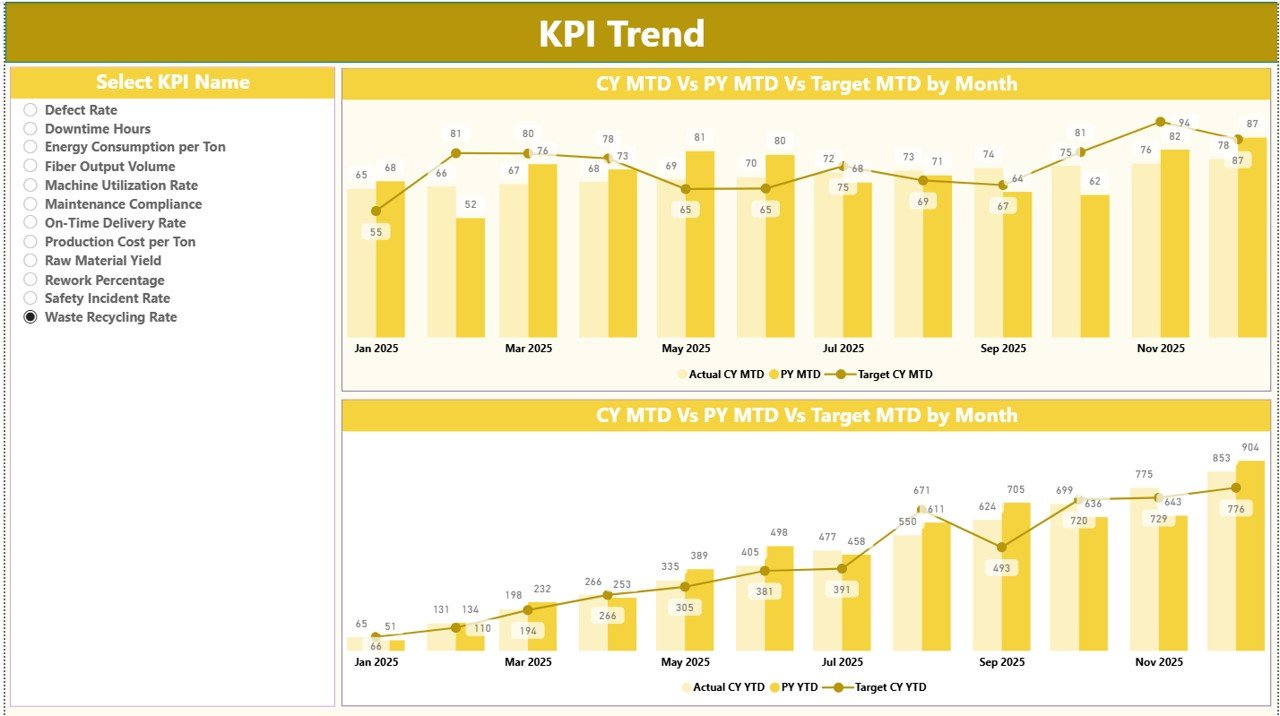
While the Summary Page provides an overview, the KPI Trend Page focuses on detailed analysis.
Interactive KPI Selection
A slicer on the left allows users to select any KPI.
Once selected, charts update automatically.
Combo Charts Included
Two powerful combo charts display:
-
Current Year Actual Values
-
Previous Year Values
-
Target Values
Charts exist for both:
-
MTD Trends
-
YTD Trends
Therefore, managers easily identify patterns, growth trends, and performance fluctuations.
3️⃣ KPI Definition Page – Drill-Through Insights
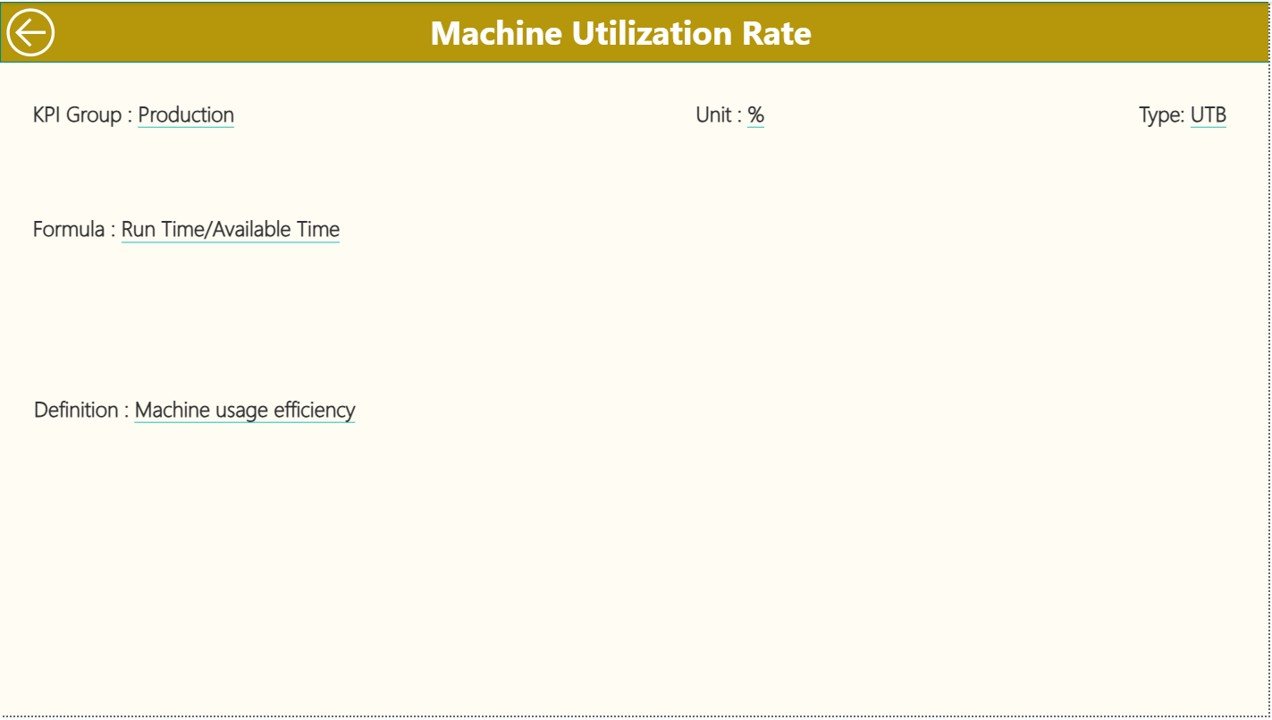
The KPI Definition Page serves as a hidden drill-through page.
Users can access it directly from the Summary Page.
Information Available
-
KPI Formula
-
KPI Definition
-
KPI Structure Details
To return to the main page, users simply click the Back Button located in the top-left corner.
Because this page remains hidden, the dashboard maintains a clean and professional interface.
Click to Purchases Synthetic Fibers KPI Dashboard in Power BI
Excel Data Source Structure
The dashboard uses an Excel file as its backend data source. This design simplifies data management and updates.
Users must populate three worksheets.
1️⃣ Input_Actual Sheet
In this sheet, users enter actual KPI performance values.
Required fields include:
-
KPI Name
-
Month (First date of the month)
-
MTD Numbers
-
YTD Numbers
Once updated, Power BI refreshes visuals automatically.
2️⃣ Input_Target Sheet
This sheet stores planned KPI targets.
Users must enter:
-
KPI Name
-
Month
-
MTD Target Values
-
YTD Target Values
Consequently, the dashboard compares performance against goals.
3️⃣ KPI Definition Sheet
This sheet defines KPI structure.
Fields include:
-
KPI Number
-
KPI Group
-
KPI Name
-
Unit
-
Formula
-
Definition
-
Type (LTB or UTB)
Because definitions remain centralized, reporting stays consistent.
How Does the Dashboard Improve Manufacturing Decisions?
Power BI transforms numbers into interactive insights. Therefore, leaders understand performance instantly.
Faster Problem Identification
Managers quickly detect underperforming KPIs.
Better Strategic Planning
Trend analysis supports accurate forecasting.
Improved Transparency
Teams clearly see performance expectations.
Data-Driven Culture
Organizations shift from guesswork to analytics.
As a result, operational efficiency improves significantly.
Advantages of Synthetic Fibers KPI Dashboard in Power BI
✅ Interactive Visualization
Dynamic charts make analysis simple and engaging.
✅ Real-Time Insights
Data refresh enables updated performance tracking.
✅ Automated Calculations
Power BI handles complex calculations automatically.
✅ Centralized Reporting
All KPIs appear in one dashboard.
✅ Improved Productivity
Teams spend less time preparing reports.
✅ Scalable Solution
Organizations easily expand KPIs as operations grow.
Click to Purchases Synthetic Fibers KPI Dashboard in Power BI
How to Implement the Synthetic Fibers KPI Dashboard?
Successful implementation requires structured planning.
Step 1: Define Manufacturing Goals
Identify production and quality objectives.
Step 2: Select Relevant KPIs
Focus on measurable performance indicators.
Step 3: Prepare Excel Data
Fill Actual, Target, and Definition sheets.
Step 4: Connect Data to Power BI
Load Excel data into Power BI Desktop.
Step 5: Refresh Data Regularly
Update monthly performance numbers.
Step 6: Review KPI Trends
Analyze charts to identify improvement areas.
Following these steps ensures effective dashboard usage.
Best Practices for the Synthetic Fibers KPI Dashboard
✔ Keep Data Accurate
Validate inputs before refreshing reports.
✔ Use Standard KPI Definitions
Maintain consistency across departments.
✔ Review KPIs Monthly
Regular reviews improve decision-making.
✔ Focus on Actionable Metrics
Track KPIs linked directly to business goals.
✔ Train Dashboard Users
Ensure teams understand filters and visuals.
✔ Monitor Trends Instead of Single Values
Trend analysis reveals deeper insights.
Click to Purchases Synthetic Fibers KPI Dashboard in Power
What KPIs Should Synthetic Fiber Companies Track?
Production KPIs
-
Production Volume
-
Machine Utilization
-
Downtime Rate
Quality KPIs
-
Defect Percentage
-
Rejection Rate
-
Yarn Strength Consistency
Operational KPIs
-
Energy Consumption
-
Maintenance Compliance
Financial KPIs
-
Cost per Unit
-
Profit Margin
-
Inventory Efficiency
Balanced KPI tracking improves overall performance.
Click to Purchases Synthetic Fibers KPI Dashboard in Power BI
Why Choose Power BI for Manufacturing Dashboards?
Power BI offers several advantages over traditional reporting tools.
-
Interactive dashboards
-
Advanced analytics capabilities
-
Easy Excel integration
-
Drill-through analysis
-
Automated visual storytelling
Therefore, many manufacturers adopt Power BI as their primary analytics platform.
Who Can Use This Dashboard?
This dashboard benefits multiple stakeholders:
-
Production Managers
-
Plant Heads
-
Operations Analysts
-
Quality Control Teams
-
Business Intelligence Professionals
-
Manufacturing Consultants
Each user gains actionable insights tailored to their role.
Future of KPI Dashboards in Manufacturing
Manufacturing analytics continues evolving rapidly. In the future, KPI dashboards will integrate with:
-
IoT-enabled machines
-
Predictive maintenance systems
-
AI-driven forecasting tools
-
Real-time production monitoring
Nevertheless, Power BI dashboards remain the foundation of modern performance analytics.
Conclusion
The Synthetic Fibers KPI Dashboard in Power BI provides a powerful and practical solution for monitoring manufacturing performance. It converts operational data into interactive visuals that support faster and smarter decision-making.
Because the dashboard combines automation, trend analysis, and drill-through insights, organizations gain complete visibility into KPI performance. Moreover, its Excel-based data structure ensures easy adoption and maintenance.
Therefore, synthetic fiber manufacturers that implement this dashboard strengthen operational control, improve productivity, and achieve sustainable growth.
Click to Purchases Synthetic Fibers KPI Dashboard in Power BI
Frequently Asked Questions (FAQs)
What is a KPI dashboard in Power BI?
A KPI dashboard in Power BI visually tracks performance indicators using interactive charts and automated calculations.
Can beginners use this dashboard?
Yes. Users only need to update Excel data sheets and refresh Power BI.
How often should KPI data be updated?
Organizations should update KPI data monthly for accurate performance tracking.
Does the dashboard support historical comparison?
Yes. It compares current performance with previous-year data automatically.
Can we customize KPIs?
Yes. Users can modify KPIs through the KPI Definition sheet.
Is Power BI suitable for manufacturing analytics?
Absolutely. Power BI provides advanced visualization and analytics ideal for industrial performance monitoring.
Click to Purchases Synthetic Fibers KPI Dashboard in Power BI
Visit our YouTube channel to learn step-by-step video tutorials