In today’s rapidly evolving financial ecosystem, microfinance institutions (MFIs) play a crucial role in supporting small businesses, rural entrepreneurs, and financially underserved communities. However, managing thousands of loans, repayments, branches, and regional operations becomes challenging without proper analytics.
Therefore, financial organizations increasingly rely on data-driven dashboards to monitor performance efficiently. One of the most powerful solutions available today is the Microfinance Institutions Dashboard in Power BI.
Click to Purchases Microfinance Institutions Dashboard in Power BI
This comprehensive guide explains everything you need to know about the Microfinance Institutions Dashboard in Power BI, including its features, benefits, structure, analysis capabilities, best practices, and frequently asked questions.
What Is a Microfinance Institutions Dashboard in Power BI?
A Microfinance Institutions Dashboard in Power BI is an interactive business intelligence solution designed to track, analyze, and monitor microfinance operations using dynamic visual reports.
Instead of reviewing multiple spreadsheets and static reports, decision-makers can analyze all financial metrics in one centralized platform. As a result, organizations improve loan monitoring, reduce financial risks, and make faster strategic decisions.
Moreover, Power BI automatically updates visuals when data changes. Consequently, managers always work with accurate and real-time information.
Typically, this dashboard tracks:
-
Loan distribution performance
-
Interest rate trends
-
Repayment performance
-
Outstanding balances
-
Branch and regional performance
-
Monthly financial trends
Why Do Microfinance Institutions Need a Power BI Dashboard?
Click to Purchases Microfinance Institutions Dashboard in Power BI
Microfinance institutions manage complex financial activities daily. While traditional reporting methods consume time, dashboards simplify analysis.
Key challenges without dashboards:
-
Difficulty tracking loan repayment trends
-
Lack of centralized reporting
-
Delayed decision-making
-
Limited branch performance visibility
-
Increased operational risks
However, Power BI dashboards solve these problems effectively.
Because leaders receive real-time insights, they can quickly identify risks and opportunities. Furthermore, teams collaborate better when everyone views the same performance indicators.
Key Features of the Microfinance Institutions Dashboard in Power BI
This dashboard contains five interactive pages, each designed to analyze financial performance from a different perspective.
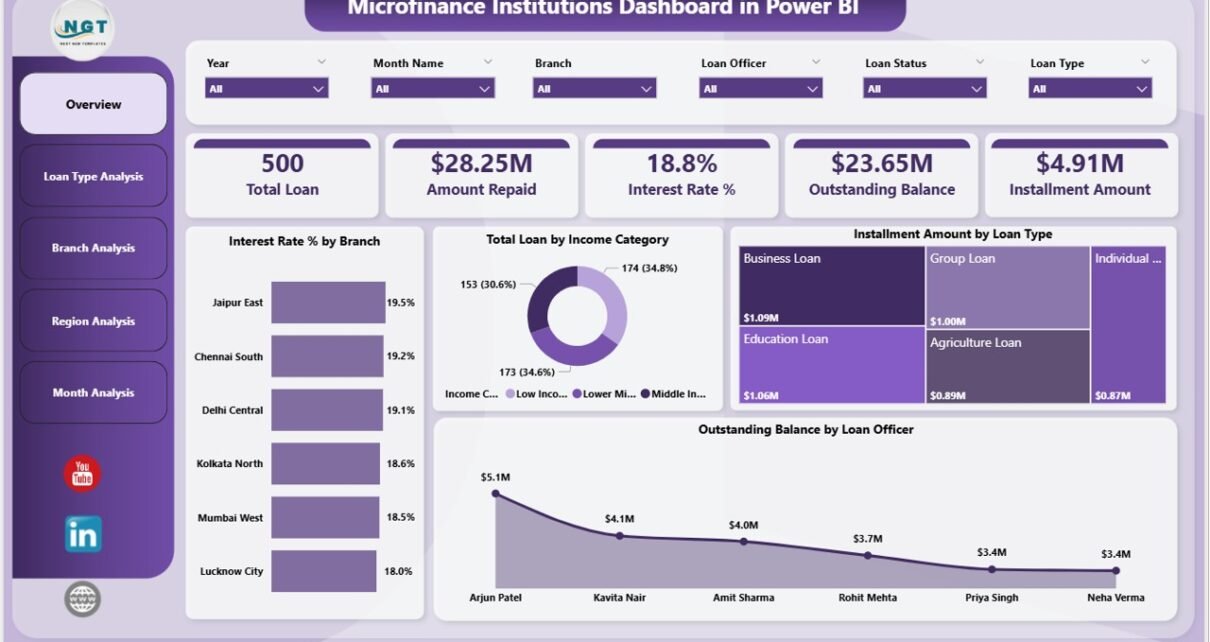
1. Overview Page – How Can You Monitor Overall Performance Quickly?
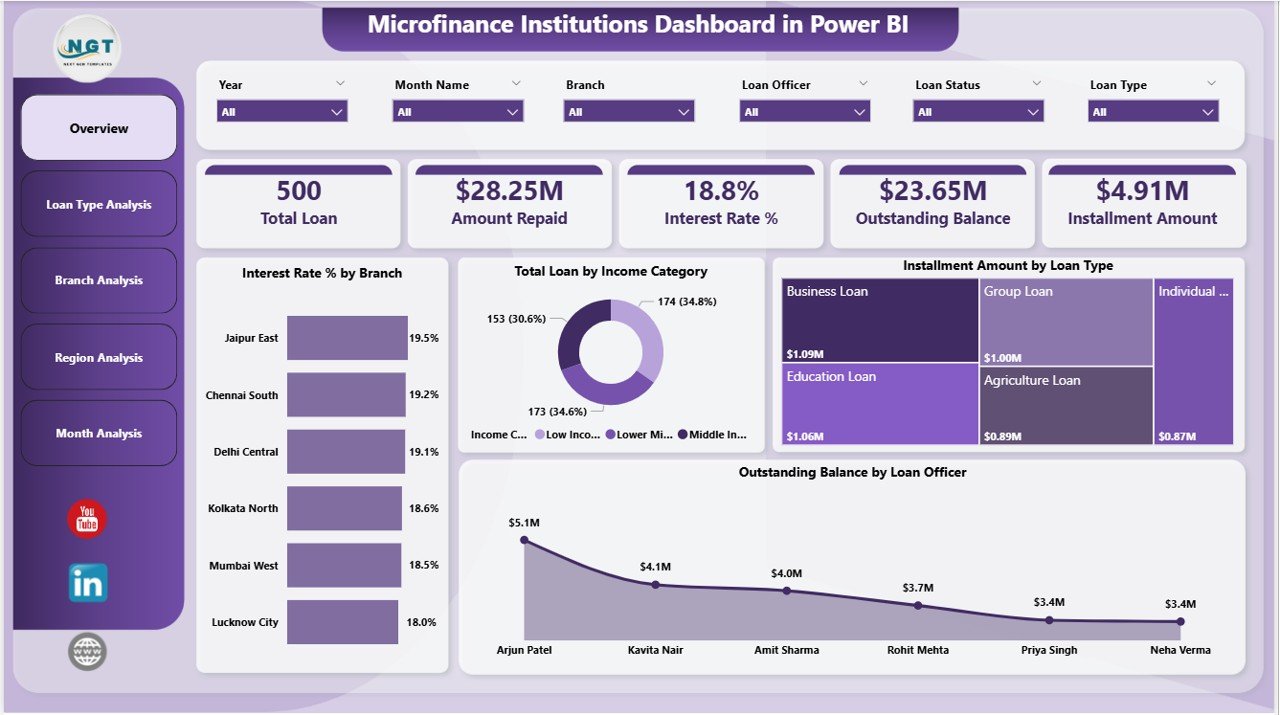
The Overview Page acts as the central control panel of the dashboard. Here, users immediately understand institutional performance through summarized visuals.
Key elements included:
-
Interactive slicers for dynamic filtering
-
KPI cards displaying major financial indicators
-
High-level performance summaries
Main KPI Cards:
-
Interest Rate % by Branch
-
Total Loan by Income Category
-
Instalment Amount by Loan Type
-
Outstanding Balance by Loan Officer
Because all critical metrics appear on one screen, executives can quickly evaluate operational health.
Additionally, users can filter data instantly using slicers, which allows faster comparisons between branches, regions, or loan categories.
Click to Purchases Microfinance Institutions Dashboard in Power BI
2. Loan Type Analysis – Which Loan Categories Perform Best?
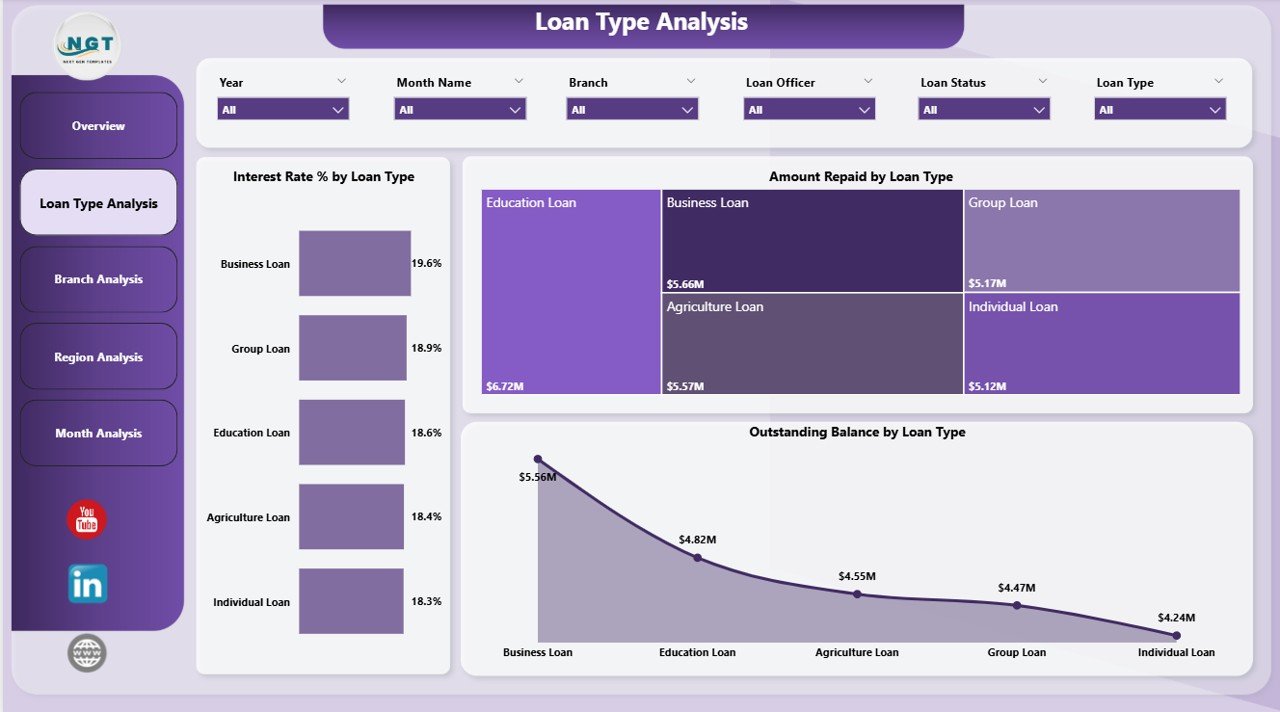
The Loan Type Analysis Page focuses on loan product performance. Since different loan types carry different risk levels, this page helps institutions optimize lending strategies.
Charts included:
-
Interest Rate % by Loan Type
-
Amount Repaid by Loan Type
-
Outstanding Balance by Loan Type
Insights you can gain:
-
Identify high-performing loan products
-
Compare repayment efficiency
-
Detect risky loan categories
-
Optimize interest rate structures
As a result, institutions can adjust lending policies based on data rather than assumptions.
3. Branch Analysis – How Do Individual Branches Perform?
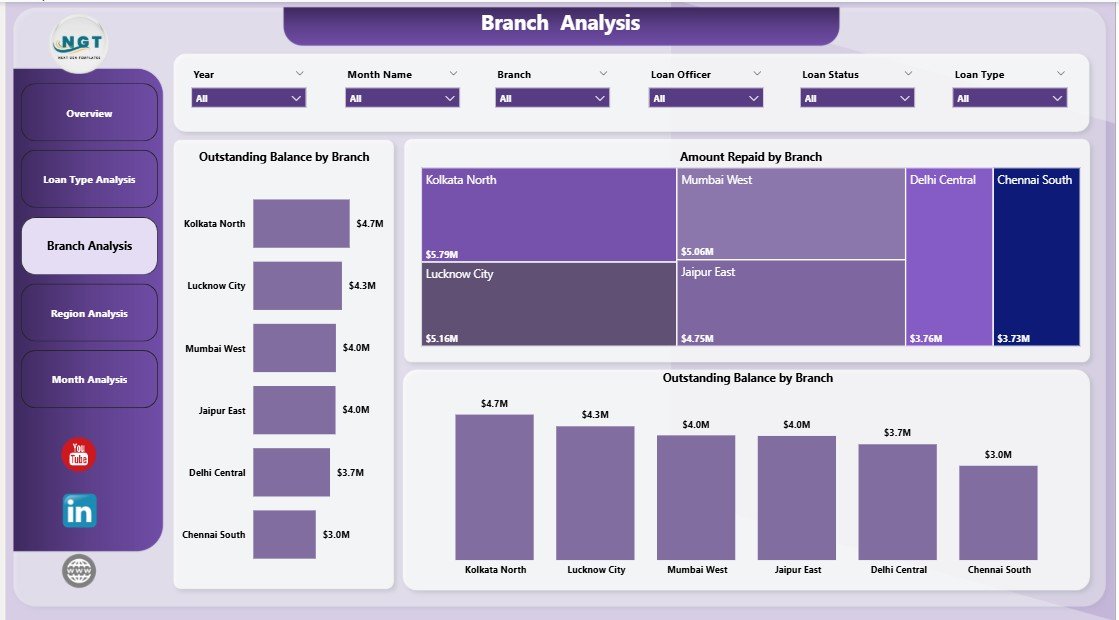
Branch-level monitoring remains essential for microfinance success. Therefore, the Branch Analysis Page evaluates operational performance across branches.
Charts available:
-
Total Loan by Branch
-
Amount Repaid by Branch
-
Outstanding Balance by Branch
Benefits of branch analysis:
-
Compare branch productivity
-
Identify underperforming locations
-
Monitor repayment behavior
-
Improve accountability
Because managers can clearly see branch performance, they can implement targeted improvement strategies.
4. Region Analysis – Which Regions Generate Strong Financial Results?
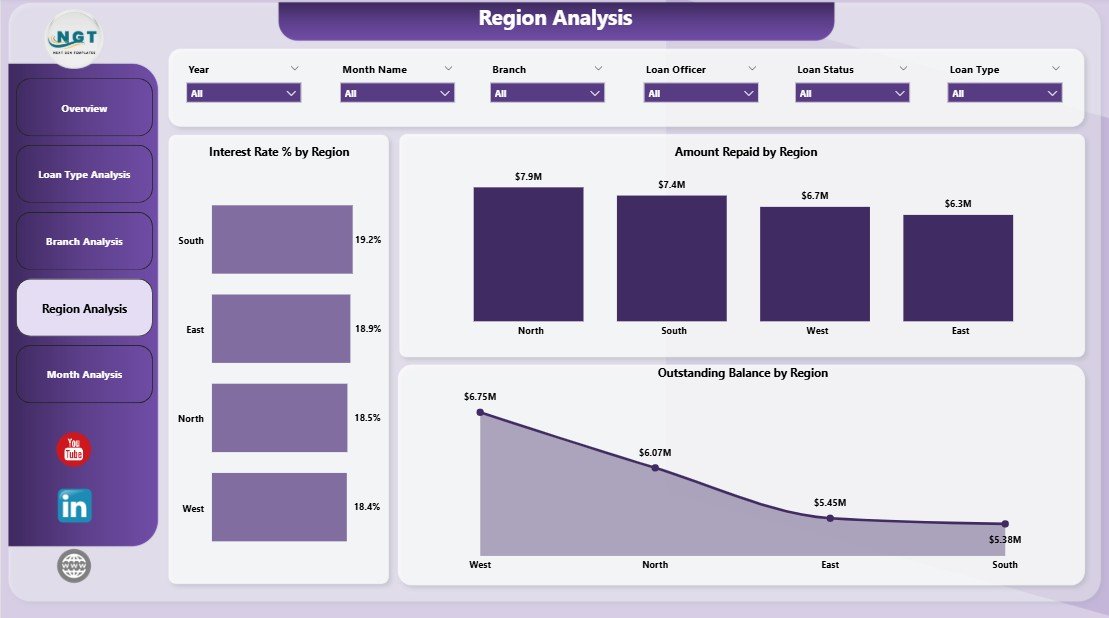
Microfinance institutions often operate across multiple regions. Consequently, regional analysis becomes critical for expansion planning.
Charts included:
Click to Purchases Microfinance Institutions Dashboard in Power BI
-
Interest Rate % by Region
-
Amount Repaid by Region
-
Outstanding Balance by Region
Key insights:
-
Regional repayment patterns
-
Market performance comparison
-
Geographic risk identification
-
Expansion opportunity analysis
Furthermore, regional insights help organizations allocate resources effectively.
5. Month Analysis – How Do Financial Trends Change Over Time?
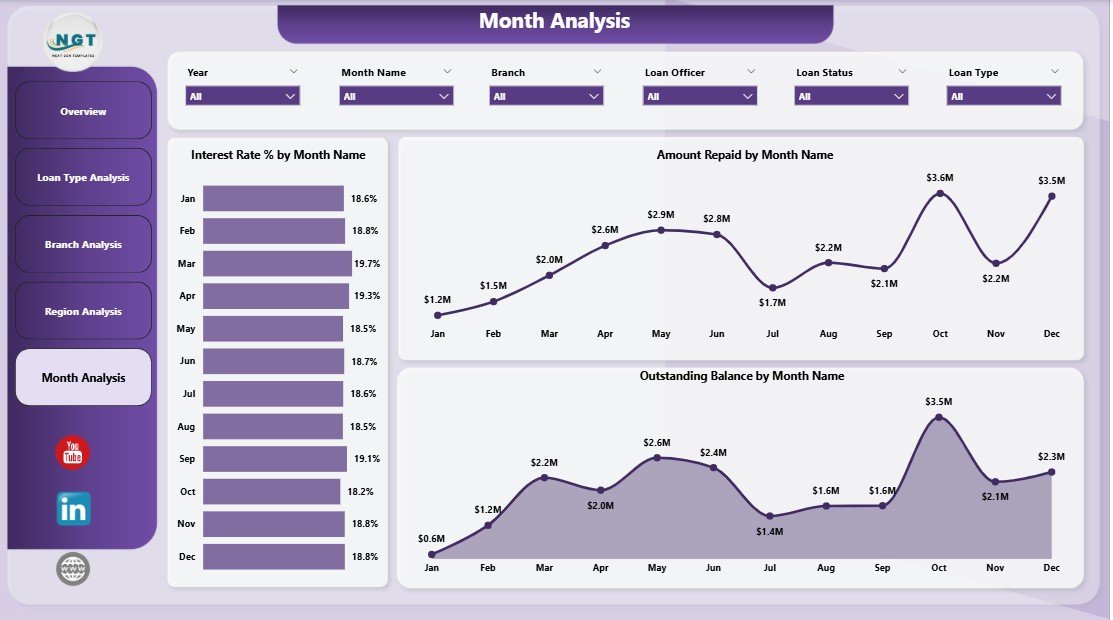
Financial performance evolves monthly. Therefore, the Month Analysis Page tracks trends across time periods.
Charts displayed:
-
Interest Rate % by Month
-
Amount Repaid by Month
-
Outstanding Balance by Month
Why monthly analysis matters:
-
Track seasonal loan behavior
-
Monitor repayment cycles
-
Forecast future cash flow
-
Identify early warning signs
Because trends become visible instantly, leaders can act before problems escalate.
How Does Power BI Improve Microfinance Decision-Making?
Power BI transforms raw financial data into actionable insights.
Key decision-making improvements:
-
Faster reporting cycles
-
Real-time financial monitoring
-
Data-driven lending decisions
-
Improved transparency
-
Better risk management
Additionally, visual analytics help non-technical users understand complex financial information easily.
Advantages of Microfinance Institutions Dashboard in Power BI
Organizations adopting this dashboard experience multiple operational benefits.
✅ Centralized Financial Monitoring
All loan and repayment data stays in one place. Therefore, teams avoid data confusion.
✅ Real-Time Insights
Managers immediately see updated financial performance.
✅ Improved Loan Risk Management
Institutions quickly identify loans with high outstanding balances.
✅ Enhanced Branch Accountability
Performance comparisons encourage operational efficiency.
✅ Better Strategic Planning
Leaders make informed expansion and lending decisions.
✅ Automated Reporting
Power BI eliminates manual reporting tasks.
How Does the Dashboard Help Loan Officers and Managers?
Click to Purchases Microfinance Institutions Dashboard in Power BI
Different roles benefit differently from the dashboard.
Loan Officers:
-
Track customer repayment status
-
Monitor outstanding balances
-
Improve follow-up strategies
Branch Managers:
-
Compare performance metrics
-
Monitor loan growth
-
Evaluate repayment efficiency
Senior Management:
-
Analyze regional performance
-
Monitor financial stability
-
Plan strategic growth
Because each stakeholder gains relevant insights, organizational alignment improves significantly.
Best Practices for the Microfinance Institutions Dashboard in Power BI
To achieve maximum value, organizations should follow proven implementation practices.
1. Maintain Clean Data
Always ensure accurate loan and repayment records.
2. Update Data Regularly
Frequent updates keep insights reliable.
3. Define Clear KPIs
Choose measurable indicators aligned with business goals.
4. Use Interactive Filters Wisely
Avoid excessive slicers that confuse users.
5. Train Staff Properly
Users must understand dashboard navigation.
6. Monitor Trends Consistently
Regular reviews help detect financial risks early.
7. Standardize Reporting Structure
Consistency improves decision-making across teams.
What KPIs Should Microfinance Institutions Track?
A strong dashboard focuses on meaningful indicators.
Essential KPIs include:
-
Loan disbursement value
-
Repayment amount
-
Interest rate performance
-
Outstanding balance ratio
-
Loan portfolio growth
-
Branch productivity
-
Regional loan performance
These KPIs provide a complete picture of institutional health.
How Does This Dashboard Support Financial Inclusion Goals?
Microfinance institutions aim to empower communities financially. Therefore, analytics plays an important role.
With better insights:
-
Institutions serve more borrowers responsibly
-
Loan risks decrease
-
Operational efficiency increases
-
Financial sustainability improves
Consequently, organizations expand their social impact while maintaining profitability.
Implementation Steps: How to Use the Dashboard Effectively?
Click to Purchases Microfinance Institutions Dashboard in Power BI
Follow these steps to maximize results:
-
Import loan data into Power BI.
-
Connect repayment datasets.
-
Configure relationships between tables.
-
Apply slicers for filtering.
-
Validate KPI calculations.
-
Publish dashboard to Power BI Service.
-
Share reports with stakeholders.
After implementation, organizations immediately benefit from automated analytics.
Future of Microfinance Analytics with Power BI
Technology continues transforming financial services. Therefore, dashboards will become even more intelligent.
Future enhancements may include:
-
AI-based loan risk prediction
-
Automated anomaly detection
-
Predictive repayment forecasting
-
Mobile analytics access
-
Real-time borrower insights
As analytics evolves, microfinance institutions gain stronger competitive advantages.
Conclusion
The Microfinance Institutions Dashboard in Power BI provides a powerful and practical solution for managing complex financial operations. Instead of relying on manual reports, institutions gain real-time insights through interactive visual analytics.
Because the dashboard combines overview, loan type, branch, region, and monthly analysis into one platform, decision-makers understand performance instantly. Moreover, organizations improve transparency, reduce risks, and strengthen financial sustainability.
Ultimately, adopting a Power BI dashboard enables microfinance institutions to operate smarter, serve communities better, and achieve long-term growth.
Frequently Asked Questions (FAQs)
1. What is a Microfinance Institutions Dashboard in Power BI?
It is an interactive analytics dashboard that helps monitor loans, repayments, interest rates, and financial performance using visual reports.
2. Who can use this dashboard?
Microfinance managers, financial analysts, branch managers, loan officers, and executives can use it.
3. Does the dashboard support real-time updates?
Yes. Power BI updates visuals automatically when connected data changes.
4. Can beginners use this dashboard?
Yes. The interface remains user-friendly and requires minimal technical knowledge.
5. What data is required to run the dashboard?
You need loan data, repayment information, branch details, and regional financial records.
6. Why is Power BI suitable for microfinance reporting?
Power BI offers interactive visuals, automation, scalability, and advanced analytics capabilities.
7. Can the dashboard be customized?
Yes. Organizations can modify KPIs, visuals, and filters based on operational needs.
Visit our YouTube channel to learn step-by-step video tutorials