Economic Development Boards Dashboard in Power BI is built for economic development boards, grant managers, public-sector analysts, regional development agencies, and consultants who need a clear way to report on funding, private investment, jobs, programs, sectors, and regional impact. Economic development reporting often involves many moving parts: projects, grants, funding sources, disbursement timing, job commitments, actual jobs created, businesses assisted, program areas, and board regions. When those numbers sit in separate files, board reporting becomes slow and difficult to explain.
This Power BI dashboard turns those records into five report pages with KPI cards, slicers, and visual analysis. It helps users answer practical questions: Are funds being disbursed at a healthy rate? Which regions have the strongest job commitments? Which sectors are attracting private investment? Which programs show the strongest impact score? You can download the template from Economic Development Boards Dashboard in Power BI. For official platform guidance, see Microsoft Learn’s Power BI Desktop documentation.
Key Features of Economic Development Boards Dashboard in Power BI
- Five Power BI report pages: Overview, Funding Analysis, Jobs Impact, Regional Analysis, and Program Insights.
- Executive KPI cards: Total Projects, Total Private Investment, Total Jobs Created, Total Jobs Committed, and Total Funds Disbursed.
- Multiple slicers: Filter the dashboard quickly by board region, program area, sector, funding source, month, and project status.
- Funding analysis: Compare total grant amount, total funds disbursed, funding source performance, and disbursement rate.
- Jobs and business impact: Review jobs created, jobs committed, total businesses assisted, and monthly employment movement.
- Regional and program insights: Compare board regions, project status, program areas, impact score, and private investment.
- Editable PBIX file: Customize visuals, fields, measures, data source settings, page names, and colors in Power BI Desktop.
Dashboard Pages Explanation
1. Overview Page
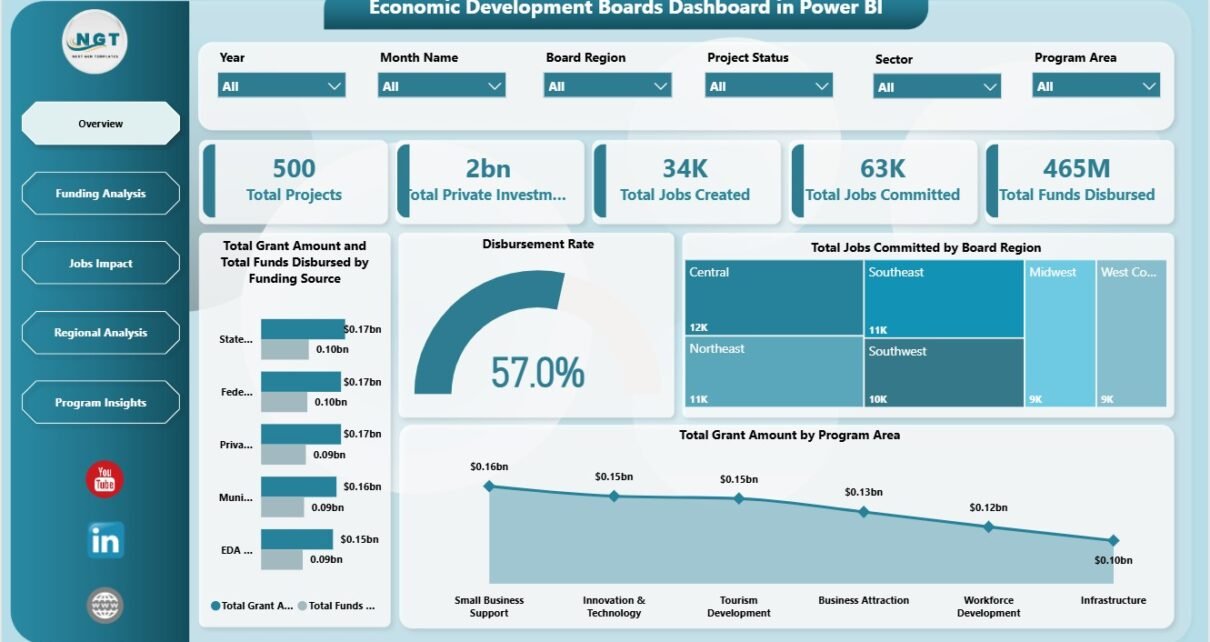
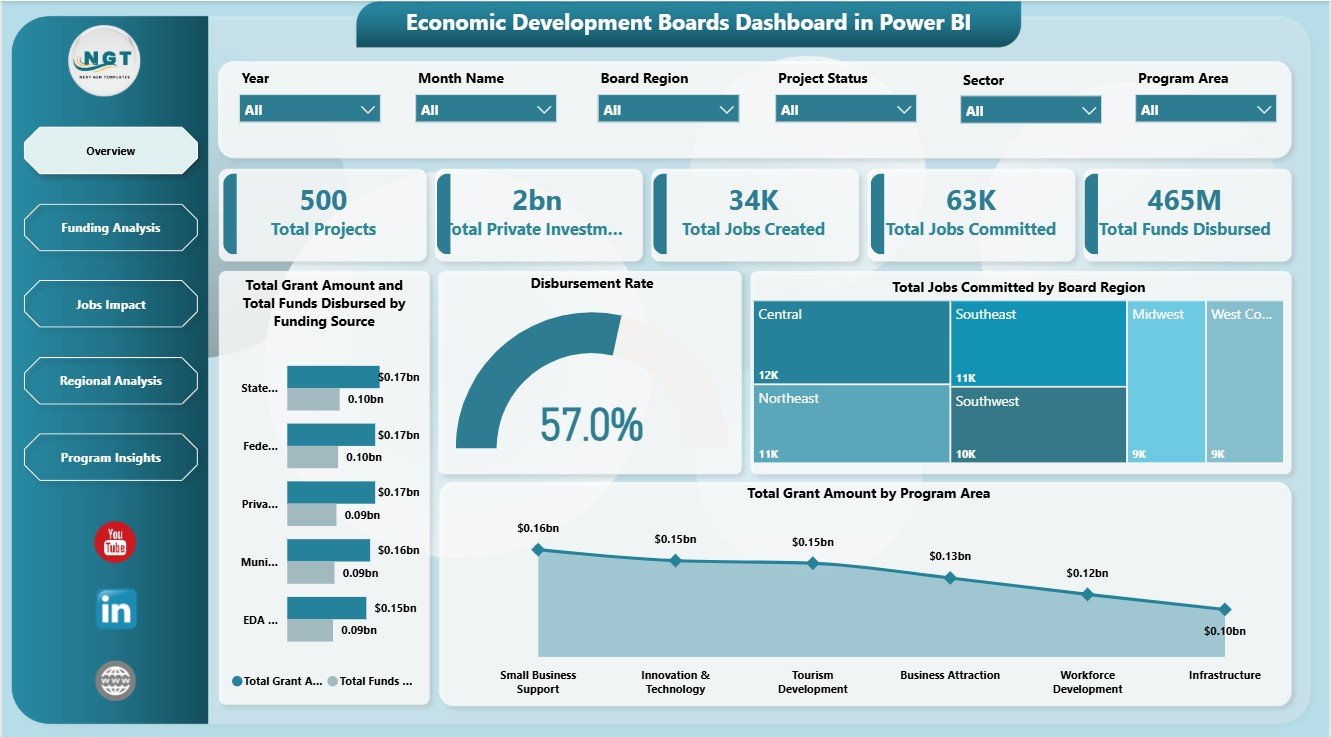
The Overview Page is the executive starting point for the dashboard. The top cards show Total Projects, Total Private Investment, Total Jobs Created, Total Jobs Committed, and Total Funds Disbursed. These cards help leadership understand project scale, investment value, employment impact, and funding execution before moving into deeper pages.
Total Grant Amount and Total Funds Disbursed by Funding Source: This chart compares approved grant funding against actual disbursement by source. It helps users identify whether a funding stream is moving from award to payout efficiently.
Disbursement Rate: This visual summarizes the percentage of approved funds that have been disbursed. It is useful for quickly spotting delays in grant execution.
Total Jobs Committed by Board Region: This chart shows planned job impact by board region. It helps decision-makers understand where employment commitments are concentrated.
Total Grant Amount by Program Area: This chart breaks grant funding across program areas. It supports conversations about whether funding aligns with economic development priorities.
2. Funding Analysis
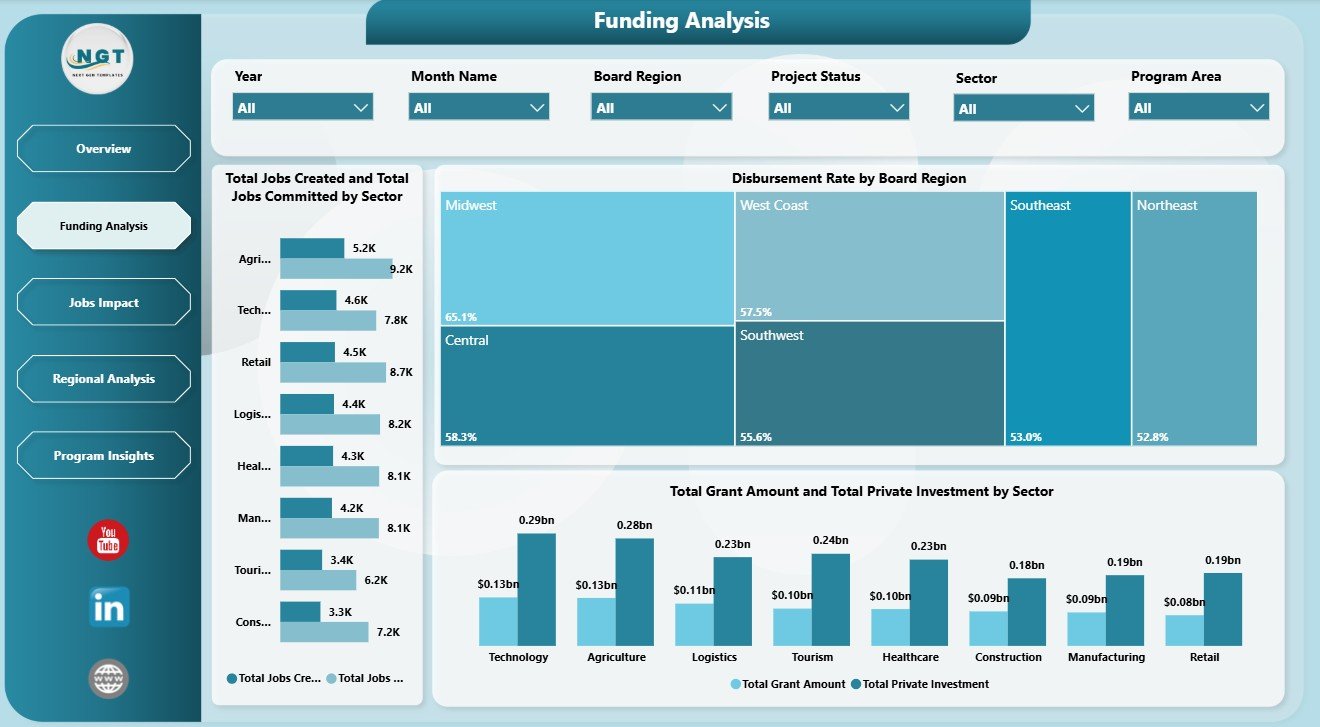
The Funding Analysis page focuses on how grants, disbursements, sectors, and investment connect. Total Jobs Created and Total Jobs Committed by Sector compares actual employment outcomes against planned commitments by industry or sector, helping teams see where promises are converting into results.
Disbursement Rate by Board Region compares funding execution across regions. If a region has many awards but a lower disbursement rate, managers can investigate project readiness, documentation, or approval delays. Total Grant Amount and Total Private Investment by Sector shows whether public grants are helping attract meaningful private capital by sector.
3. Jobs Impact
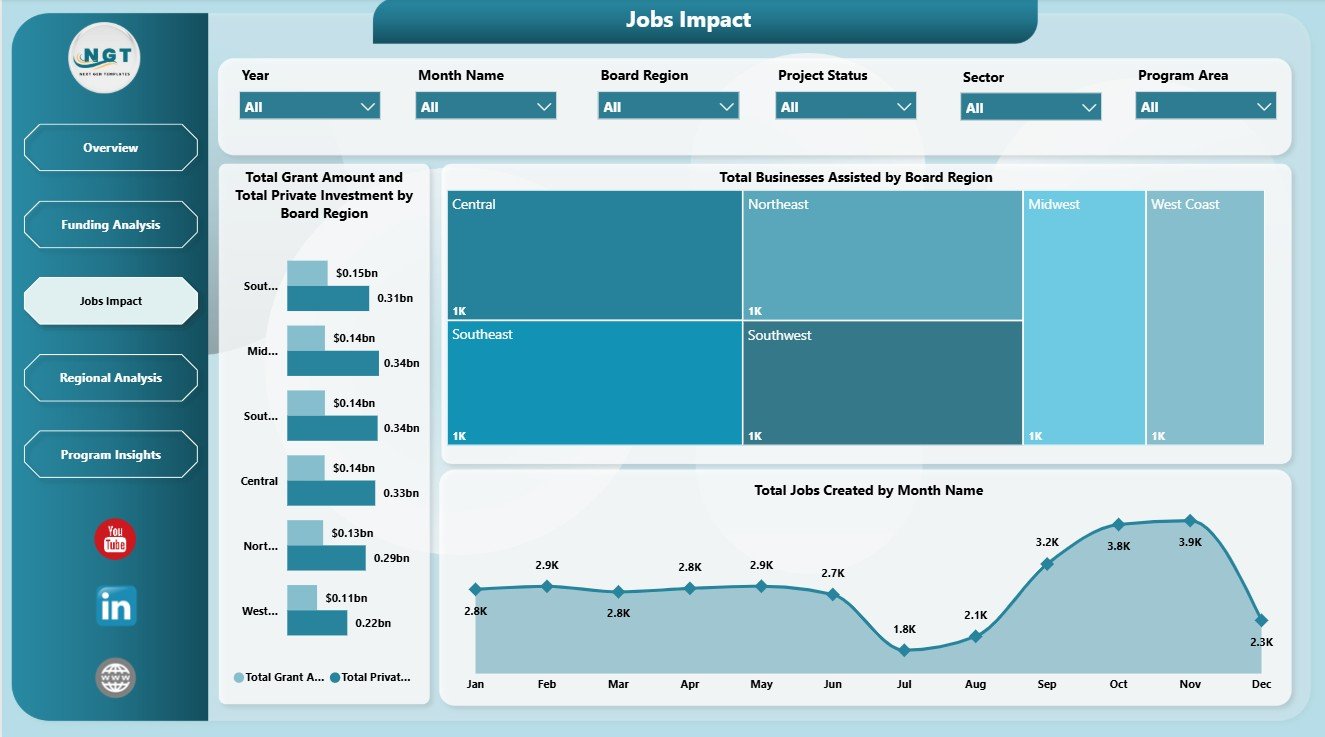
The Jobs Impact page connects funding decisions to employment and business support outcomes. Total Grant Amount and Total Private Investment by Board Region helps users compare public funding with private investment across regions, making it easier to show where economic support is encouraging business activity.
Total Businesses Assisted by Board Region shows where direct support is being delivered geographically. Total Jobs Created by Month Name gives a time-based view of employment outcomes, which is useful for monthly reviews, quarterly updates, and board packets.
4. Regional Analysis
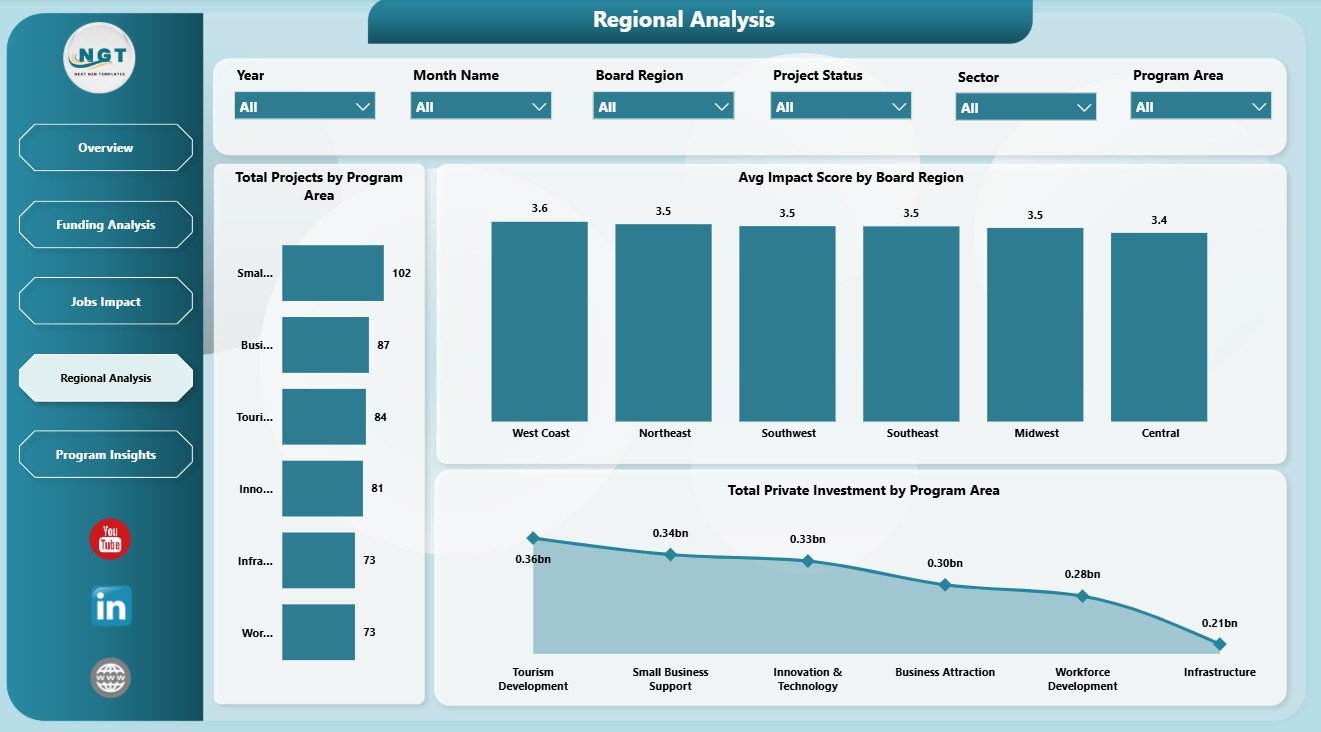
The Regional Analysis page is designed for comparing board regions and program activity. Total Projects by Program Area shows where project volume is concentrated. This helps teams understand whether resources and workload are balanced across economic development programs.
Avg Impact Score by Board Region gives a normalized measure for comparing regional outcomes beyond raw counts. Total Private Investment by Program Area shows which programs are attracting stronger private-sector response.
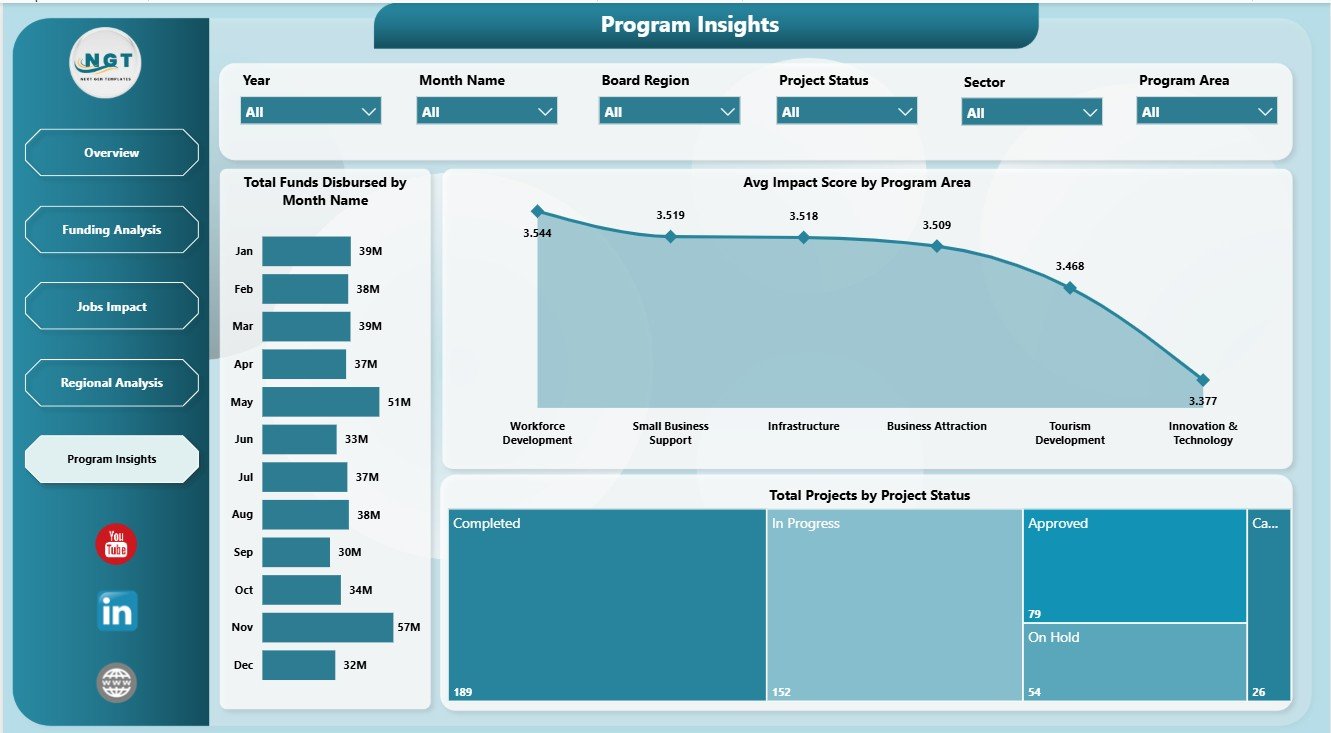
5. Program Insights
The Program Insights page supports program-level performance review. Total Funds Disbursed by Month Name shows how funding movement changes over time. This can help finance and grant teams prepare cash-flow discussions or explain payout timing.
Avg Impact Score by Program Area compares program quality and results. Total Projects by Project Status shows how many projects are active, completed, pending, delayed, or otherwise categorized, giving leaders a quick operational workload view.
Economic Development Boards Dashboard in Power BI vs. Tableau vs. Paid Grant SaaS – Feature Comparison
| Feature | This Power BI Dashboard | Tableau or Qlik Alternative | Paid Grant SaaS |
|---|---|---|---|
| Cost | $17.99 one-time | BI license or custom build cost | Recurring subscription or implementation fee |
| Platform | Power BI Desktop / Power BI Service | Separate BI platform setup | Vendor-hosted cloud app |
| Setup time | Open PBIX, replace data, refresh | Build model and visuals manually | Days or weeks of onboarding |
| Real-time team collaboration | Available after publishing to Power BI Service | Available through cloud setup | Usually included |
| Mobile access | Available through Power BI mobile if published | Available through vendor cloud | Usually included |
| Customizable fields | Editable report and model | Editable with BI skills | Limited by vendor settings |
| Share with link | Possible through Power BI permissions | Possible through cloud permissions | Usually login controlled |
| Year-1 cost at 5 users | $17.99 plus any Microsoft licensing | Usually much higher | Often hundreds or thousands |
| Economic development metrics | Built in across five pages | Must be designed | Depends on plan or module |
Who Should Use This Template
This template is useful for economic development boards, grant administrators, regional development agencies, government analysts, public-sector consultants, non-profit program managers, and Power BI users who already maintain structured data for projects, funding, jobs, sectors, regions, and programs.
It is not intended to replace a grant application portal, approval workflow, accounting system, CRM, payment system, or compliance platform. It works best as a reporting layer after your operational data has been exported or connected to Power BI.
Real-World Use Cases
Priya, regional board analyst: Priya uses the Overview and Regional Analysis pages before board meetings to explain project count, funds disbursed, jobs created, private investment, and regional impact score.
Michael, grant program manager: Michael reviews Funding Analysis to find regions or sectors where disbursement rates are lagging and where additional follow-up is needed.
Sofia, economic policy consultant: Sofia uses Jobs Impact and Program Insights to prepare client reports that connect funding, jobs, businesses assisted, project status, and program outcomes.
Advantages of Economic Development Boards Dashboard in Power BI
- Faster reporting: Start from a ready PBIX structure instead of building five report pages manually.
- Focused public-sector analysis: Pages are designed around grants, jobs, investment, regions, funding sources, and program areas.
- Better board conversations: KPI cards and charts help explain progress without searching through raw data.
- Editable design: Users can adjust visuals, model fields, slicers, measures, and layout in Power BI Desktop.
- One-time purchase: Useful for teams that need reporting without a recurring analytics subscription.
Opportunities for Improvement
The dashboard depends on clean data. Larger teams may want to connect it to governed databases, automate refresh in Power BI Service, add row-level security, or extend the model with demographic impact, wage growth, tax revenue, applicant pipeline, compliance milestones, or forecast measures. Teams needing case management should use this dashboard alongside their operational grants system.
Best Practices
- Keep source data column names and data types consistent before refreshing the report.
- Use standardized region, sector, program area, funding source, and project status names.
- Validate grant amount, funds disbursed, jobs committed, jobs created, and private investment totals before presentations.
- Review Overview first, then move into Funding Analysis, Jobs Impact, Regional Analysis, and Program Insights.
- Publish to Power BI Service only after checking Microsoft licensing, permissions, and data governance requirements.
Explore Relevant Templates
You can download this template from Economic Development Boards Dashboard in Power BI. Related templates include Economic Development Boards Dashboard in Excel, Economic Development Boards KPI Dashboard in Excel, Eco Lodges Dashboard in Power BI, and Digital Curriculum Startups Dashboard in Power BI.
Frequently Asked Questions
What is included in the Economic Development Boards Dashboard in Power BI?
The dashboard includes five report pages: Overview, Funding Analysis, Jobs Impact, Regional Analysis, and Program Insights.
What KPI cards are available on the Overview page?
The Overview page includes Total Projects, Total Private Investment, Total Jobs Created, Total Jobs Committed, and Total Funds Disbursed.
Can I use my own economic development data?
Yes. Replace the sample data or connect your approved data source, then refresh the PBIX file.
Can I customize charts and fields?
Yes. You can edit visuals, measures, fields, colors, slicers, page names, and source settings in Power BI Desktop.
Is this dashboard a grant management system?
No. It is a reporting dashboard, not a grant application portal, approval workflow, payment system, CRM, or compliance tool.
Can I share the dashboard online?
Yes, if your Microsoft account and organization permissions allow publishing to Power BI Service. Review data privacy and workspace permissions before sharing.
About the Author
Built by PK – Microsoft Certified Professional with 15+ years of Excel, Google Sheets, and Power BI experience. Founder of NextGenTemplates, reaching 300K+ subscribers across YouTube channels. Every template is hand-built and tested before release.
Conclusion
The Economic Development Boards Dashboard in Power BI gives public-sector and economic development teams a ready-made way to review grant funding, disbursement rate, projects, jobs, private investment, regions, sectors, and program performance. With five focused pages and editable Power BI visuals, it helps teams move from scattered reports to clearer board-ready analysis.
Click here to purchase the Economic Development Boards Dashboard in Power BI
Visit our YouTube channel for tutorials: YouTube.com/@PKAnExcelExpert
Last updated: June 6, 2026