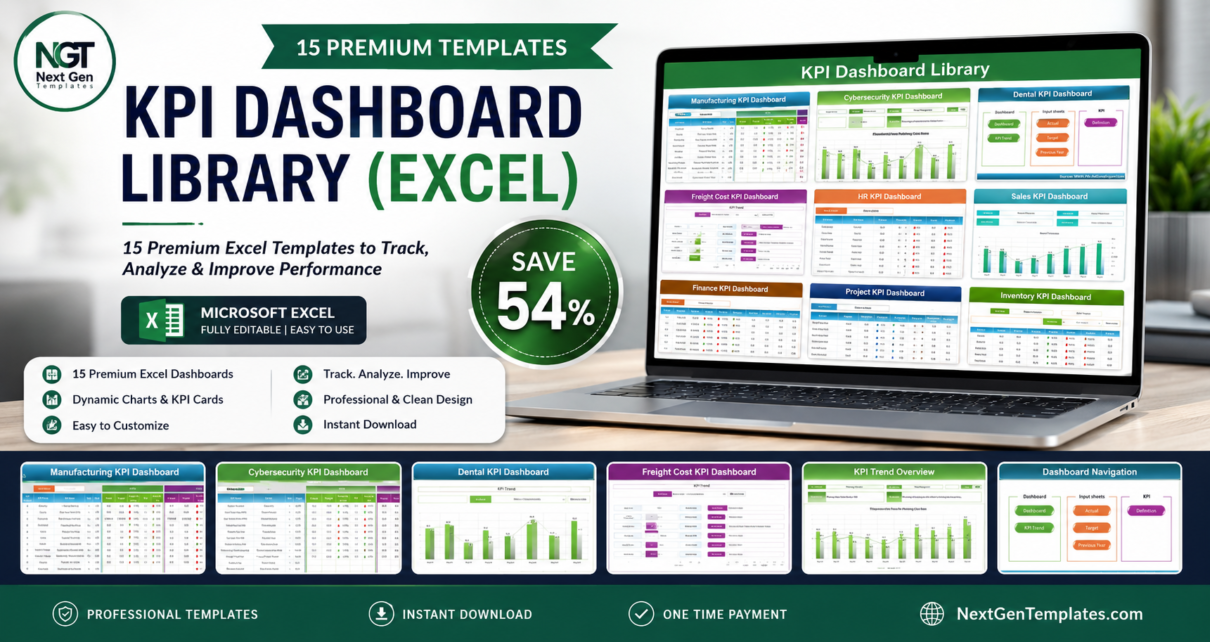
If you build reports in Excel, the KPI Dashboard Library (Excel) is the fastest way to put professional analytics in front of your team. This single bundle packs 15 premium Excel KPI dashboards covering manufacturing, IT, logistics, real estate, healthcare, insurance and safety – everything an analyst, manager or consultant needs to monitor performance across departments. Buying these dashboards one at a time would cost $194.85; as a bundle you pay just $89.99, a 54% saving of $104.86.
In this guide we walk through what is inside the library, how the dashboards work, why the bundle is far better value than individual purchases, and the best way to deploy them in your business.
Get All 15 Excel KPI Dashboards for $89.99
Individual price $194.85 → $89.99 (Save 54%)
Key Features of the KPI Dashboard Library (Excel)
Every dashboard in this Excel KPI dashboard bundle shares the same reliable framework, so once you learn one you can use all fifteen. Each file includes structured input sheets, pre-built formulas, a KPI definition sheet, and an interactive dashboard view.
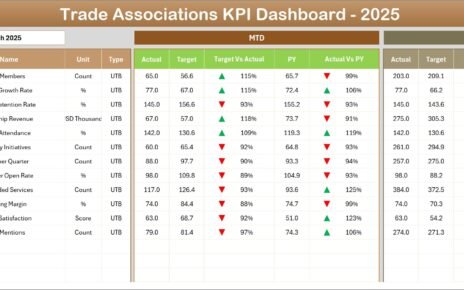
Highlights include MTD, YTD and Previous-Year tracking on every sheet so current performance is always shown against history; target-vs-actual analysis with red/amber/green conditional formatting to surface problems early; interactive charts and KPI cards that refresh automatically as you type; and a fully customizable, code-free design you can recolor and extend. Because the files are 100% Microsoft Excel, there are no add-ins or macros to enable and everything works offline on Excel 2016, 2019, 2021 and Microsoft 365.
What’s Included in the Bundle
The KPI dashboard template pack contains the following 15 dashboards. Click any heading to view the individual product on NextGenTemplates.
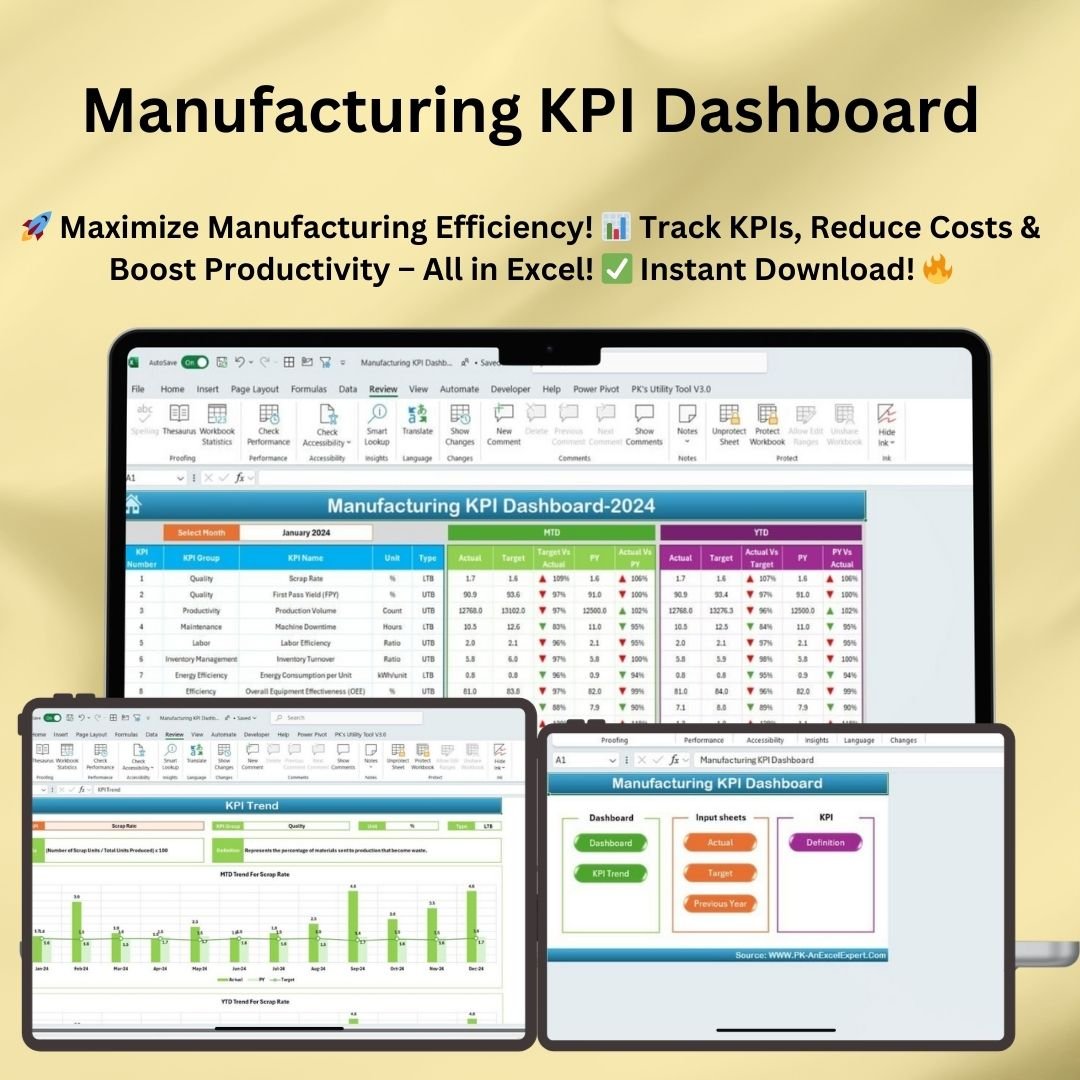
1. Manufacturing KPI Dashboard
Track production efficiency, scrap rate, cycle time, machine downtime and quality metrics such as First Pass Yield, with cost insights like COGM and inventory turnover.
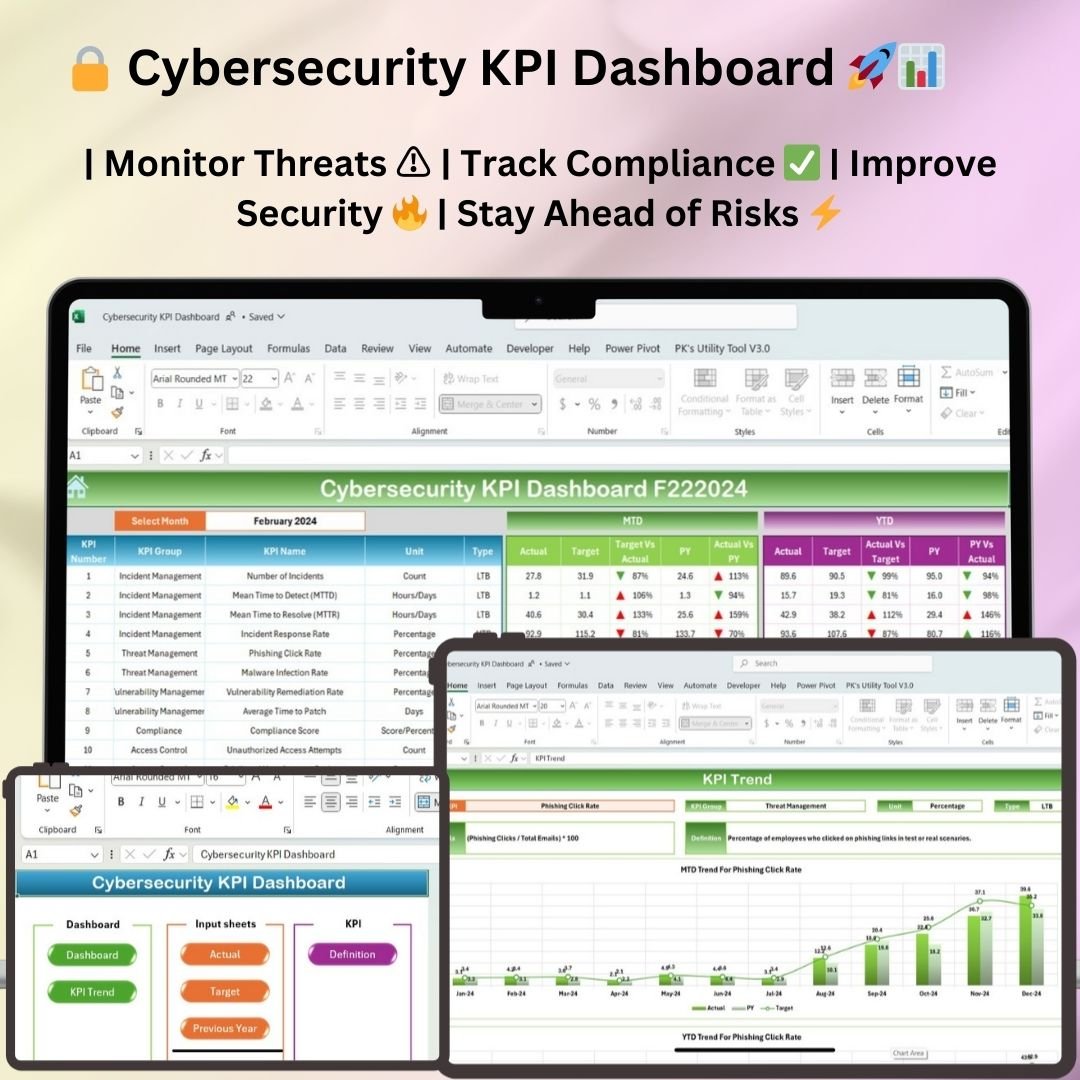
2. Cybersecurity KPI Dashboard
Monitor security incidents, mean time to detect and respond, patch compliance, phishing click rates and overall security posture in one view.
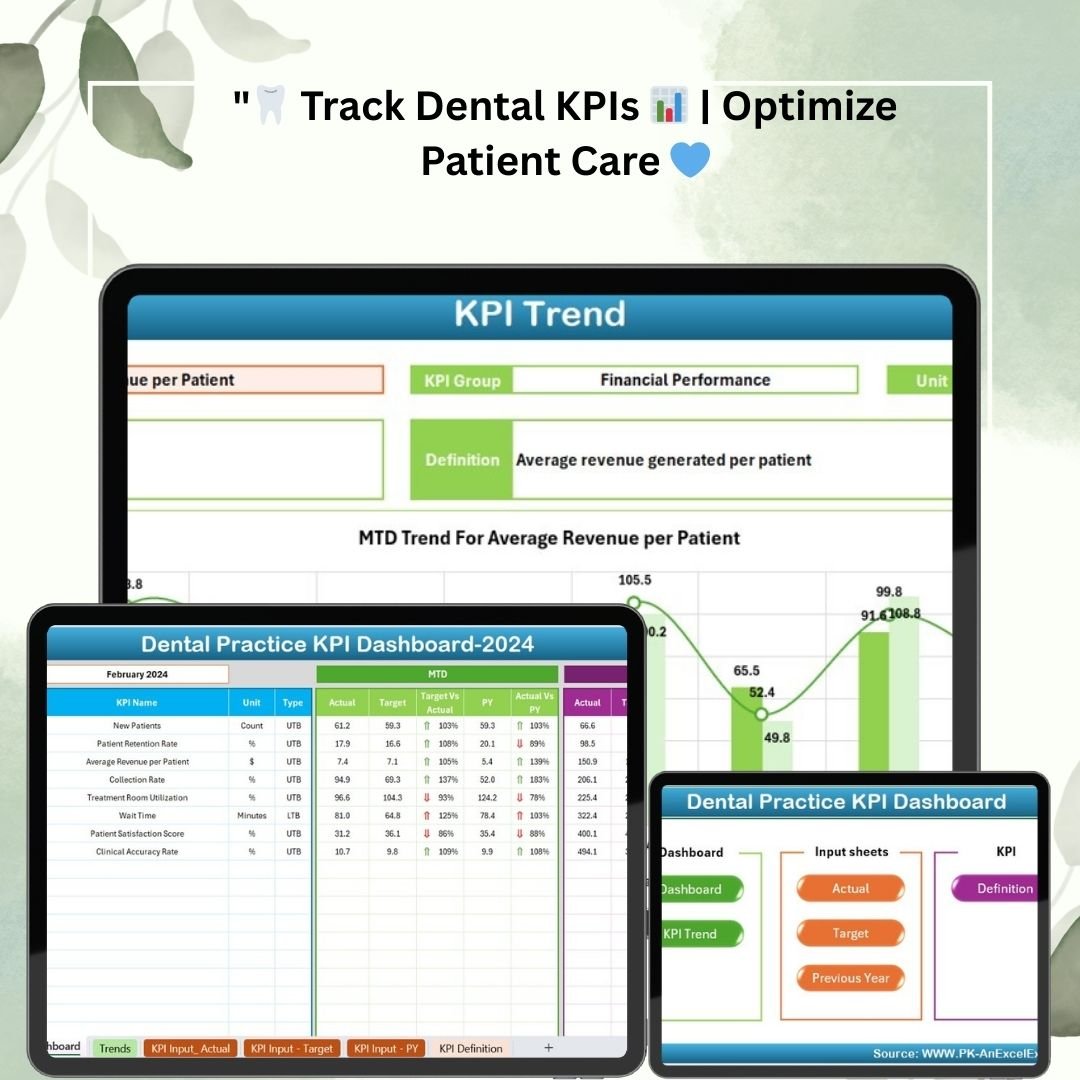
3. Dental Practice KPI Dashboard
Measure patient visits, revenue per chair, case acceptance, recall rates and practice profitability to run a healthier clinic.
4. Freight Cost KPI Dashboard
Analyze cost per shipment, cost per mile, carrier performance and freight spend trends to control logistics budgets.

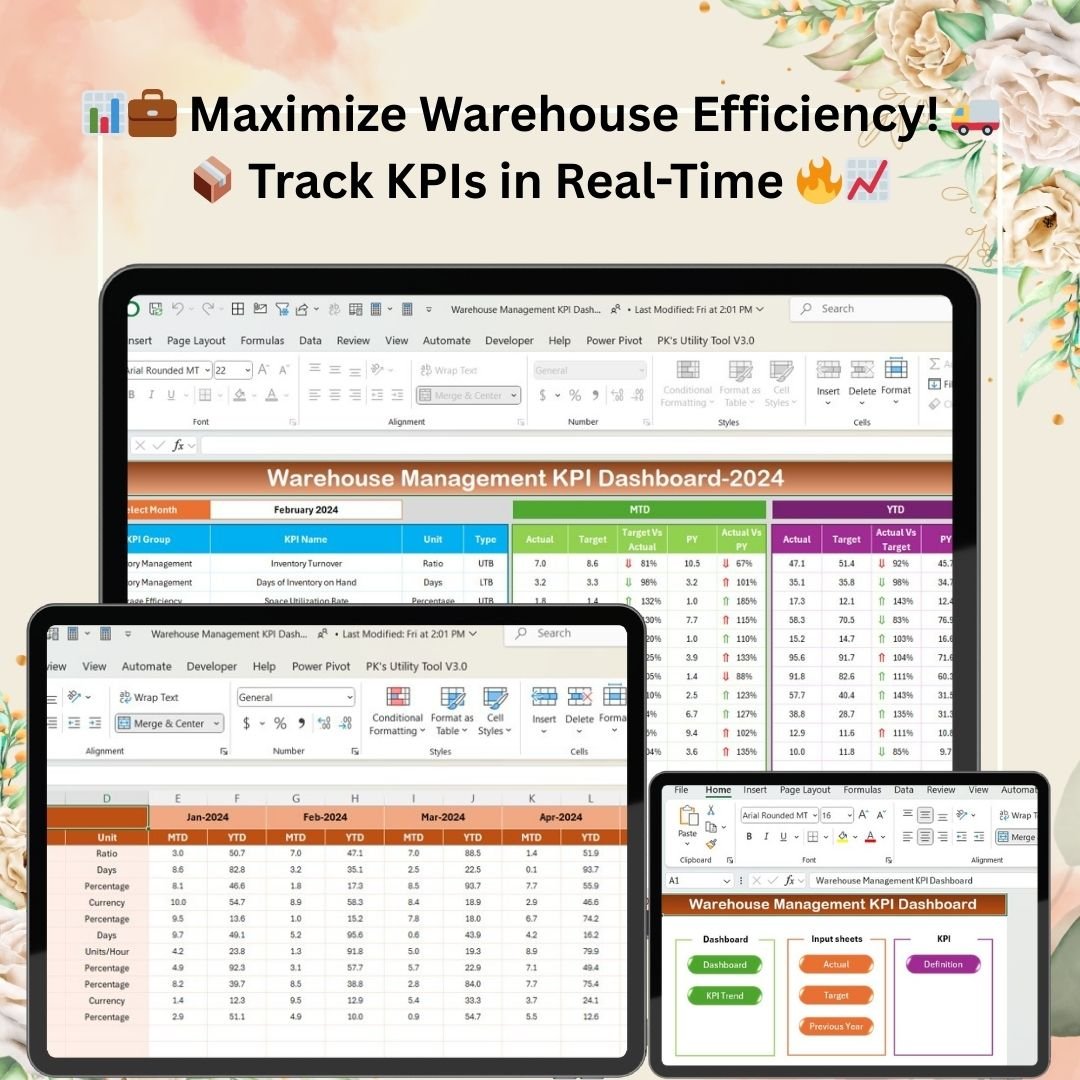
5. Warehouse Management KPI Dashboard
Track order accuracy, picking productivity, inventory turnover and space utilization across your warehouse operations.
6. Industrial Manufacturing KPI Dashboard
Monitor OEE, throughput, energy usage per unit and plant-wide production performance for heavy-industry operations.

7. Data Center KPI Dashboard
Track uptime, PUE, capacity utilization, incident response and infrastructure efficiency for data center teams.

8. IT Operations KPI Dashboard
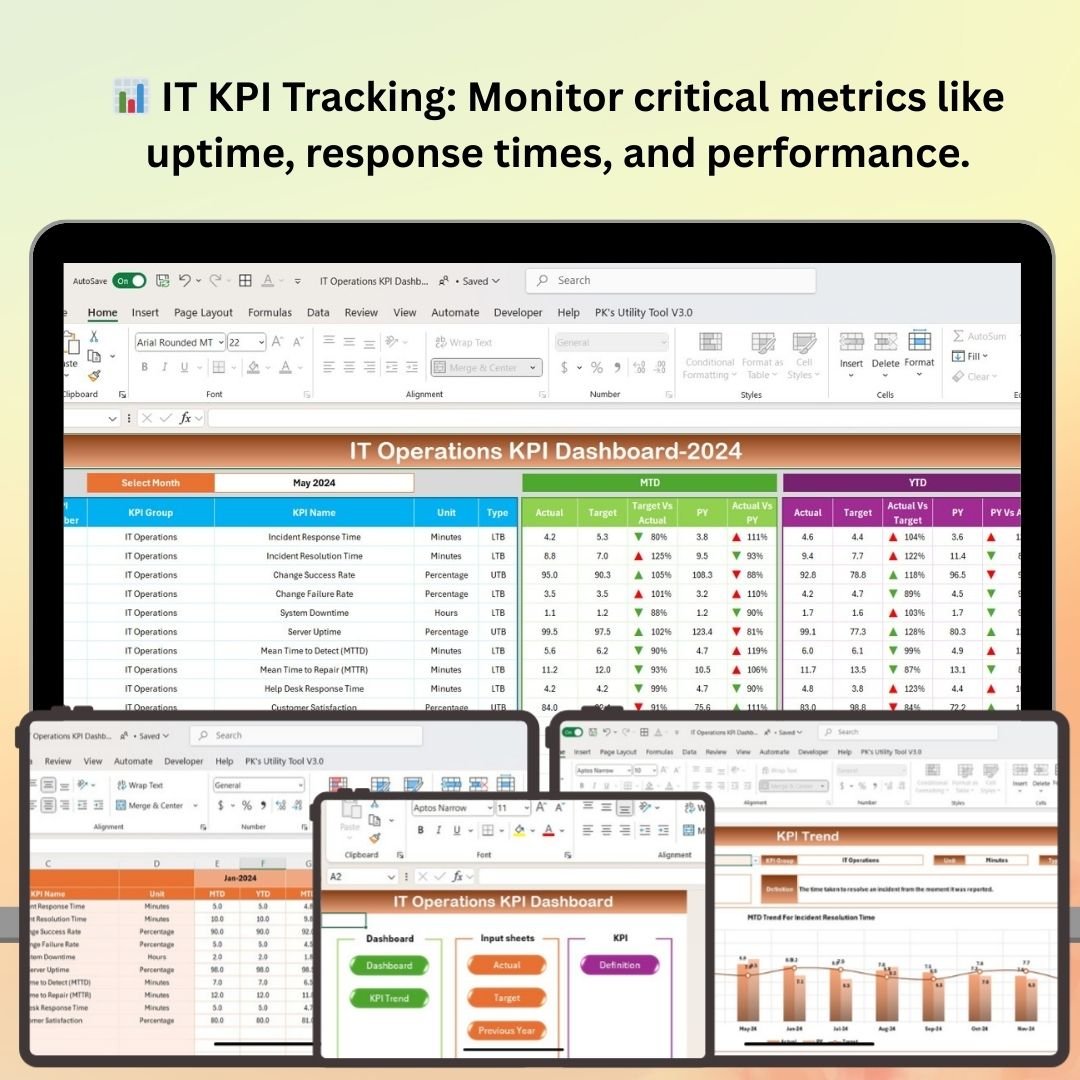
Measure ticket volume, SLA compliance, mean time to resolve, system availability and service desk performance.
9. Fleet Management KPI Dashboard
Track fuel cost, maintenance spend, vehicle utilization, downtime and cost per mile to keep your fleet efficient.

10. Construction KPI Dashboard
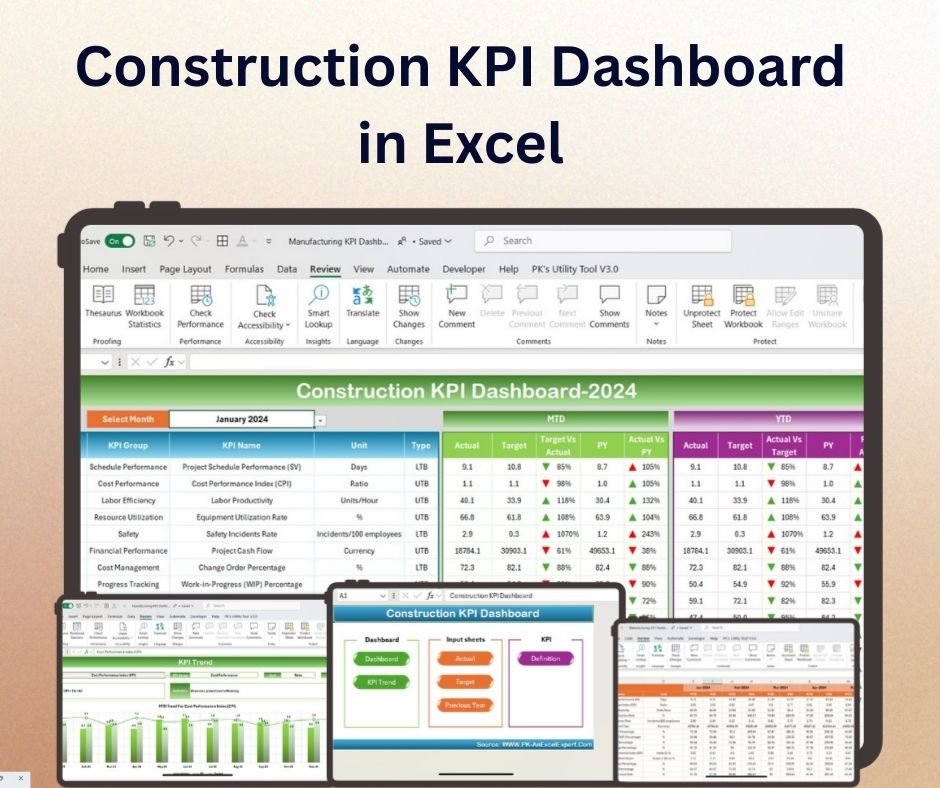
Monitor budget vs actual, schedule variance, project margins and resource utilization across construction projects.
11. Shipping KPI Dashboard
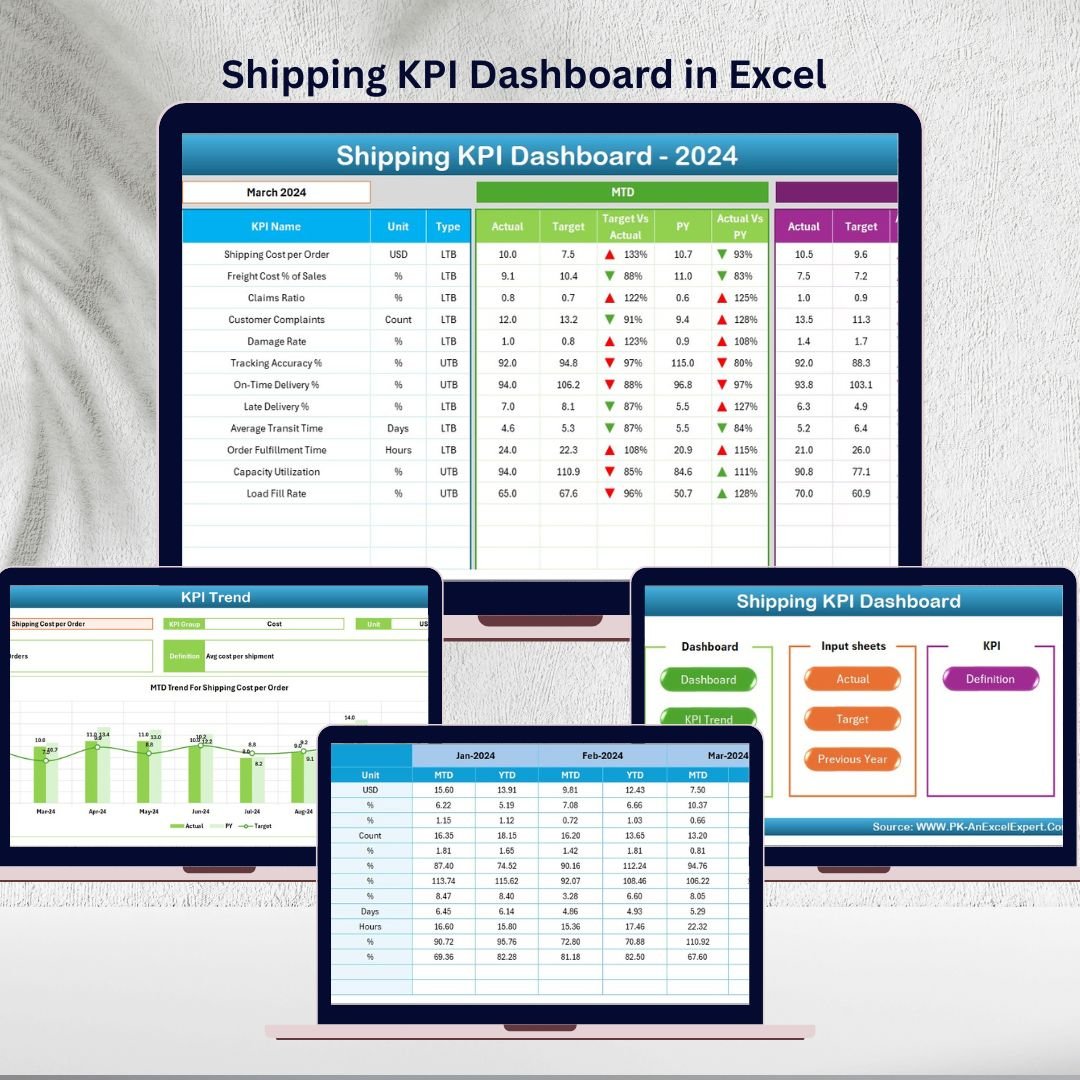
Track on-time delivery, transit time, damage rate and shipping cost per order to improve customer satisfaction.
12. Property Management KPI Dashboard
Measure occupancy, rent collection, maintenance cost and net operating income across your property portfolio.

13. Vacation Rental KPI Dashboard
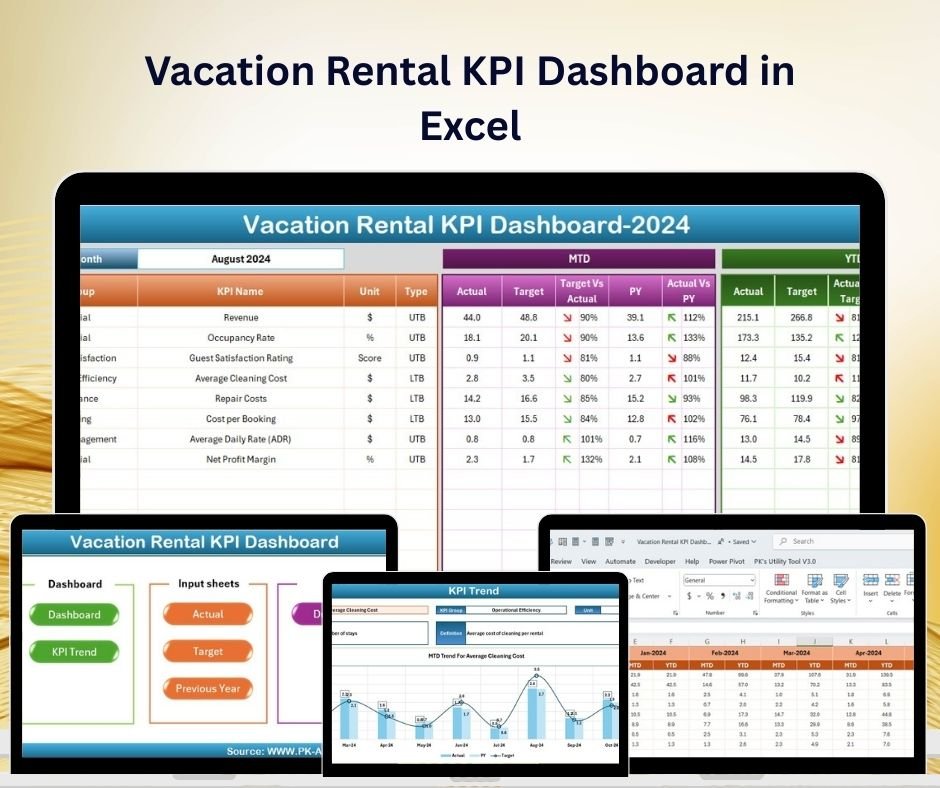
Track occupancy rate, ADR, RevPAR, booking sources and guest review scores to maximize rental revenue.
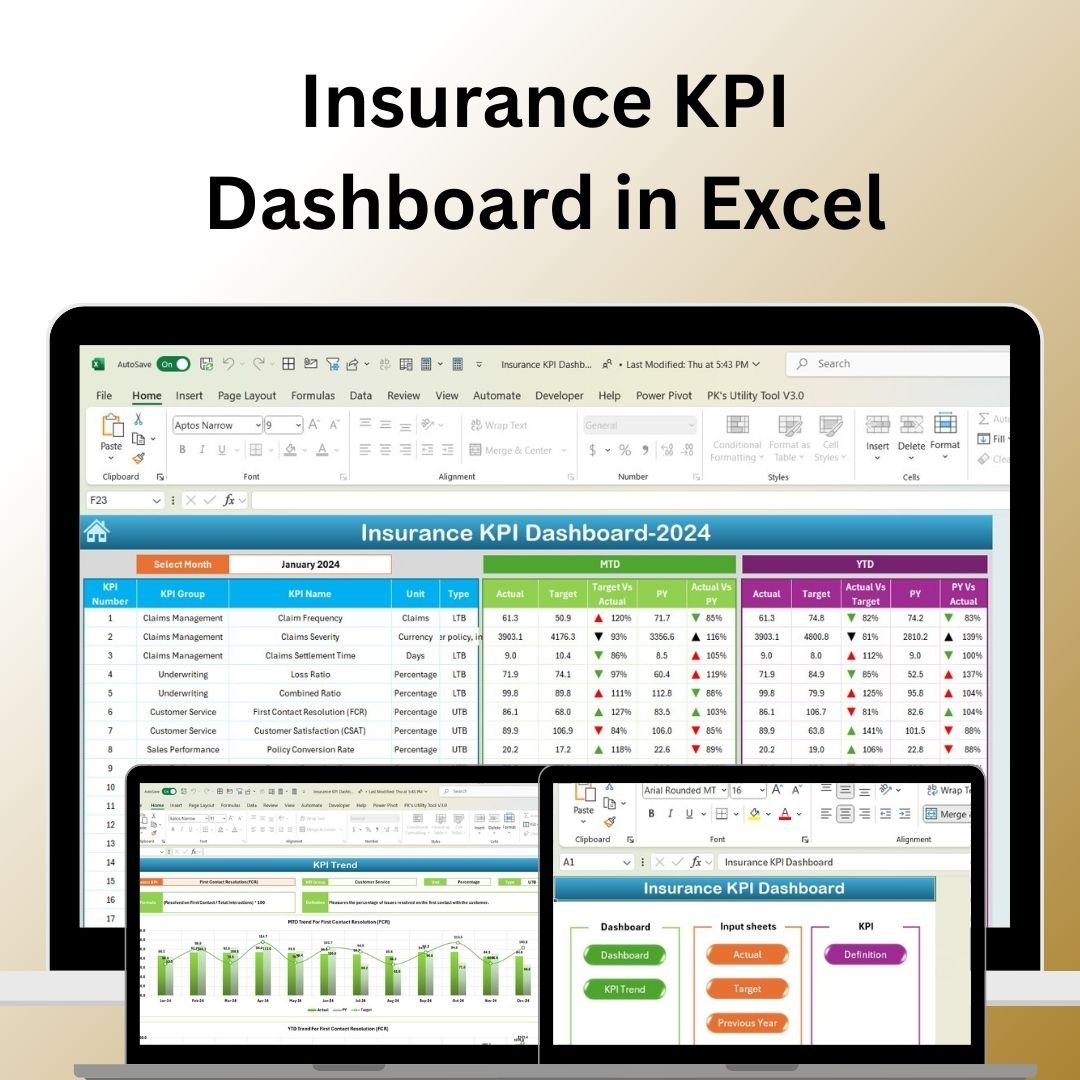
14. Insurance KPI Dashboard
Monitor loss ratio, claims cycle time, policy growth, retention and premium trends for insurance teams.
15. Construction Safety KPI Dashboard
Track incident rate, TRIR, near misses, training compliance and safety audit scores to build a safer site.

Smart Comparison – Individual vs Bundle
| Option | What You Get | Price | Saving |
|---|---|---|---|
| Buying Individually | 15 dashboards @ $12.99 | – | |
| KPI Dashboard Library (Bundle) | All 15 dashboards + free updates | $89.99 | $104.86 (54%) |
Advantages of Choosing the Bundle
Beyond the obvious price saving, the bundle gives you a consistent reporting standard across every department. Because all 15 dashboards use the same layout and KPI logic, your team learns one system and applies it everywhere – no retraining for each new report. It is also a smart move for consultants and analysts who serve clients in different industries: you carry one toolkit that covers manufacturing, IT, logistics, real estate and insurance engagements. Finally, you receive free updates and lifetime access, so the library keeps improving without extra cost.
Best Practices for Deploying the Library
Start by opening the KPI Definition sheet in each dashboard so everyone agrees on how each metric is calculated. Enter at least three months of historical data to make the MTD/YTD/PY comparisons meaningful, then set realistic targets so the conditional formatting flags genuine issues rather than noise. Keep one master copy of each file and create dated versions for monthly reporting cycles. Where several teams report into one leadership view, standardize the input format so numbers roll up cleanly. For best results, pair the dashboards with our YouTube tutorials, which walk through setup step by step.
Explore More Templates
Looking for more? Browse the full KPI Dashboard collection and the wider NextGenTemplates catalog for Excel, Google Sheets, Power BI and web-app templates across every department.
Frequently Asked Questions
What software do I need? Any modern version of Microsoft Excel (2016, 2019, 2021 or Microsoft 365) on Windows or Mac. No add-ins or internet connection are required.
How do I receive the 15 dashboards? After purchase you download a single package containing all 15 Excel files, ready to use immediately.
Can I customize the dashboards? Yes. Every file is fully editable – change colors, rename KPIs, add rows and adapt layouts without any coding.
How much do I save versus buying individually? The 15 dashboards cost $194.85 separately. The bundle is $89.99, saving you $104.86 – about 54%.
Do I get future updates? Yes, the bundle includes lifetime access and free updates to the included dashboards.
Is this suitable for consultants? Absolutely – it is ideal for analysts and consultants who need a ready library covering many industries.
Conclusion
The KPI Dashboard Library (Excel) turns 15 separate purchases into one affordable, consistent analytics toolkit. Whether you manage a factory floor, an IT service desk, a property portfolio or a consulting practice, you get enterprise-grade reporting in plain Excel for a fraction of the usual cost.
For step-by-step video tutorials on every dashboard, visit our YouTube channel.