Meme Marketing Dashboard in Excel is a ready-to-use reporting template for social media managers, digital marketing agencies, creator teams, brand marketers, and content analysts who need a clearer way to track meme-led campaign performance. Meme marketing can create fast reach, but it can also create messy reporting: platform exports, creator notes, campaign spend, production cost, engagement numbers, and conversion data often live in different files. This Excel dashboard brings those numbers into one workbook so you can review reach, engagements, conversions, ad spend, virality, platform mix, campaign ROI, audience trends, and creative insights without building every pivot and chart from scratch.
The template includes 5 dashboard pages, 5 executive KPI cards, 20 analysis charts, multiple slicers, a Data sheet, and a Support sheet with pivot tables. It is designed for practical campaign reviews, monthly client reporting, creative testing, and social media planning.
Click here to purchase Meme Marketing Dashboard in Excel
Meme Marketing Dashboard in Excel
Key Features of Meme Marketing Dashboard in Excel
- 5 dashboard pages: Overview Page, Platform Mix, Campaign ROI, Audience Trends, and Creative Insights.
- 5 KPI cards: Total Reach, Total Engagements, Total Conversions, Total Ad Spend, and Avg. Virality Score.
- 20 focused charts: Analyze platforms, campaigns, meme formats, sentiment, creators, regions, months, years, and brand categories.
- Multiple slicers: Filter quickly during content reviews, campaign retrospectives, and client meetings.
- Data sheet: Replace sample rows with your own campaign data in the same structure.
- Support sheet: Pivot tables power the dashboard dynamically and can be hidden after setup.
If you are new to refreshing Excel pivots and connected charts, Microsoft’s official Excel support is useful here: Microsoft Excel help and learning.
Dashboard Pages Explanation
1. Overview Page
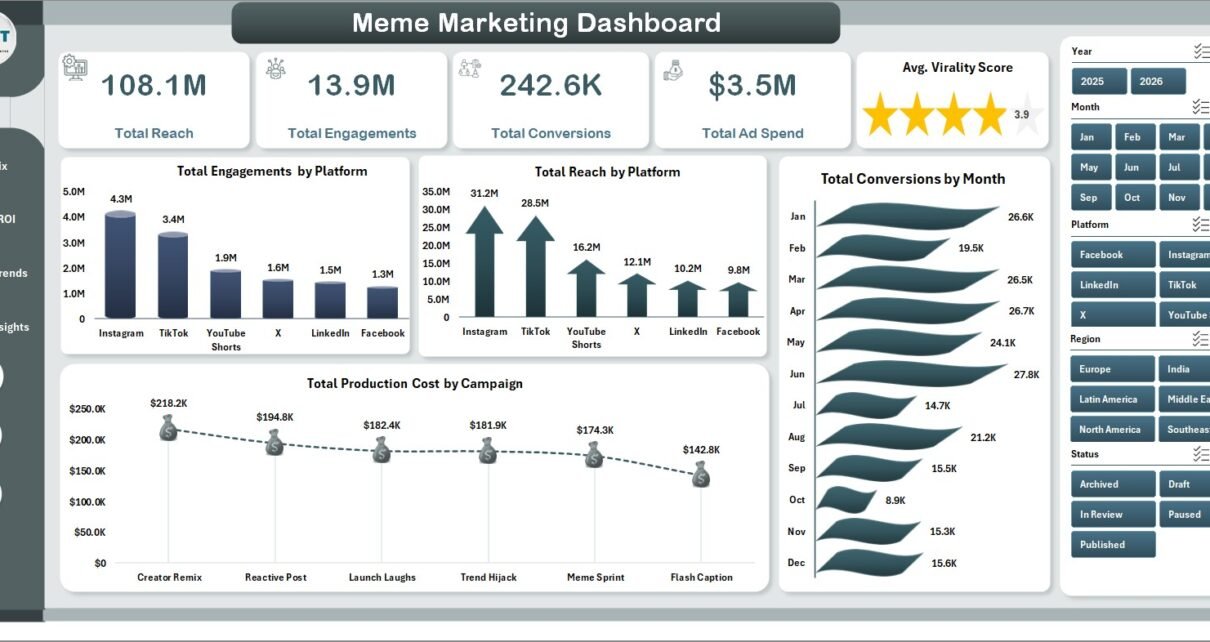
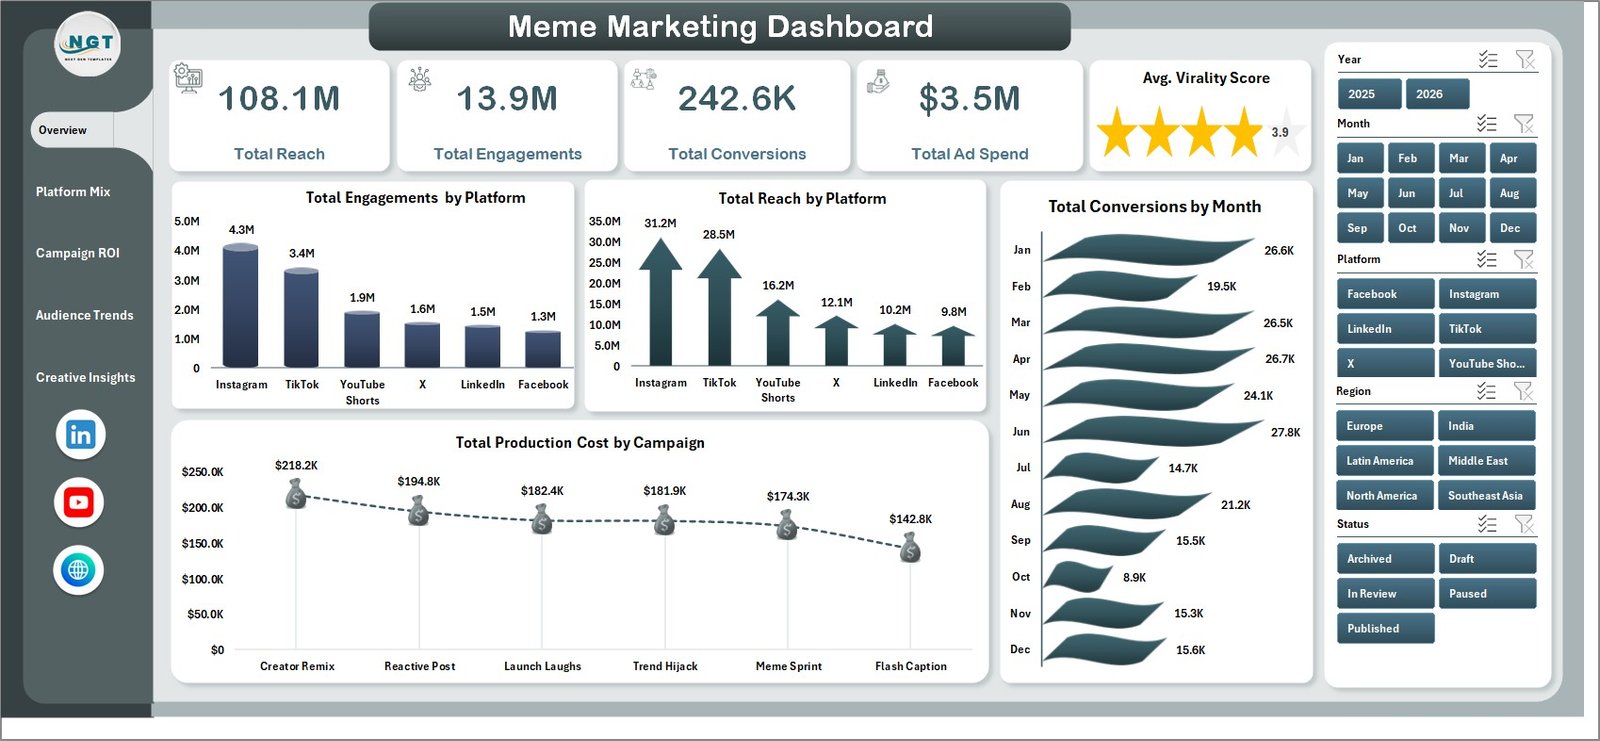
The Overview Page gives a high-level snapshot of meme marketing performance. The top cards show Total Reach, Total Engagements, Total Conversions, Total Ad Spend, and Avg. Virality Score, so a manager can understand audience scale, interaction, business outcome, cost, and viral strength at a glance.
Total Engagements by Platform: This chart compares engagement volume across platforms. It helps identify where meme content is generating the strongest interaction.
Total Reach by Platform: This visual shows how audience exposure is distributed by platform. It helps marketers see which channels are creating the broadest visibility.
Total Conversions by Month: This chart tracks conversion movement over time. It helps campaign teams see whether meme marketing is translating into stronger monthly outcomes.
Total Production Cost by Campaign: This visual compares creative production cost by campaign. It helps teams spot campaigns that require higher creation budgets.
2. Platform Mix
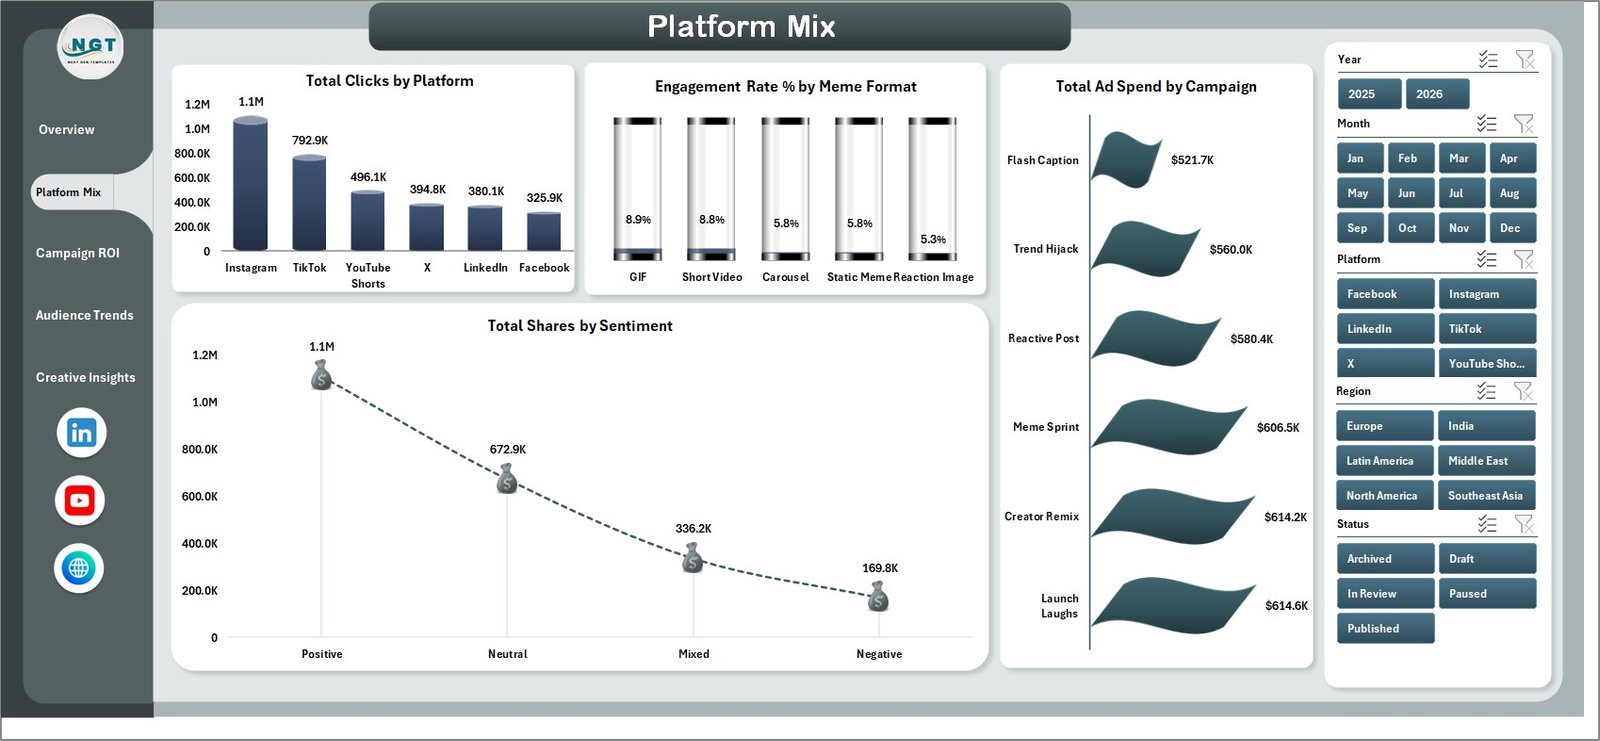
The Platform Mix page compares channel performance, meme format effectiveness, campaign spending, and sentiment-based sharing. It is useful when deciding where to post, which formats to repeat, and how budget should be distributed.
Total Clicks by Platform: This chart shows click activity by platform. It helps reveal where meme content is driving users to take the next step.
Engagement Rate % by Meme Format: This visual compares engagement efficiency across meme formats. It helps identify whether images, GIFs, videos, reaction memes, or other formats are performing better.
Total Ad Spend by Campaign: This chart compares paid spend across campaigns. It supports budget reviews and helps explain which campaigns received the most media support.
Total Shares by Sentiment: This visual shows share volume by sentiment. It helps creators understand whether humorous, positive, sarcastic, or neutral content spreads more often.
Platform Mix
3. Campaign ROI
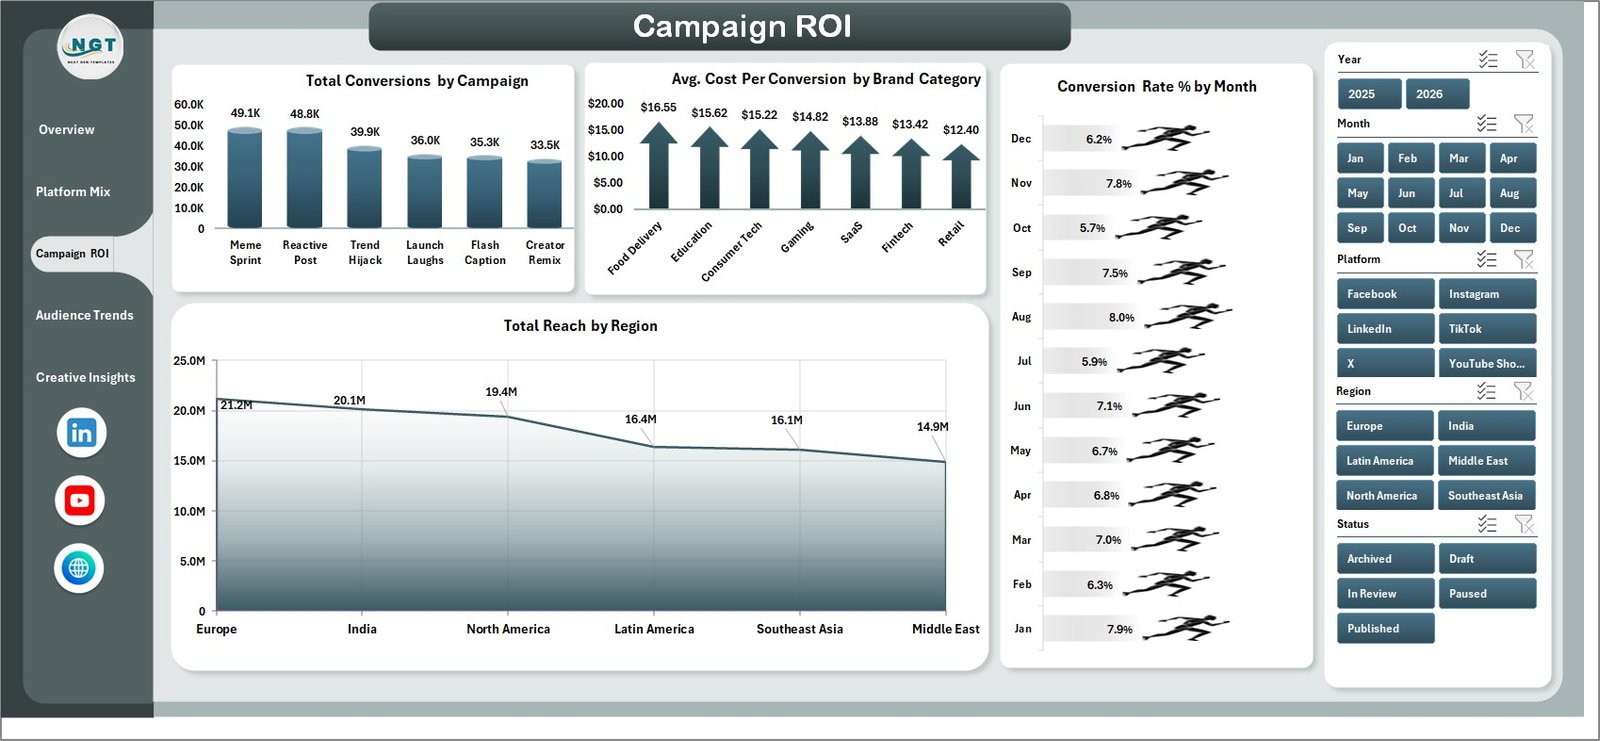
The Campaign ROI page connects creative performance to measurable business outcomes. It is built for teams that need to compare campaign conversions, cost per conversion, monthly conversion rate, and regional reach.
Total Conversions by Campaign: This chart ranks campaigns by conversion volume. It helps identify which meme campaigns produced the most measurable actions.
Avg. Cost Per Conversion by Brand Category: This visual compares conversion cost across brand categories. It helps marketers understand where campaign spending is more efficient.
Conversion Rate % by Month: This monthly chart tracks conversion efficiency over time. It helps teams see whether audience quality and campaign performance are improving.
Total Reach by Region: This visual compares reach across regions. It helps users understand where meme campaigns are gaining the most visibility.
Campaign ROI
4. Audience Trends
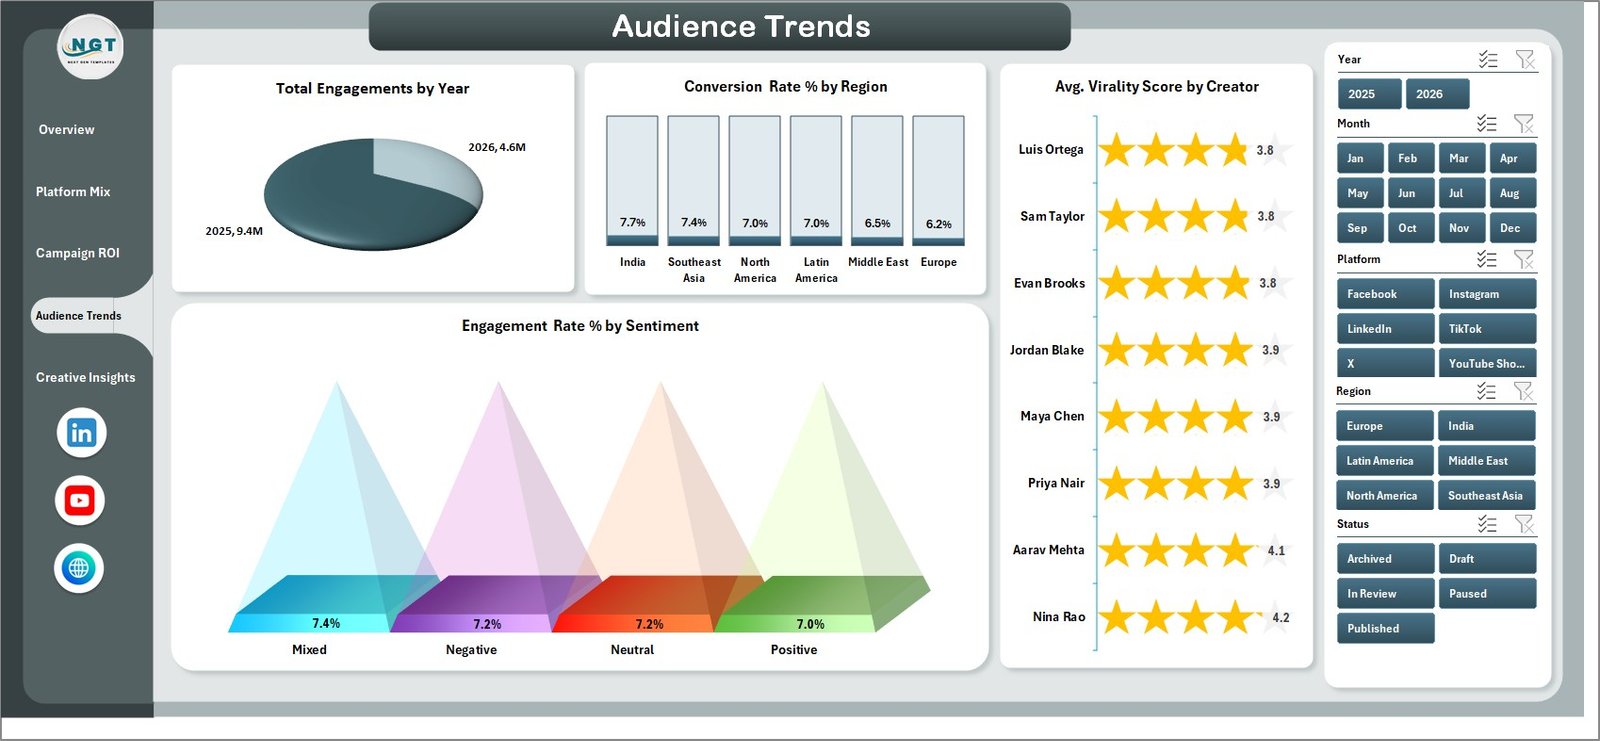
The Audience Trends page helps teams study engagement over time, regional conversion strength, creator virality, and sentiment performance. It is especially useful for retrospectives and creator planning.
Total Engagements by Year: This chart shows long-term engagement movement. It helps managers see whether meme marketing impact is growing across years.
Conversion Rate % by Region: This visual compares conversion rate by region. It helps teams identify markets where audience attention is more likely to become action.
Avg. Virality Score by Creator: This chart compares creator-level viral strength. It helps brands decide which creators or internal teams consistently produce stronger meme performance.
Engagement Rate % by Sentiment: This visual shows engagement efficiency by sentiment type. It helps creators refine the emotional angle of future memes.
Audience Trends
5. Creative Insights
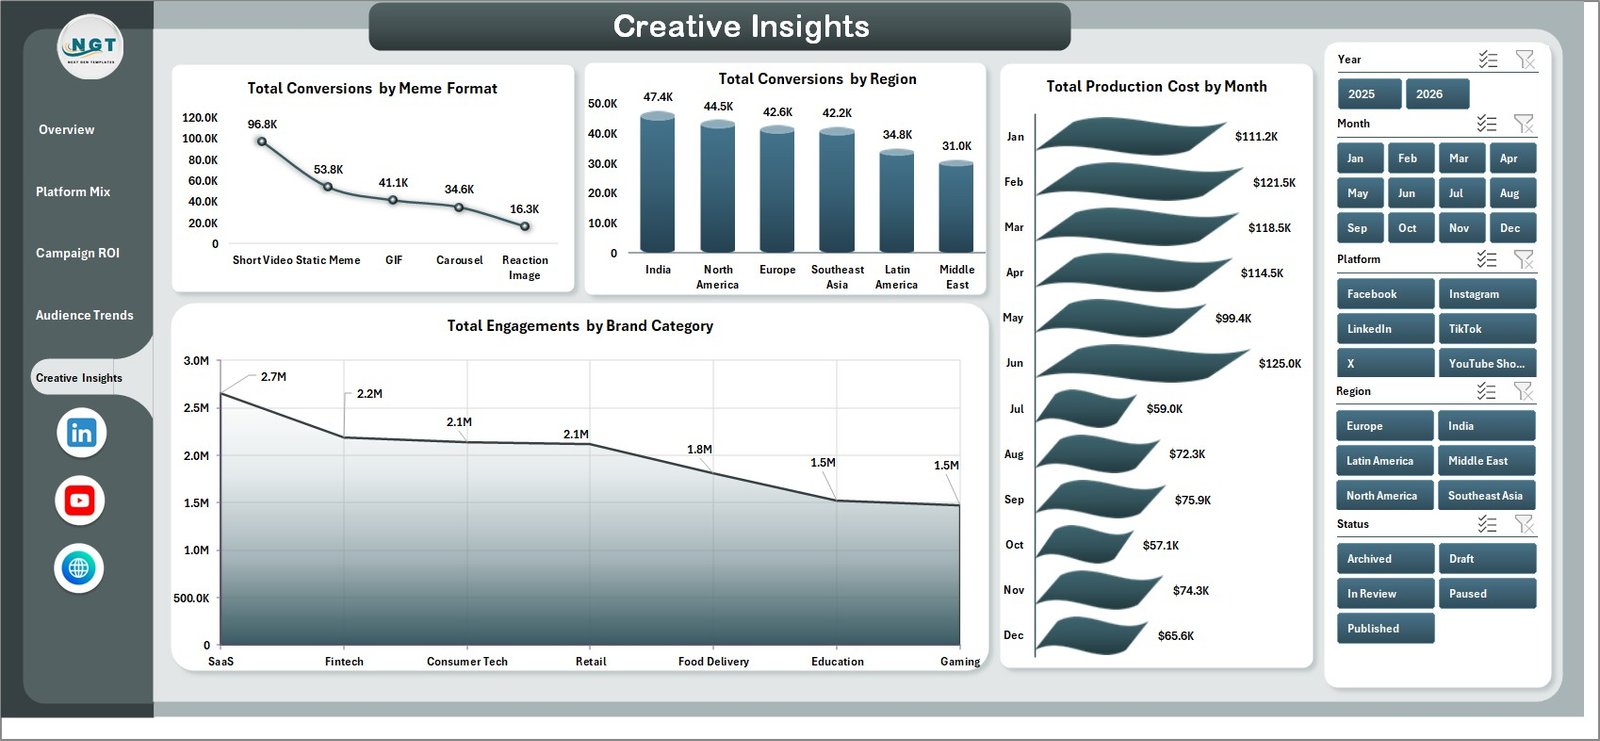
The Creative Insights page helps teams connect format, region, production cost, and brand category performance. It is useful for turning creative testing into repeatable decisions.
Total Conversions by Meme Format: This chart compares conversion output by format. It helps teams choose formats that do more than generate surface-level engagement.
Total Conversions by Region: This visual shows where conversions are happening geographically. It supports regional targeting and localization decisions.
Total Production Cost by Month: This chart tracks monthly production investment. It helps marketers connect creative cost with campaign calendars.
Total Engagements by Brand Category: This visual compares engagement by brand category. It helps agencies and brand teams understand which categories attract more audience interaction.
Creative Insights
6. Data Sheet Tab
The Data sheet is where you add campaign records in the same format as the sample data. After updating the rows, refresh the workbook so the pivot tables, slicers, cards, and charts update with your latest campaign performance.

Data Sheet tab
7. Support Sheet
The Support sheet contains pivot tables used to create the dashboard dynamically. After updating the Data sheet, go to the Data tab in the Excel Ribbon and click Refresh All. You can keep this sheet hidden after setup.

Support sheet tab
Meme Marketing Dashboard in Excel vs. Google Sheets vs. Paid CRM/SaaS – Feature Comparison
| Feature | This Excel Dashboard | Google Sheets Alternative | Paid Marketing SaaS |
|---|---|---|---|
| Cost | $17.99 sale price | Template or manual build | Recurring subscription |
| Platform | Microsoft Excel | Google Sheets | Vendor cloud platform |
| Setup time | Open workbook, replace data, refresh all | Build formulas/charts or adapt a sheet | Account setup and implementation |
| Real-time team collaboration | Best through shared Excel/OneDrive workflow | Strong browser collaboration | Plan dependent |
| Mobile access | Available through Excel mobile with limitations | Available through browser/mobile app | Usually available |
| Customizable fields | Editable sheets, pivots, charts, and formulas | Editable but formula care is needed | Limited by vendor settings |
| Share with link | Available through OneDrive/SharePoint | Native sharing | Login controlled |
| Year-1 cost at 5 users | $17.99 plus Microsoft licensing if needed | Usually low but manual report work remains | Often hundreds or thousands |
| Meme campaign analysis | Ready-made pages for reach, engagement, conversions, virality, cost, creators, sentiment, platforms, and ROI | Must be designed or adapted | Depends on analytics module and export access |
Who Should Use This Template
This template is a good fit for social media managers, meme page operators, creator teams, influencer marketing teams, brand managers, digital marketing agencies, content analysts, startup founders, and consultants who track campaign results in rows and want a repeatable Excel dashboard.
It is not a live social media scheduler, ad platform API connector, comment moderation tool, influencer payment system, or CRM. It works best when you already have campaign data exported or maintained in a structured table.
Real-World Use Cases
Social media manager: Reviews reach, engagement, shares, clicks, and conversions by platform before deciding where the next campaign should run.
Agency campaign lead: Compares ad spend, production cost, conversion rate, and cost per conversion across campaigns during client reporting.
Creator partnership manager: Uses virality score by creator and engagement rate by sentiment to decide which creators and meme angles deserve repeat investment.
Advantages of Meme Marketing Dashboard in Excel
The first advantage is speed. The workbook already includes dashboard pages, cards, slicers, charts, a data input sheet, and a pivot support structure, so users do not start from a blank file.
The second advantage is control. Because this is an Excel dashboard, users can edit formulas, chart formatting, pivot fields, colors, sheet names, and data rows as their reporting needs change.
The third advantage is cost. A one-time Excel template can be easier to justify for small teams, agencies, creators, and startups that do not want another recurring analytics subscription.
Opportunities for Improvement
The dashboard depends on clean input data, so teams should standardize campaign names, platform names, creators, regions, dates, formats, and sentiment labels before analysis. If the same platform is entered with multiple spellings, charts may split the results.
Another improvement opportunity is automation. Advanced users can connect exported CSV files, Power Query, or shared Excel sources to reduce manual copy-paste work, but the base template is designed to stay simple and editable.
Best Practices
Update the Data sheet on a consistent schedule, such as weekly for active campaigns or monthly for reporting. Keep campaign names stable, document how virality score is calculated, and avoid mixing paid and organic results unless you intentionally want a combined view.
Use the Overview Page for executive review, Platform Mix for channel strategy, Campaign ROI for budget decisions, Audience Trends for creator and regional planning, and Creative Insights for format testing.
Explore Relevant Templates
- Meme Marketing Dashboard in Excel – the Excel dashboard covered in this article.
- Meme and Viral Content Creation Dashboard in Power BI – Power BI version for viral content analytics.
- Meme and Viral Content Creation KPI Dashboard in Excel – KPI-focused Excel dashboard for meme content.
- Browse Excel dashboard templates.
Frequently Asked Questions
What does the Meme Marketing Dashboard in Excel track?
It tracks reach, engagements, clicks, shares, conversions, ad spend, production cost, virality score, engagement rate, conversion rate, cost per conversion, platforms, campaigns, meme formats, sentiment, creators, regions, months, years, and brand categories.
Can I use my own data?
Yes. Replace the sample rows in the Data sheet with your own campaign records, then refresh all pivots and charts.
Do I need advanced Excel skills?
No. Basic Excel users can update the Data sheet and refresh the workbook. Advanced users can customize pivots, charts, formulas, and layout.
Does it connect directly to social platforms?
No direct Instagram, TikTok, Facebook, YouTube, or X API connector is included. Export or maintain your data in the Data sheet, then refresh the dashboard.
Can agencies use it for client reporting?
Yes. Agencies can adapt the workbook for recurring client campaign reviews, creative testing summaries, and monthly performance reporting.
Can I customize the dashboard pages?
Yes. You can edit charts, slicers, pivots, labels, colors, and formulas in Excel.
About the Author
Built by PK – Microsoft Certified Professional with 15+ years of Excel, Google Sheets, and Power BI experience. Founder of NextGenTemplates, reaching 300K+ subscribers across YouTube channels. Every template is hand-built and tested before release.
Conclusion
The Meme Marketing Dashboard in Excel turns meme campaign activity into a structured reporting system. Instead of guessing which platform, creator, format, sentiment, or campaign worked best, teams can review the metrics in one workbook and make better content decisions.
Download the Meme Marketing Dashboard in Excel and start tracking meme reach, engagements, conversions, ad spend, virality, campaign ROI, audience trends, and creative insights in Excel.
Visit our YouTube channel to learn step-by-step Excel, dashboard, and automation tutorials.